Back to Journals » Cancer Management and Research » Volume 18

A Multiphase CT-Based Radiomics-Clinical Model to Identify Inadequate Future Liver Remnant Hypertrophy After Portal Vein Embolization Before Major Hepatectomy
Authors Zhou R, Liu D, Huang J, Liu F, Zhou W, Zou M, Wu X, Liu H, Jia N ![]()
Received 17 October 2025
Accepted for publication 11 February 2026
Published 17 February 2026 Volume 2026:18 573304
DOI https://doi.org/10.2147/CMAR.S573304
Checked for plagiarism Yes
Review by Single anonymous peer review
Peer reviewer comments 3
Editor who approved publication: Dr Giuseppe Colloca
Rui Zhou,1,2,* Dong Liu,1,* Jian Huang,3,* Fuchen Liu,4 Wenxuan Zhou,4 Minhao Zou,4 Xiaoqin Wu,2 Hui Liu,4 Ningyang Jia1
1Department of Imaging and Nuclear Medicine, Third Affiliated Hospital of Naval Medical University, Shanghai, 200433, People’s Republic of China; 2School of Health Science and Engineering, University of Shanghai for Science and Technology, Shanghai, 200093, People’s Republic of China; 3Department of Interventional Radiology, Third Affiliated Hospital of Naval Medical University, Shanghai, 200433, People’s Republic of China; 4Department of Hepatic (III), Third Affiliated Hospital of Naval Medical University, Shanghai, 200433, People’s Republic of China
*These authors contributed equally to this work
Correspondence: Hui Liu, Department of Hepatic (III), Third Affiliated Hospital of Naval Medical University, Shanghai, 200433, People’s Republic of China, Email [email protected]; [email protected] Ningyang Jia, Department of Imaging and Nuclear Medicine, Third Affiliated Hospital of Naval Medical University, Shanghai, 200433, People’s Republic of China, Email [email protected]
Purpose: To develop and internally validate a multiphase contrast-enhanced computed tomography (CT) based radiomics–clinical nomogram for pre-operative prediction of inadequate future liver remnant (FLR) hypertrophy after portal vein embolization (PVE), with the aim of guiding individualized surgical planning.
Patients and Methods: We retrospectively enrolled patients who underwent PVE at our centre. Contrast-enhanced CT and clinical data were collected before and 2– 5 weeks after PVE for calculated FLR (cFLR≥ 30% defined as adequate hypertrophy). After liver segmentation on triphasic CT, radiomic features were extracted and reduced by LASSO to build a Rad-signature. This signature was integrated with significant clinical variables into an MLP fusion model, visualised as a nomogram, and evaluated using ROC, calibration and decision-curve analyses.
Results: A total of 98 patients were included in this study. The fusion model achieved an area under the receiver-operating-characteristic curve (AUC) of 0.913 (95% CI 0.846– 0.981) in the training cohort and 0.833 (95% CI 0.605– 1.000) in the internal test cohort, outperforming the clinical-only model (AUC 0.714; DeLong P = 0.017). Sensitivity and specificity in the test set were 0.824 and 1.000, respectively. Pre-PVE FLR, cFLR, serum pre-albumin, prior chemotherapy, hepatitis status and underlying cirrhosis were independent predictors of adequate hypertrophy. Decision-curve analysis demonstrated net clinical benefit within a threshold probability range of 20– 80%.
Conclusion: The proposed multiphase CECT radiomics–clinical nomogram showed potential for identifying patients at high risk of insufficient FLR hypertrophy after PVE. This internally validated model holds promise for supporting personalised planning in hepatobiliary surgery.
Keywords: portal vein embolization, future remnant liver hypertrophy, radiomics, outcome prediction
Introduction
Hepatocellular carcinoma (HCC) ranks as the sixth most common malignancy worldwide and represents the third leading cause of cancer-related mortality.1 Curative-intent hepatectomy remains the treatment of choice; however, large tumour burden or unfavourable anatomical location frequently necessitates extended liver resection.2,3 Such extensive procedures are associated with a markedly elevated incidence of postoperative complications and mortality.4 Among these, acute liver failure attributable to an insufficient future liver remnant (FLR) is the most severe,5,6 occurring in 22–33% of cases and carrying a mortality rate of 52–68%. Pre-operative augmentation of FLR is therefore the most effective strategy to prevent post-hepatectomy liver failure.7–10
Currently, portal vein embolization (PVE) is the standard clinical approach to augment FLR. Nevertheless, approximately 32% of patients who undergo PVE ultimately fail to proceed to curative resection, primarily because of tumour progression during the hypertrophy interval and, secondarily, owing to inadequate or absent FLR growth.11,12 Accurate pre-operative prediction of post-PVE liver hypertrophy is therefore essential for tailoring individualized therapeutic strategies. Although the literature continues to debate the optimal volumetric cut-off, a FLR/total liver volume ratio ≥ 30% is generally accepted for patients with preserved hepatic function.13–16 To date, however, no reliable parameter or universally recognized gold standard exists for pre-operatively determining whether this threshold will be attained after PVE.
Radiomics is an emerging high-throughput discipline that extracts and quantifies imperceptible imaging phenotypes from standard medical images. Predictive models derived from these features have been increasingly employed for diagnosis, treatment response assessment, and prognosis estimation, thereby supporting individualized clinical decision-making.17 Current research indicates that CT texture features can predict liver regenerative capacity.18 The objective of this study was to develop an integrated nomogram that combines radiomic signatures from triphasic contrast-enhanced computed tomography (arterial, portal-venous, and delayed phases) with pertinent clinical variables to pre-operatively predict adequate FLR hypertrophy following portal vein embolization.
Patients and Methods
Study Population
This single-centre, retrospective study consecutively screened 452 patients who underwent portal vein embolization (PVE) at the Third Affiliated Hospital of Naval Medical University between November 2014 and April 2024. Due to the retrospective nature of the study, informed consent from patients was waived by the Third Affiliated Hospital of Naval Medical University Ethics Committee (approval ID: EHBHKY2022-H-P002). The study was conducted in accordance with the Declaration of Helsinki, ensuring patient data confidentiality and privacy were strictly maintained throughout the research process. Three-hundred and fifty-four individuals were excluded for incomplete clinical records or failure to undergo two standardized three-dimensional abdominal computed tomography (CT) reconstructions (pre-PVE and post-PVE follow-up). Consequently, 98 patients were retained for final analysis (Figure 1). Owing to the retrospective design, the requirement for informed consent was waived, and the study protocol was approved by the institutional ethics committee (approval ID: EHBHKY2022-H-P002).
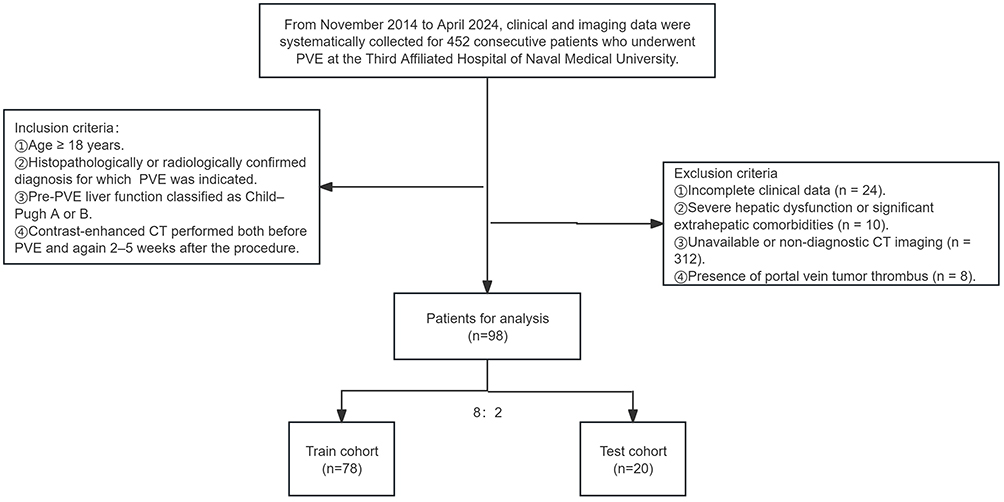 |
Figure 1 Patient selection flowchart illustrating inclusion and exclusion criteria for the final study cohort. |
PVE
Under ultrasound guidance, a 21-gauge EV needle was advanced into the right portal vein, and a hydrophilic soft-tipped guidewire was inserted. A 5-F angiographic catheter was then introduced over the wire, and its tip was positioned in the main portal trunk to obtain a portogram delineating the entire intrahepatic portal venous anatomy. Using a combined wire–catheter technique, the right portal vein was selectively cannulated, and a micro-catheter was further advanced into the secondary-order branches supplying the target hepatic segments. Embolization was performed with a mixture of n-butyl-2-cyanoacrylate (NBCA) tissue adhesive or polyvinyl alcohol (PVA) particles, supplemented with metallic coils, until complete occlusion of all intended portal branches was achieved.19 Following the initial embolization, repeat portography was performed via the main portal trunk to verify the extent of occlusion. If any targeted portal branches remained patent, the aforementioned embolization sequence was repeated until complete segmental occlusion was angiographically confirmed.
CT Imaging and Volumetry
All CT datasets were acquired on a third-generation dual-source 96-row Siemens SOMATOM Force scanner using the following parameters: tube voltage 120 kVp, tube current modulated automatically (Auto mAs), slice thickness 1 mm, increment 0.7 mm, and rotation time 0.8s. Non-ionic iodinated contrast medium (iopromide, 350 mgI/mL) was administered intravenously at 4.0–4.5 mL/s via a power injector. Each patient underwent unenhanced imaging followed by three contrast-enhanced phases: arterial, portal-venous, and delayed.
DICOM datasets were imported into a proprietary 3-D visualization platform (Shenzhen Xudong Digital Medical Imaging Technology Co., Ltd.) for automated segmentation and volumetric assessment of the spleen, tumour, and total liver. FLR was defined as the combined volume of Couinaud segments II and III. The calculation of the FLR ratio correlates with both the total liver volume (TLV) and tumour volume (TV). The calculated FLR ratio (cFLR) was computed as: cFLR = FLR / (TLV − TV) × 100%.20,21 Follow-up CT performed 2–5 weeks after PVE was used to determine hypertrophy adequacy; a cFLR ≥ 30% was considered sufficient hypertrophy, whereas values < 30% indicated insufficient hypertrophy.
Image Segmentation and Feature Extraction
The radiomics workflow comprised lesion segmentation, feature extraction, feature selection, and model construction, as illustrated in Figure 2. To ensure stability and reproducibility, two abdominal radiologists with 5 and 10 years of experience, respectively, manually delineated the liver contour on each slice of arterial, portal-venous, and delayed-phase contrast-enhanced CT images using 3D Slicer (v.4.11), generating three-dimensional volumes of interest (VOIs). Under identical settings (bin width = 25, window level = 50, window width = 280), both readers independently extracted radiomic features from each VOI with the Python pyradiomics package. Features with an intraclass correlation coefficient (ICC) ≥ 0.8 were retained, yielding 321 robust features per patient: 54 first-order statistics, 42 shape attributes, and 225 texture descriptors quantifying morphology (eg, compactness, sphericity), intensity distribution (mean, standard deviation, median, and higher-order histogram metrics), and spatial heterogeneity. Texture features included five matrix types: gray-level dependence matrix (GLDM), gray-level co-occurrence matrix (GLCM), gray-level run-length matrix (GLRLM), gray-level size-zone matrix (GLSZM), and neighboring gray-tone difference matrix (NGTDM).
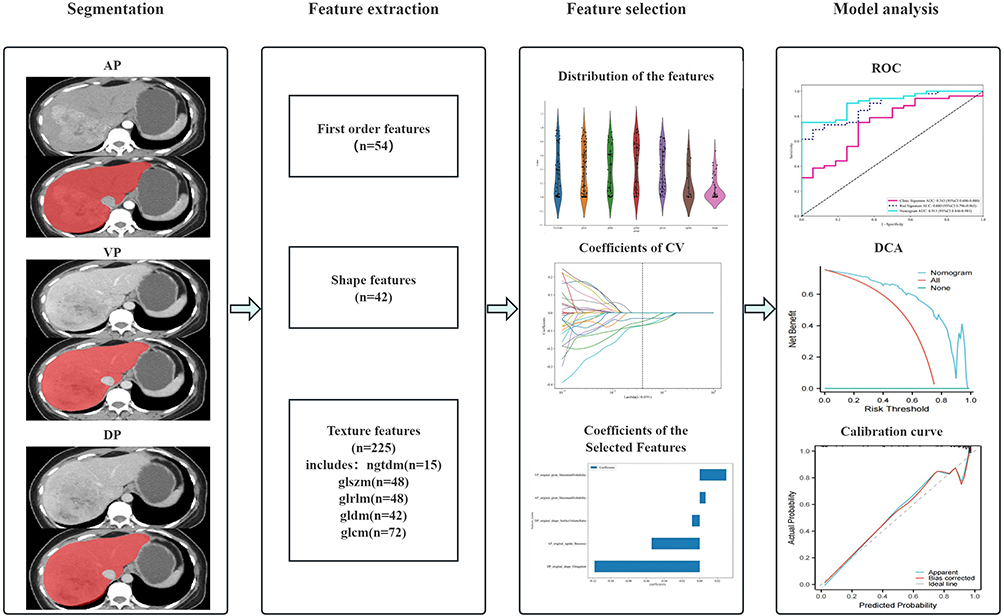 |
Figure 2 This figure illustrates the completed workflow of radiomics model development. Initially, liver images were segmented in anterior-posterior (AP), vertical (VP), and dorsal (DP) views to isolate the region of interest. Subsequently, features were extracted from the segmented images, categorized into first-order features (n=54), shape features (n=42), and texture features (n=225), which include various gray-level co-occurrence matrix (GLCM) measures. Following this, the extracted features were analyzed for distribution and their coefficients of cross-validation (CV) were determined to select the most informative features. Finally, model performance was evaluated using ROC curves, decision curve analysis (DCA), and calibration curves. |
Features Selection and Radiomics Model Building
Initially, using z-score standardization, all feature values were normalized to a range between 0 and 1, which improves comparability. Normally distributed features were compared using an independent-samples t-test, while non-normally distributed features were assessed with the Mann–Whitney U-test; only features with P < 0.05 were retained. Next, Spearman rank correlation coefficients were computed among the remaining features, and when |ρ| > 0.9, the feature with higher redundancy was discarded. A greedy recursive elimination strategy was then applied to iteratively remove the most redundant feature until no further reduction was possible, yielding 23 stable features.
In the training cohort, these 23 features were further refined using least absolute shrinkage and selection operator (LASSO) logistic regression to construct the radiomics signature (Rad Signature). The optimal tuning parameter λ was selected via ten-fold cross-validation based on the minimum mean squared error criterion. Features with non-zero coefficients were retained, and their corresponding regression coefficients were used as weights. All LASSO analyses were implemented using the scikit-learn package in Python. We utilized a Multilayer Perceptron (MLP) classifier in our analysis, configured with a specific architecture designed to optimize performance. The MLP model comprised four hidden layers with neuron counts of 61, 128, 64, and 32 respectively. The training process was governed by a maximum of 300 iterations, and employed the stochastic gradient descent (SGD) optimizer. To ensure generalizability and prevent overfitting, we incorporated L2 regularization. The model was initialized with a random state set to 0 for reproducibility. Finally, the selected features were fed into the MLP model, and the final radiomics score (Rad-score) was derived through five-fold cross-validation.
The Building of the Clinical Model and Radiomics-Clinical Model
To ensure unbiased comparison between the clinical model and radiomics model, we constructed the clinical feature set following the identical protocol. Initially, univariate logistic regression analysis was conducted in the training cohort to identify variables with statistically significant differences (P < 0.05) for subsequent modeling. Subsequently, a clinical signature was built using the same machine learning algorithms as the radiomics model, with fixed ten-fold cross-validation and an independent test set to ensure a fair comparison between the two approaches. Finally, multivariable logistic regression integrating the retained clinical and radiomic features was performed, with backward stepwise elimination used to derive the combined radiomics-clinical prediction model, which was subsequently visualised as a nomogram.
Statistical Analysis
To evaluate the consistency of feature distributions between the training and test cohorts, continuous variables were compared using either an independent-samples t-test or the Mann–Whitney U-test, depending on normality; normally distributed data are presented as mean ± SD, and non-normally distributed data as median (inter-quartile range). Categorical variables were compared using the χ2-test. In univariate logistic regression, variables with p-values < 0.05 were included in multivariate logistic regression to identify independent predictors.
To comprehensively evaluate the predictive performance of the clinical-only, radiomics-only, and combined radiomics-clinical models, we used the area under the receiver operating characteristic curve (AUC), sensitivity, specificity, and overall accuracy as key metrics. Statistical differences between AUCs were assessed with DeLong’s test. Decision curve analysis (DCA) and calibration plots were further employed to quantify the net clinical benefit and predictive consistency of the combined model.
All statistical analyses were performed using SPSS 21.0 (IBM Corp)., Python 3.11.8, and R 3.6.1; a two-tailed P value < 0.05 was considered statistically significant.
Results
Patient Characteristics
Table 1. Baseline Characteristics of Patients in the Training and Test Cohorts summarises the baseline characteristics of the training and test cohorts. No statistically significant differences were observed in any clinical variable between the two groups, confirming balanced distribution.
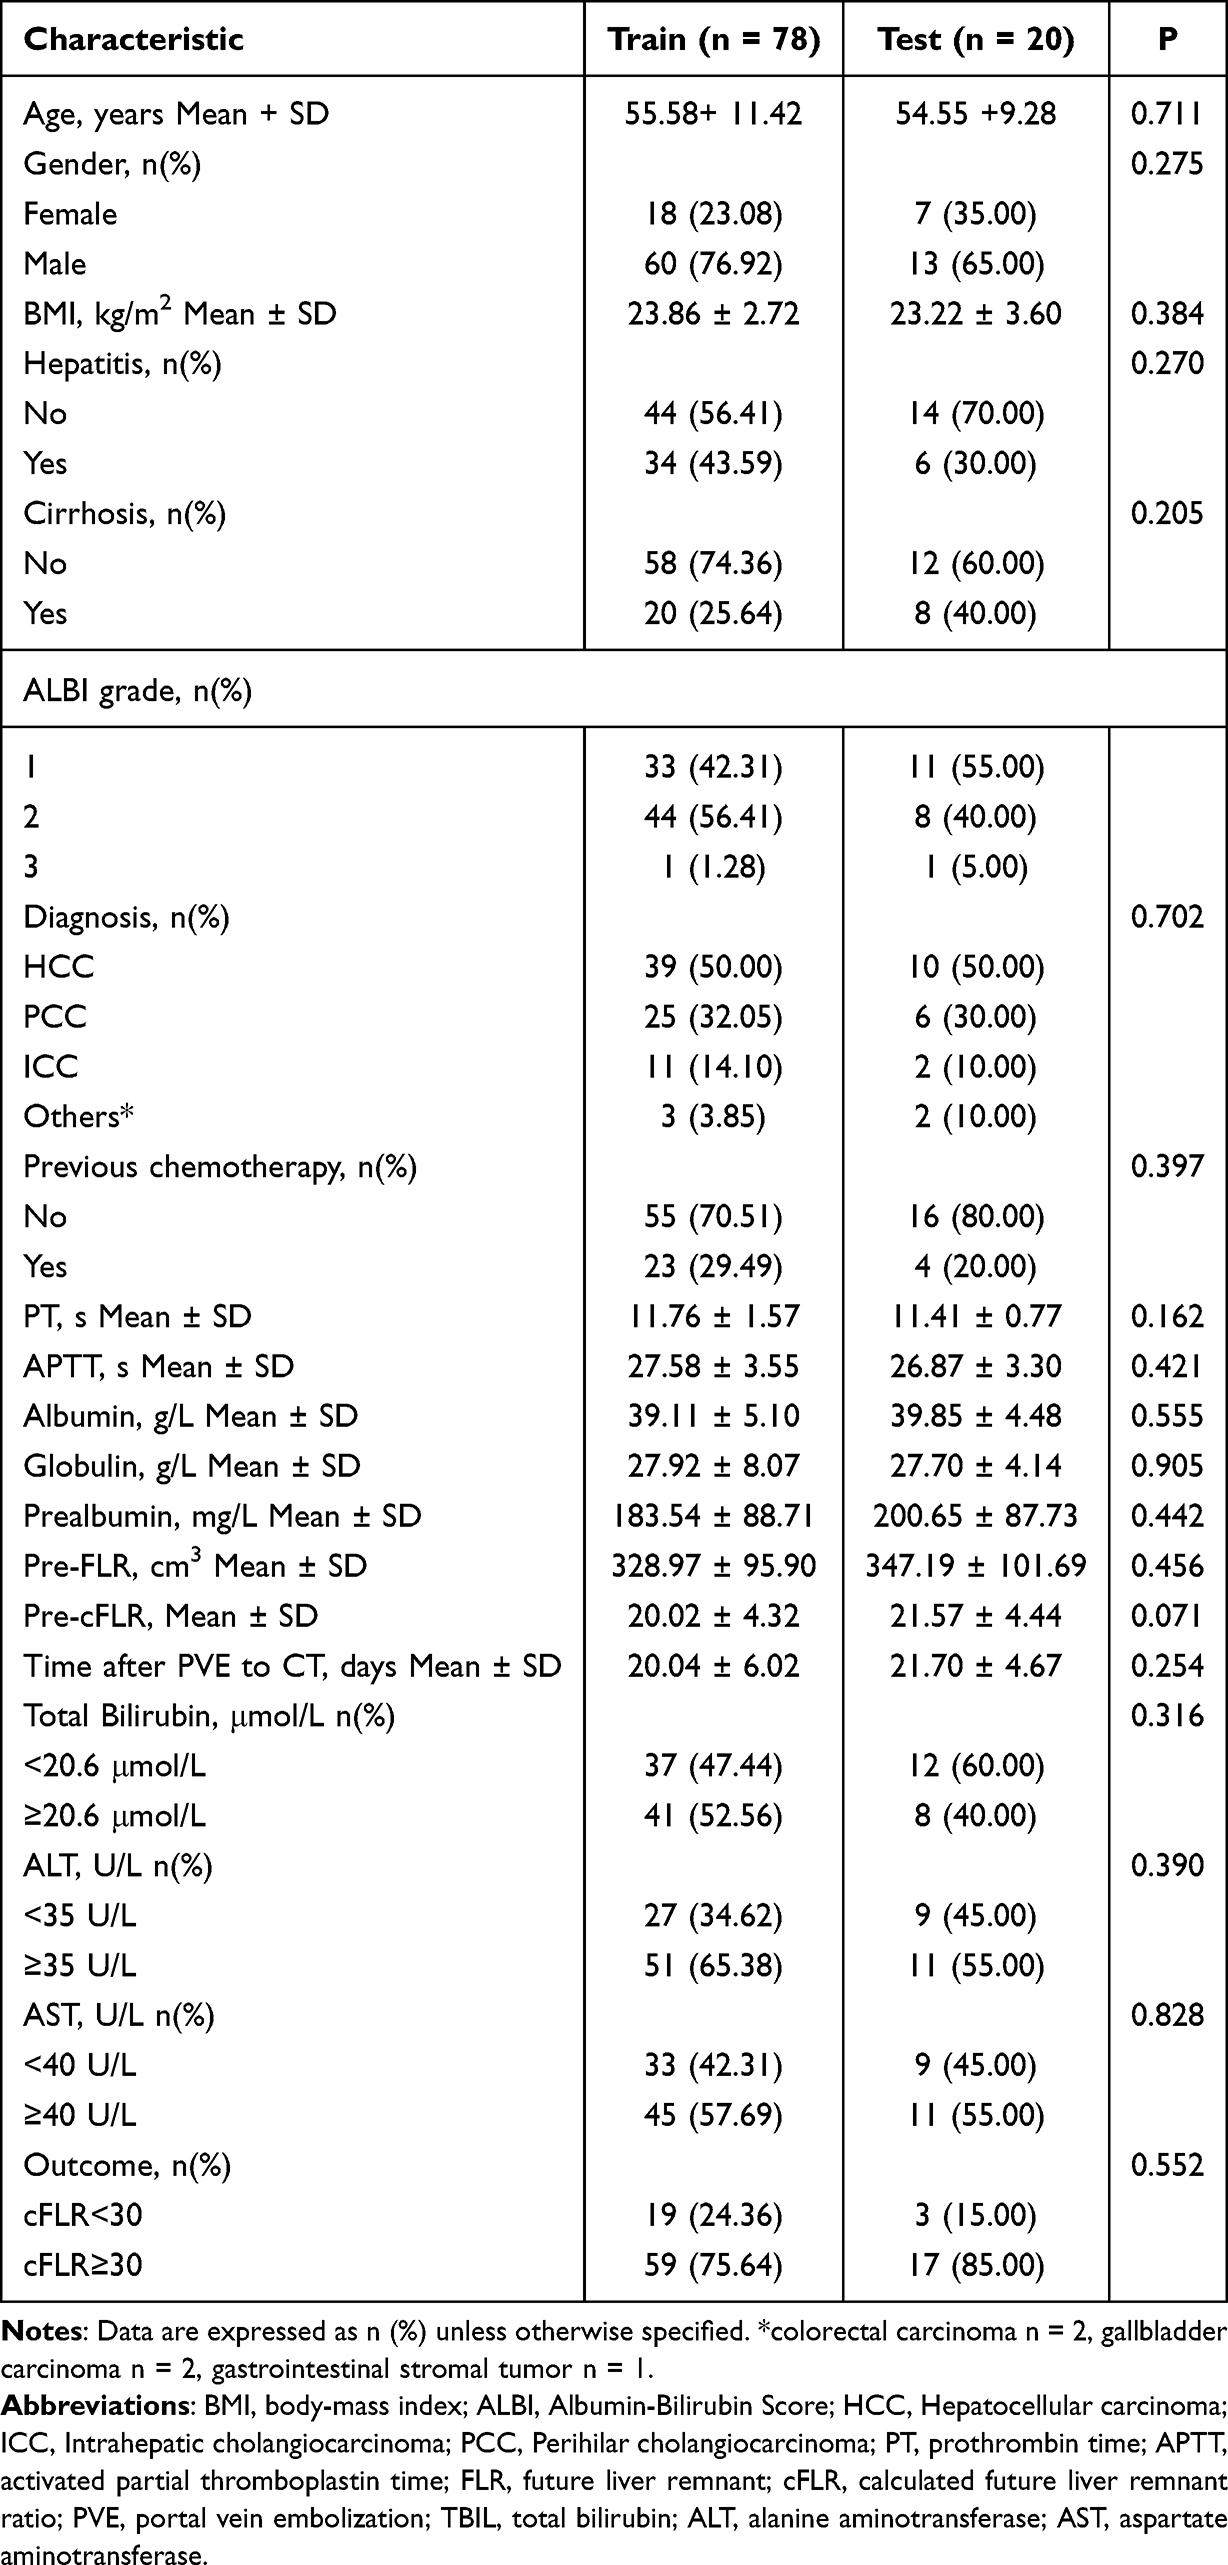 |
Table 1 Baseline Characteristics of Patients in the Training and Test Cohorts |
Table 2 presents the results of univariate and multivariate logistic regression analyses, elucidating the association between various clinical and biochemical parameters and cFLR≥30% in patients undergoing portal vein embolisation therapy. Univariate analysis revealed that hepatitis, cirrhosis, tumour type, prior chemotherapy history, preoperative albumin, preoperative FLR, and preoperative cFLR were all significantly associated with liver hyperplasia (all P<0.05). Multivariate regression analysis further validated the independent prognostic value of these variables. Multivariate analysis revealed hepatitis (Odds Ratio (OR) =0.06, 95% Confidence Interval (CI)=0.01–0.54, P=0.012) and preoperative cFLR (OR=1.2, 95% CI=1.01–1.42, P=0.046) as independent predictors of cFLR ≥30%.
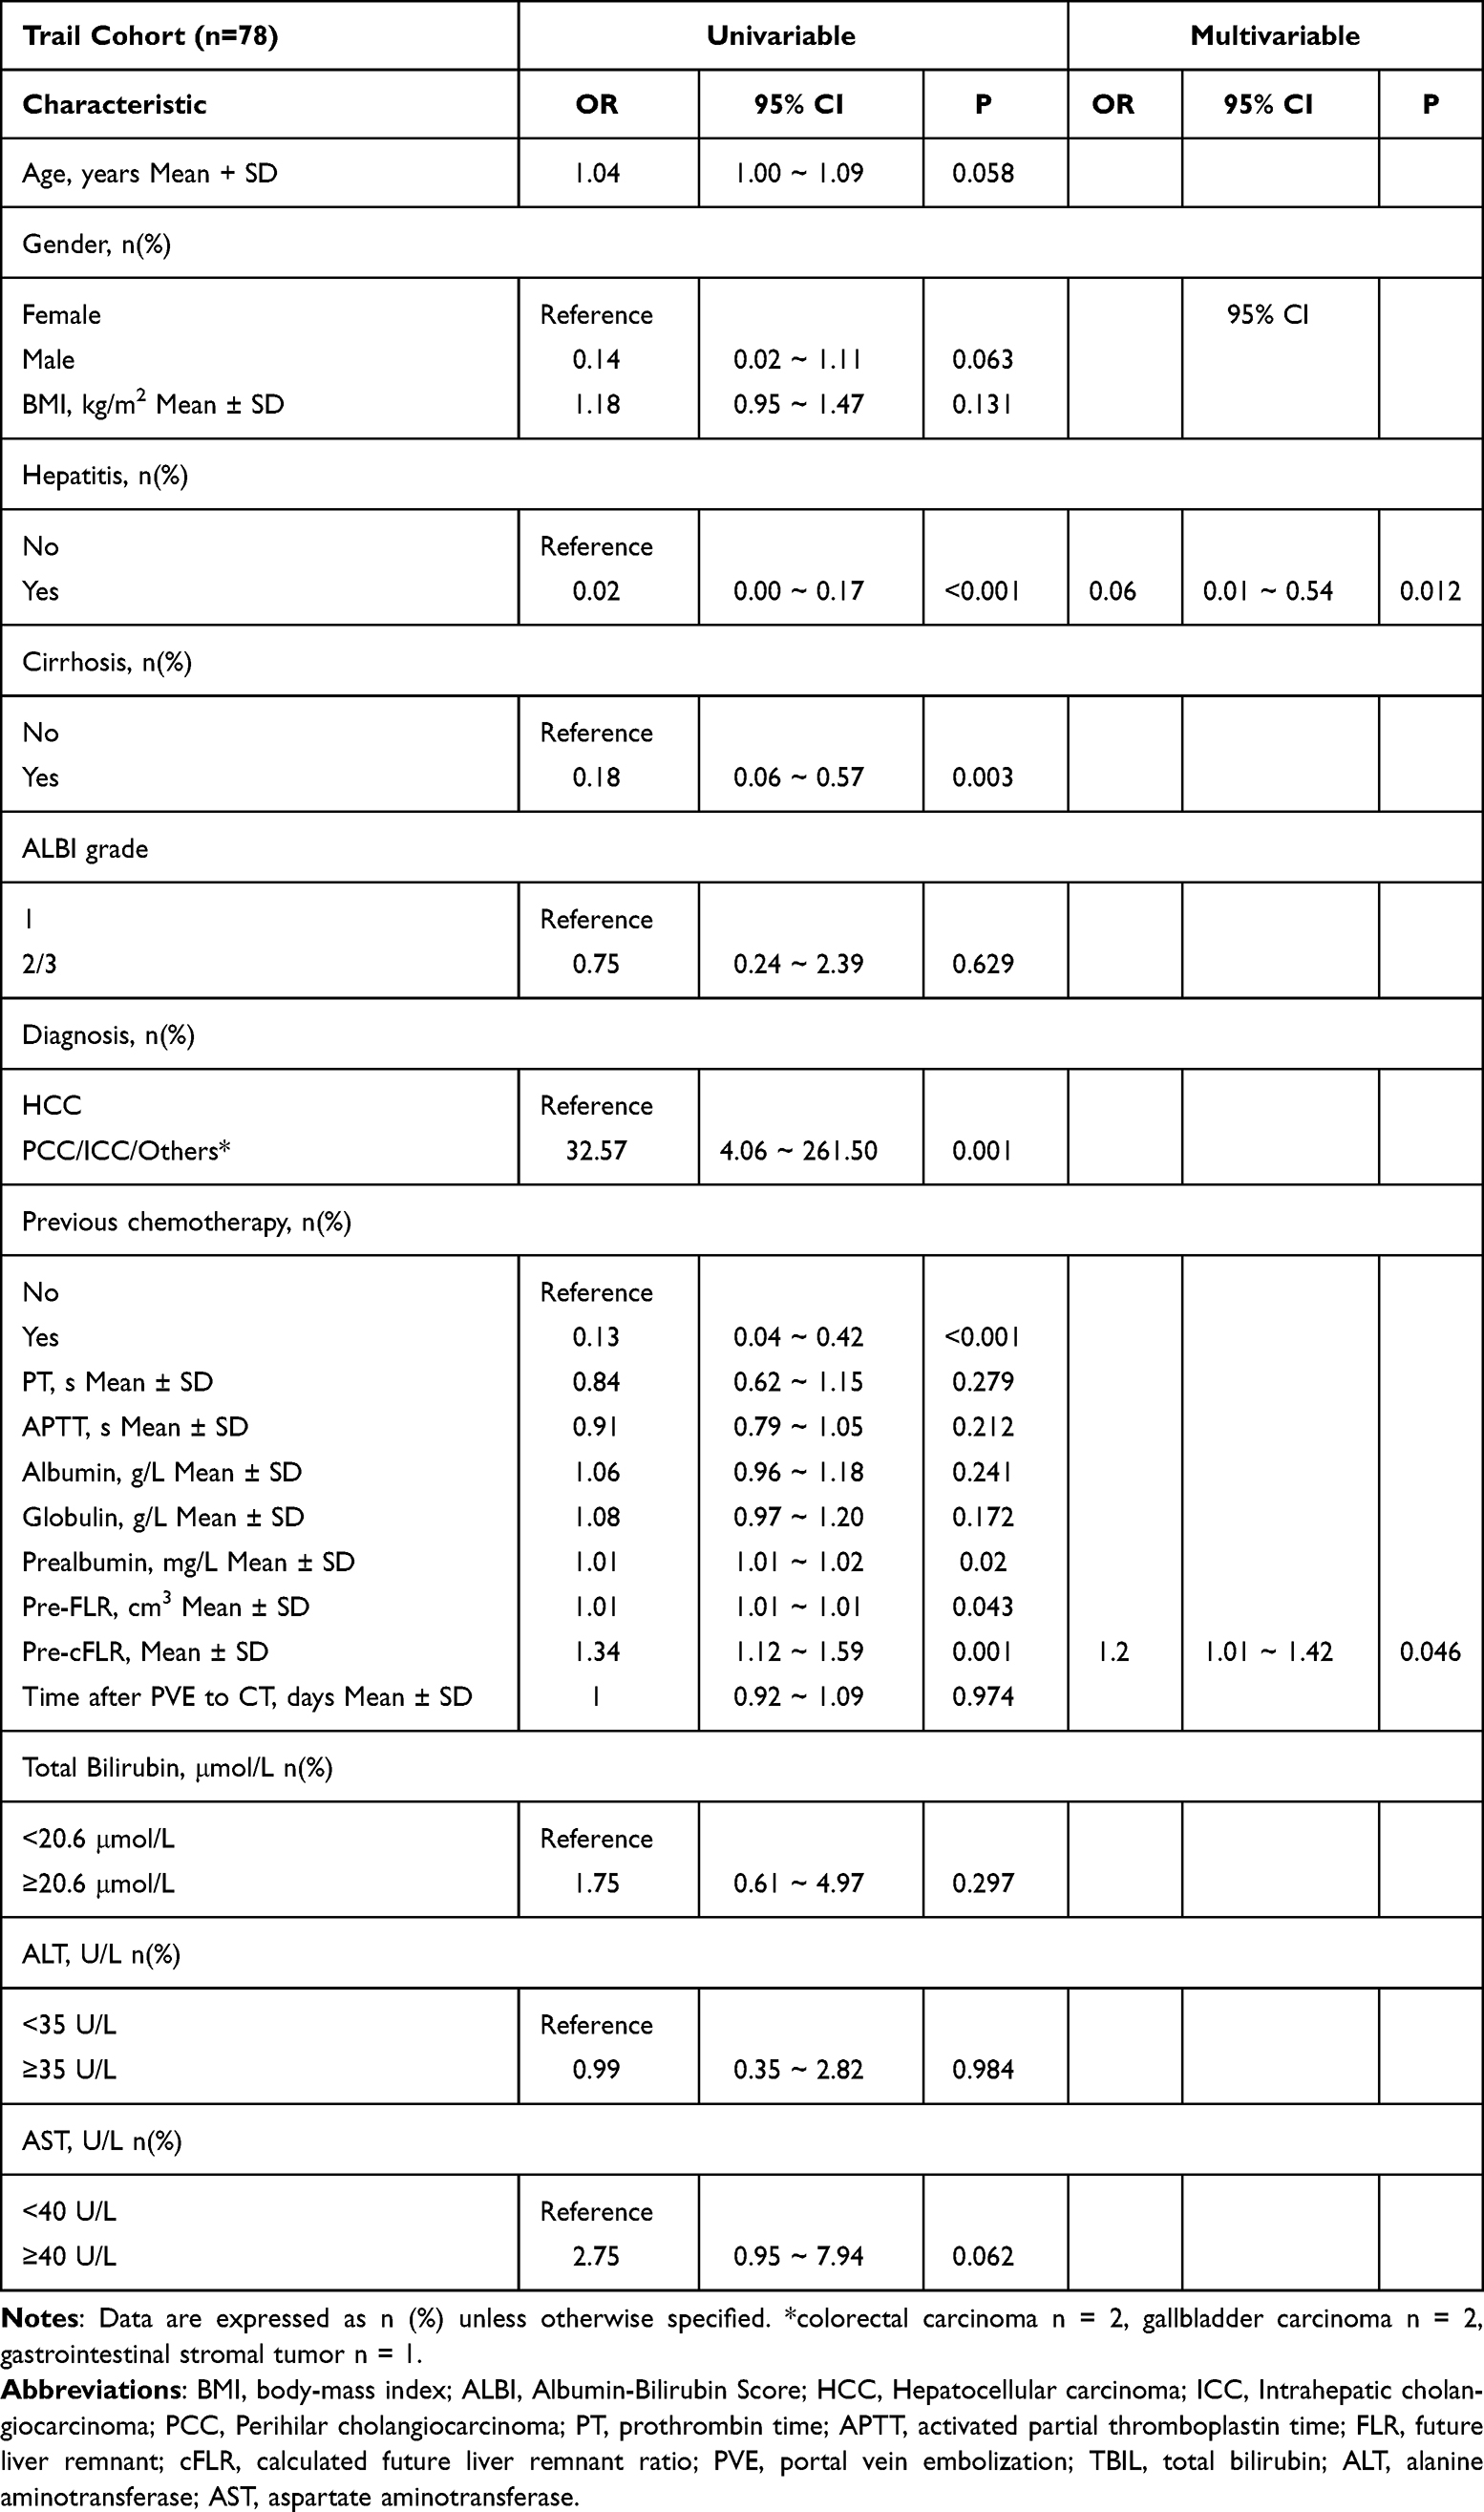 |
Table 2 Univariate and Multivariate Analysis of Variables Related to cFLR≥30% in Training Cohorts |
Establishment and Performance of the Radiomics Model
After LASSO selection, 5 features with non-zero coefficients were retained, whose details are shown in Figure 3 The Radiomics Score was then generated by feeding these selected features into MLP.
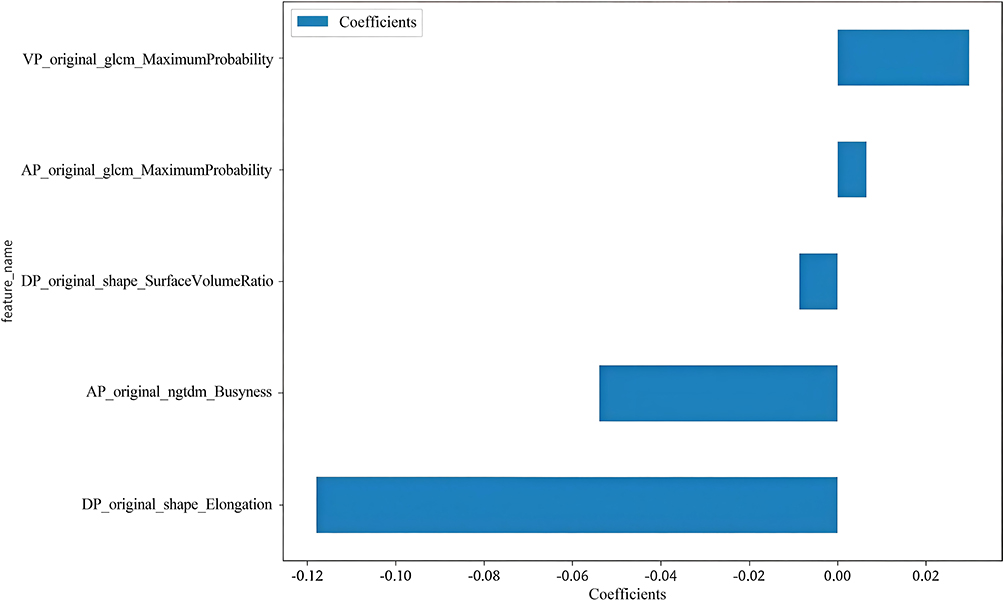 |
Figure 3 The histogram of the coefficients of the selected features. |
All selected features were used to construct the radiomics model. In the training cohort, the model achieved an AUC of 0.880 (95% CI 0.796–0.963), with sensitivity, specificity, and accuracy of 0.898, 0.737, and 0.859, respectively. In the test cohort, the AUC was 0.785 (95% CI 0.528–1.000), and sensitivity, specificity, and accuracy were 0.881, 0.632, and 0.821, respectively (Table 3 and Figure 4).
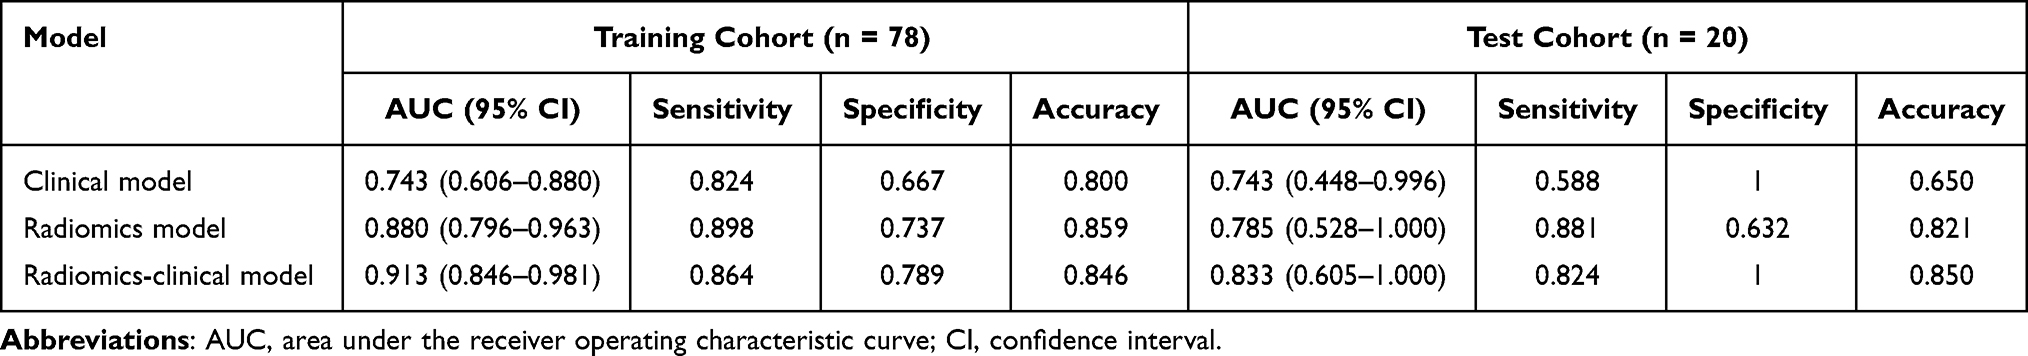 |
Table 3 Predictive Performance of Three Models in the Training Cohort and Test Cohort |
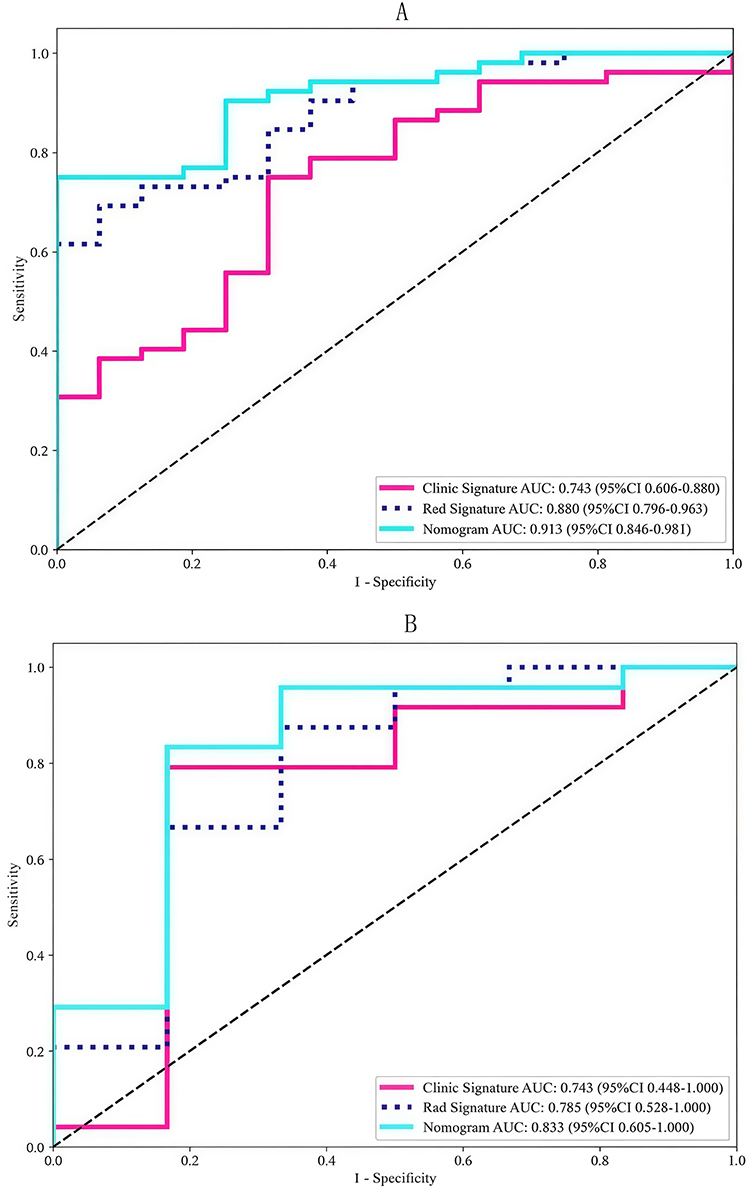 |
Figure 4 Receiver operating characteristic curves of the radiomics model, clinical model, and radiomics-clinical model in the training cohort (A) and test cohort (B). |
Establishment and Performance of the Clinical Model and Radiomics-Clinical Model
Variables for the clinical model were selected if their univariate P-values were < 0.05 in the training cohort. This model achieved an AUC of 0.743 (95% CI 0.606–0.880) in the training set, with sensitivity, specificity and accuracy of 0.824, 0.667 and 0.800, respectively; corresponding values in the test set were 0.743 (95% CI 0.448–0.996), 0.588, 1.000 and 0.650.
The Radiomics-Clinical fusion model reached an AUC of 0.913 (95% CI 0.846–0.981) in the training cohort, with sensitivity 0.864, specificity 0.789 and accuracy 0.846; in the test cohort the AUC was 0.833 (95% CI 0.605–1.000), yielding sensitivity 0.824, specificity 1.000 and accuracy 0.850. A nomogram was constructed from this fusion model (Figure 5). Decision-curve and calibration analyses demonstrated that the model provides a favourable net clinical benefit across a wide range of risk thresholds and exhibits excellent agreement between predicted probabilities and actual observations (Figure 6).
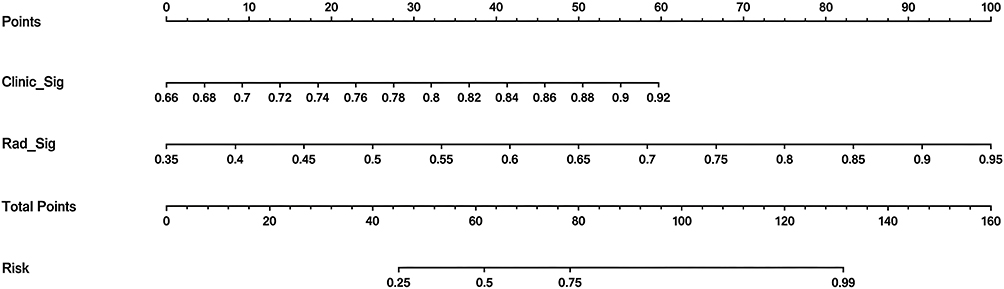 |
Figure 5 The radiomics-clinical Nomogram for Predicting Adequate Future Liver Remnant Hypertrophy After Portal Vein Embolization. |
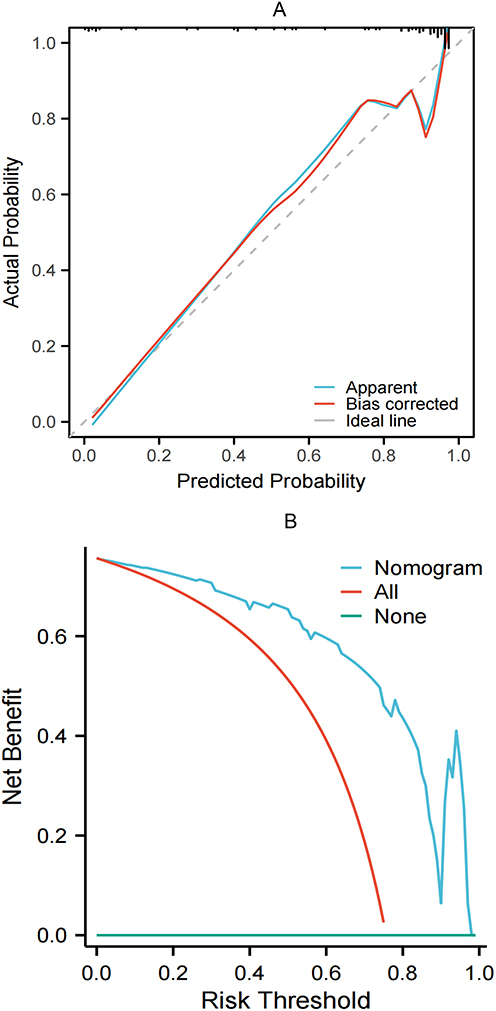 |
Figure 6 Calibration curve (A) and decision curve (B) analyses of the nomogram. |
DeLong’s test indicated that the Radiomics-Clinical model achieved a significantly higher AUC than the clinical-only model (P = 0.017), whereas the differences between the radiomics and clinical models (P = 0.183) and between the combined and radiomics models (P = 0.207) were not statistically significant.
Discussion
The central aim of this study was to resolve the clinical dilemma of pre-operatively identifying patients who will fail to achieve adequate future liver remnant (FLR) hypertrophy after portal vein embolization (PVE). By constructing and validating a combined model that integrates triphasic CT radiomic signatures with key clinical variables, we demonstrated—in a cohort of 98 Chinese patients—an AUC of 0.833 in the independent test set, significantly superior to the clinical-only model (DeLong test, P = 0.017). Calibration and decision-curve analyses support the model’s predictive accuracy and potential clinical utility. Consistent with prior reports, our findings establish baseline FLR, calculated FLR ratio (cFLR), serum pre-albumin levels, prior chemotherapy, coexisting hepatitis, and underlying cirrhosis as pivotal determinants of post-PVE hepatic regeneration.22–24 The Rad-score, derived from GLCM, GLRLM, NGTDM, and shape features, may reflect hepatic regenerative potential at a micro-architectural level, although this interpretation requires further validation.
Compared with existing literature, our study yields three noteworthy findings. First, whereas Gerwing et al21 relied solely on portal-venous phase CT, we demonstrate that arterial-phase texture features contribute most to the prediction of early regenerative capacity, implying that perfusion-related information may exert a pivotal influence via the “hepatic blood-flow–regeneration axis”.25 Second, Heise et al26 using an artificial neural network (ANN), reported an AUC of 0.75 with specificity as low as 44.4%; Our integrated model achieved an AUC of 0.833 and an accuracy of 0.85, confirming the synergistic benefit of integrating clinical variables—capturing macroscopic pathological context (fibrosis, chemotherapy toxicity)—with radiomic textures that quantify micro-scale parenchymal heterogeneity. Third, we intriguingly observed that “liver parenchyma GLCM entropy” inversely correlates with hypertrophy, aligning with Kim et al18 yet contrasting with Gerwing’s “MaximumProbability_liver” metric.21 We hypothesize that this discrepancy stems from our cohort’s higher proportion of HCC/ICC and prevalent HBV background, as chronic inflammation inherently elevates texture entropy;27 subgroup validation is warranted in future studies.
To our knowledge, this study proposes an innovative multi-phase fusion radiomics-clinical predictive model. By extracting key imaging features from the arterial, portal venous, and delayed phases, it enables preoperative prediction of inadequate residual liver tissue proliferation following portal vein embolisation. This approach is particularly applicable to patient cohorts predominantly affected by hepatitis B virus infection. Subsequent investigations may delve into the molecular pathways and biological processes associated with these imaging features, as their mechanisms may govern post-PVE hepatic regeneration, thereby deepening our understanding of liver tissue repair and its predictive mechanisms. Concurrently, the integrated model we have developed effectively distinguishes between PVE responders and non-responders, offering the prospect of truly personalised treatment planning. Decision curve analysis further confirms its significant clinical net benefit. Finally, by focusing on a Chinese population with high HBV prevalence, our investigation fills the ethnic gap left by previous Euro-American studies and provides much-needed evidence for Asian patients.
Our study has several limitations. First, the sample size was relatively small (n = 98) and the retrospective design predisposes to model overfitting and selection bias; larger training cohorts and multicentric external validation are therefore warranted. Second, techniques for PVE, liver volumetry, and formulas for calculating the future liver remnant (FLR) ratio remain heterogeneous. Clinicians usually set cFLR thresholds at 20–25% for healthy livers, 30% for post-chemotherapy livers, and 40% for cirrhotic livers, according to underlying hepatic status.24,28,29 We chose a uniform cFLR cut-off of 30%, which lies above the lower limit for normal liver and below the upper limit for cirrhotic liver, thereby covering the widest safety margin in our cohort and minimising the loss of potentially resectable patients.
Furthermore, given the limited number of outcome events in the training set (n=19), we employed a rigorous feature selection process—including univariate testing, correlation pruning, recursive elimination, and LASSO regularisation—to reduce model complexity. Secondly, we evaluated the model’s generalisation ability through five-fold cross-validation and an independent test set. Nevertheless, owing to the small test set sample size (n=20) and limited outcome events (only 3), the reliability of our reported sensitivity and specificity estimates is constrained. Consequently, performance metrics should be interpreted cautiously, and future studies should consider increasing sample sizes to enhance the precision of statistical analyses. Finally, owing to the limited sample size and our focus on preoperative prediction, we did not evaluate the kinetic growth rate (KGR) of the liver. This omission may restrict the comprehensive understanding of the dynamic process of liver hypertrophy. Future studies should further investigate key factors such as KGR to more thoroughly assess the dynamic changes in liver hypertrophy and explore the biological heterogeneity of liver growth.
Conclusions
We developed and internally validated a contrast-enhanced CT-based radiomics–clinical nomogram that identifies patients at risk of inadequate response before portal vein embolization. Integrating only five robust radiomic features with routinely available clinical variables, the model achieved an AUC of 0.833 in the test cohort and favorable decision-curve performance. Future large-scale, multicenter, prospective studies across diverse ethnic populations are warranted to confirm its generalizability and to further elucidate the biological links between arterial-phase texture signatures and liver regenerative capacity.
Data Sharing Statement
Data can be obtained upon reasonable request from the corresponding author, Ningyang Jia.
Ethics Approval and Consent to Participate
This study was conducted in accordance with the principles of the Declaration of Helsinki and was approved by the Ethics Committee of the Third Affiliated Hospital of Naval Medical University (approval number: EHBHKY2022-H-P002). As this study is a retrospective and the privacy and personal identity information of the patients were protected, the need for informed consent was waived by the Ethics Committee of the Third Affiliated Hospital of Naval Medical University.
Funding
This research was funded by the Smart Healthcare Program of the Shanghai Municipal Health Commission (2025ZHYL015) and the Natural Science Research Project of Jiading District, Shanghai (JDKW-2024-0014).
Disclosure
The authors declare no conflicts of interest.
References
1. Bray F, Laversanne M, Sung H, et al. Global cancer statistics 2022: GLOBOCAN estimates of incidence and mortality worldwide for 36 cancers in 185 countries. CA Cancer J Clin. 2024;74(3):229–13. doi:10.3322/caac.21834
2. Brindley PJ, Bachini M, Ilyas SI, et al. Cholangiocarcinoma. Nat Rev Dis Primers. 2021;7(1):65. doi:10.1038/s41572-021-00300-2
3. Lauterio A, De Carlis R, Centonze L, et al. Current surgical management of peri-hilar and intra-hepatic cholangiocarcinoma. Cancers. 2021;13(15):3657. doi:10.3390/cancers13153657
4. Olthof PB, van Gulik TM. ASO author reflections: essential to reduce adverse outcomes in perihilar cholangiocarcinoma surgery-portal vein embolization. Ann Surg Oncol. 2020;27(7):2319–2320. doi:10.1245/s10434-020-08333-9
5. Cieslak KP, Runge JH, Heger M, Stoker J, Bennink RJ, van Gulik TM. New perspectives in the assessment of future remnant liver. Dig Surg. 2014;31(4–5):255–268. doi:10.1159/000364836
6. Kong FH, Miao XY, Zou H, et al. End-stage liver disease score and future liver remnant volume predict post-hepatectomy liver failure in hepatocellular carcinoma. World J Clin Cases. 2019;7(22):3734–3741. doi:10.12998/wjcc.v7.i22.3734
7. Abulkhir A, Limongelli P, Healey AJ, et al. Preoperative portal vein embolization for major liver resection: a meta-analysis. Ann Surg. 2008;247(1):49–57. doi:10.1097/SLA.0b013e31815f6e5b
8. Franken LC, Schreuder AM, Roos E, et al. Morbidity and mortality after major liver resection in patients with perihilar cholangiocarcinoma: a systematic review and meta-analysis. Surgery. 2019;165(5):918–928. doi:10.1016/j.surg.2019.01.010
9. Olthof PB, Aldrighetti L, Alikhanov R, et al. Portal vein embolization is associated with reduced liver failure and mortality in high-risk resections for perihilar cholangiocarcinoma. Ann Surg Oncol. 2020;27(7):2311–2318. doi:10.1245/s10434-020-08258-3
10. Olthof PB, Wiggers JK, Koerkamp BG, et al. Postoperative liver failure risk score: identifying patients with resectable perihilar cholangiocarcinoma who can benefit from portal vein embolization. J Am Coll Surg. 2017;225(3):387–394. doi:10.1016/j.jamcollsurg.2017.06.007
11. Abdelrafee A, Nunez J, Cano L, et al. Predictors of unresectability after portal vein embolization for centrally located cholangiocarcinoma. Surgery. 2020;168(2):287–296. doi:10.1016/j.surg.2020.03.005
12. Higuchi R, Yamamoto M. Indications for portal vein embolization in perihilar cholangiocarcinoma. J Hepatobiliary Pancreat Sci. 2014;21(8):542–549. doi:10.1002/jhbp.77
13. Abdalla EK, Adam R, Bilchik AJ, Jaeck D, Vauthey JN, Mahvi D. Improving resectability of hepatic colorectal metastases: expert consensus statement. Ann Surg Oncol. 2006;13(10):1271–1280. doi:10.1245/s10434-006-9045-5
14. Lafaro K, Buettner S, Maqsood H, et al. Defining post hepatectomy liver insufficiency: where do we stand? J Gastrointest Surg. 2015;19(11):2079–2092. doi:10.1007/s11605-015-2872-6
15. Loffroy R, Favelier S, Chevallier O, et al. Preoperative portal vein embolization in liver cancer: indications, techniques and outcomes. Quant Imaging Med Surg. 2015;5(5):730–739. doi:10.3978/j.issn.2223-4292.2015.10.04
16. Ribero D, Abdalla EK, Madoff DC, Donadon M, Loyer EM, Vauthey JN. Portal vein embolization before major hepatectomy and its effects on regeneration, resectability and outcome. Br J Surg. 2007;94(11):1386–1394. doi:10.1002/bjs.5836
17. Lambin P, Leijenaar RTH, Deist TM, et al. Radiomics: the bridge between medical imaging and personalized medicine. Nat Rev Clin Oncol. 2017;14(12):749–762. doi:10.1038/nrclinonc.2017.141
18. Kim JE, Kim JH, Park SJ, Choi SY, Yi NJ, Han JK. Prediction of liver remnant regeneration after living donor liver transplantation using preoperative CT texture analysis. Abdom Radiol. 2019;44(5):1785–1794. doi:10.1007/s00261-018-01892-2
19. Dhaliwal SK, Annamalai G, Gafoor N, Pugash R, Dey C, David EN. Portal vein embolization: correlation of future liver remnant hypertrophy to type of embolic agent used. Can Assoc Radiol J. 2018;69(3):316–321. doi:10.1016/j.carj.2018.02.003
20. Bednarsch J, Czigany Z, Sharmeen S, et al. ALPPS versus two-stage hepatectomy for colorectal liver metastases--a comparative retrospective cohort study. World J Surg Oncol. 2020;18(1):140. doi:10.1186/s12957-020-01919-3
21. Gerwing M, Schindler P, Katou S, et al. Multi-organ radiomics-based prediction of future remnant liver hypertrophy following portal vein embolization. Ann Surg Oncol. 2023;30(13):7976–7985. doi:10.1245/s10434-023-14241-5
22. Liu H, Gai X, Wang X, Liu L, Tian L, Zhou B. Analysis of the factors influencing liver regeneration after hepatectomy in hepatocellular carcinoma patients and the relationship between liver regeneration and prognosis. Sci Rep. 2025;15(1):26874. doi:10.1038/s41598-025-11520-x
23. Pawlik TM, Olino K, Gleisner AL, Torbenson M, Schulick R, Choti MA. Preoperative chemotherapy for colorectal liver metastases: impact on hepatic histology and postoperative outcome. J Gastrointest Surg. 2007;11(7):860–868. doi:10.1007/s11605-007-0149-4
24. Soykan EA, Aarts BM, Lopez-Yurda M, et al. Predictive factors for hypertrophy of the future liver remnant after portal vein embolization: a systematic review. Cardiovasc Intervent Radiol. 2021;44(9):1355–1366. doi:10.1007/s00270-021-02877-3
25. Lorenz L, Axnick J, Buschmann T, et al. Mechanosensing by β1 integrin induces angiocrine signals for liver growth and survival. Nature. 2018;562(7725):128–132. doi:10.1038/s41586-018-0522-3
26. Heise D, Schulze-Hagen M, Bednarsch J, et al. CT-based prediction of liver function and post-PVE hypertrophy using an artificial neural network. J Clin Med. 2021;10(14):3079. doi:10.3390/jcm10143079
27. De Kock I, Bos S, Delrue L, et al. MRI texture analysis of T2-weighted images is preferred over magnetization transfer imaging for readily longitudinal quantification of gut fibrosis. Eur Radiol. 2023;33(9):5943–5952. doi:10.1007/s00330-023-09624-x
28. Memeo R, Conticchio M, Deshayes E, et al. Optimization of the future remnant liver: review of the current strategies in Europe. Hepatobiliary Surg Nutr. 2021;10(3):350–363. doi:10.21037/hbsn-20-394
29. Vauthey JN, Mizuno T. Portal vein embolization: tailoring, optimizing, and quantifying an invaluable procedure in hepatic surgery. Ann Surg Oncol. 2017;24(6):1456–1458. doi:10.1245/s10434-017-5801-y
 © 2026 The Author(s). This work is published and licensed by Dove Medical Press Limited. The
full terms of this license are available at https://www.dovepress.com/terms
and incorporate the Creative Commons Attribution
- Non Commercial (unported, 4.0) License.
By accessing the work you hereby accept the Terms. Non-commercial uses of the work are permitted
without any further permission from Dove Medical Press Limited, provided the work is properly
attributed. For permission for commercial use of this work, please see paragraphs 4.2 and 5 of our Terms.
© 2026 The Author(s). This work is published and licensed by Dove Medical Press Limited. The
full terms of this license are available at https://www.dovepress.com/terms
and incorporate the Creative Commons Attribution
- Non Commercial (unported, 4.0) License.
By accessing the work you hereby accept the Terms. Non-commercial uses of the work are permitted
without any further permission from Dove Medical Press Limited, provided the work is properly
attributed. For permission for commercial use of this work, please see paragraphs 4.2 and 5 of our Terms.