Back to Journals » ClinicoEconomics and Outcomes Research » Volume 12
A Model to Predict Risk of Hyperkalemia in Patients with Chronic Kidney Disease Using a Large Administrative Claims Database
Authors Sharma A, Alvarez PJ, Woods SD ![]() , Dai D
, Dai D ![]()
Received 7 July 2020
Accepted for publication 22 October 2020
Published 9 November 2020 Volume 2020:12 Pages 657—667
DOI https://doi.org/10.2147/CEOR.S267063
Checked for plagiarism Yes
Review by Single anonymous peer review
Peer reviewer comments 2
Editor who approved publication: Professor Giorgio Colombo
Ajay Sharma,1 Paula J Alvarez,2 Steven D Woods,2 Dingwei Dai1
1Healthagen, An Affiliate of Aetna Inc., A Part of the CVS Health Family of Companies, New York, NY, USA; 2Managed Care Health Outcomes, Relypsa, Inc., a Vifor Pharma Group Company, Redwood City, CA, USA
Correspondence: Dingwei Dai
Healthagen, An Affiliate of Aetna Inc., A Part of the CVS Health Family of Companies, 100 Park Ave, New York, NY 10017, USA
Tel +1 212-457-0603
Email [email protected]
Background: Chronic kidney disease (CKD) is responsible for substantial clinical and economic burden. Drugs that inhibit the renin-angiotensin-aldosterone system inhibitors (RAASi) slow CKD progression in many common clinical scenarios. Guideline-directed medical therapy requires maximal recommended doses of RAASi, which clinicians are often reluctant to prescribe because of the associated risk of hyperkalemia (HK).
Objective: This study aims to develop and validate a model to identify individuals with CKD at elevated risk for developing HK over a 12-month period on the basis of lab, medical, and pharmacy claims.
Methods: Using claims from a large US healthcare payer, we developed a model to predict the probability of individuals identified with CKD but not HK in 2016 (baseline year [BY]) who developed HK in 2017 (prediction year [PY]). The study population was comprised of members continuously enrolled with medical and pharmacy benefits and CKD (BY). Members were excluded from the analysis if they had HK (by lab results or diagnosis code) or dialysis (BY). Prediction model performance measures included area under the receiver operating characteristic curve (AUROC), calibration, and gain and lift charts.
Results: Of 435,512 members identified with CKD but not HK (BY), 6235 (1.43%) showed incident HK (PY). Compared with individuals without incident HK (PY), these members had a higher comorbidity burden, use of RAASi, and healthcare utilization. The AUROC and calibration analyses showed good predictive accuracy (area under the curve [AUC]=0.843 and calibration). The top 2 HK-prediction deciles identified 75.94% of members who went on to develop HK (PY).
Conclusion: Guideline-recommended doses of RAASi therapy can be limited by the risk of HK. Novel potassium binders may permit more patients at risk to benefit from these maximal RAASi doses. This predictive model successfully identified the risk of developing HK up to 1 year in advance.
Keywords: chronic kidney disease, hyperkalemia, RAAS inhibitors, potassium binder
Introduction
Chronic kidney disease (CKD) is responsible for substantial clinical, economic, and humanistic burden. The United States (US) adult prevalence of CKD in 2013–2016 was 14.8% for all stages and 6.9% for moderate-to-severe (stages 3–5) CKD.1
As kidney function declines, the association of CKD with comorbidities, including hypertension, diabetes, and cardiovascular disease,2 drives rising healthcare expenditures.3,4 For example, a 2016 analysis using clinical data of patients prescribed renin-angiotensin-aldosterone system (RAAS) inhibitors (RAASi) found that annual costs (2016 dollars, excluding dialysis) rose exponentially from $7537 in patients without CKD to $76,969 in patients with stage 4–5 CKD and to over $121,000 in patients with end-stage renal disease (ESRD).5
Earlier diagnosis and evidence-based management of CKD are key to slowing progression and preventing the complications of advanced CKD. The RAAS blockade plays a major role in delaying or, in some patients perhaps halting, kidney failure in most types of CKD.6–10 In the RENAAL study, the investigators estimated that the RAAS blockade, with the optimal dose of losartan, delayed the development of ESRD by 2 years in patients with type 2 diabetes with nephropathy.6
RAASi drugs currently marketed in the US are classified by their mode of action: angiotensin-converting enzyme inhibitors (ACEi), angiotensin-receptor blockers (ARB), mineralocorticoid receptor antagonists (MRA; eg, aldosterone), and direct renin inhibitors (DRI). Importantly, those at greatest risk of CKD progression (advanced CKD and diabetes and/or heart failure [HF] with reduced ejection fraction) stand to benefit most.11,12
Achieving the full clinical benefits of RAASi medications requires the use of maximum or optimal doses used in clinical trials, but these drugs are frequently not prescribed or are underprescribed because of the inherent risk of hyperkalemia (HK). A large clinical study found that only 26.8% of patients with CKD, HF, or both received optimal doses; other studies have confirmed RAASi underprescribing for patients with guideline-recommended cardiorenal indications.13–16
Other factors associated with HK include reduced kidney function, age, male gender, diabetes, HF, adrenal insufficiency, and certain medications, such as nonsteroidal anti-inflammatory drugs and RAASi.17 The likelihood of developing HK increases as kidney function declines. A large clinical data analysis found the 5-year HK prevalence to be 23.5% in patients with HF, 29.5% in patients with CKD stages 3–4, and 47.6% in patients with both.18
The presence of HK further adds to the cost of CKD. A claims study of patients with CKD and/or HF found that after multivariable adjustment, those with HK cost $25,156 more annually than matched patients without HK.19 In addition, a 2016 clinical data study found that in CKD stage 4–5, HK expenditures were 38% and 22% higher for commercial and Medicare patients, respectively.5
The clinical and potential economic value of optimal-dose RAASi in slowing CKD progression highlights the importance of predicting the risk of developing HK, especially because interventions to prevent HK would enable most patients to remain optimally treated.17,20 With administrative claims and electronic medical records, predictive analytics can be applied to combine the contribution of multiple risk factors into a single probabilistic estimate to guide healthcare.21 The objective of this study was to develop and validate a predictive model to identify patients with CKD likely to develop HK within a large national health plan, based on a broad set of demographic, clinical, and healthcare-resource utilization (HCRU) characteristics found in administrative claims data.
Data and Methods
Data
The model was developed to predict the occurrence of HK in the prediction year (PY, 2017) of individuals identified with CKD in the baseline year (BY, 2016). Individuals were excluded if they had HK or underwent dialysis in the BY or were enrolled in an end-of-life care program or hospice in either the BY or PY.
Data included medical and pharmacy claims and lab-test results of deidentified individuals continuously enrolled from January 2016 through December 2017 in a fully insured commercial or Medicare Advantage plan operated by a large national health plan. Membership in the study population required continuous medical and pharmacy coverage throughout both BY and PY; diagnosis in BY of CKD (at least 1 claim with a principal or secondary diagnosis of CKD or from estimated glomerular filtration rate [eGFR]—see Table S1); and being at least 18 years old on January 1, 2016.
Disease comorbidities were identified based on medical and pharmacy claims and lab results. The burden of chronic diseases was estimated from the original conditions and weights of the Charlson-Deyo Comorbidity Index using the International Statistical Classification of Disease and Related Health Problems, 10th revision (ICD-10) codes.22,23
HK was identified if an individual met at least 1 of the following criteria: (1) ≥2 serum potassium >5.0 mmol/L on different dates (Logical Observation Identifiers Names and Codes [LOINC]: 2823–3); (2) ≥2 claims with principal or secondary diagnosis of HK (International Classification of Diseases, 10th Revision, Clinical Modification [ICD-10-CM]: E87.5); (3) 1 claim with HK and 1 potassium >5.0 mmol/L; (4) ≥1 dispensed prescription for sodium polystyrene sulfonate or patiromer (the potassium binders approved by the FDA prior to 2017).
RAASi medications (see Table S2) included ACEi, ARB, MRA, and DRI. Patients were categorized as receiving optimal dosing if they were dispensed the maximum package-labeled dose in the BY, whereas patients who were dispensed any dose below that were categorized as receiving suboptimal dosing.24 RAASi adherence was estimated by proportion of days covered (PDC) as defined by the Centers for Medicare & Medicaid Services (CMS) performance measure D12, renin-angiotensin system (RAS) antagonists.25
Descriptive Statistical Analysis
All baseline characteristics were analyzed descriptively. Means (±SD) and medians (IQR) were reported for continuous variables, and frequencies (%) were reported for categorical variables. Statistical significance was assessed with the Student’s t-test or Wilcoxon rank-sum test or Kruskal–Wallis test for continuous variables and X2 test for categorical variables.
Development and Validation of the Prediction Model
Data on study group members were randomly divided into 2 equal sets for model development and validation. The development phase focused on selection of PY HK predictor variables from a variety of candidates, including demographics, CKD stage, comorbidities, drugs, lab results, and HCRU.
The first step in the development phase excluded variables lacking significant (P≤0.05) univariate association with HK. This step yielded 46 candidate predictor variables, which, in the next step, were subjected to stepwise logistic regression to identify those that were independently correlated with HK. The probability for entry of a variable was set at 0.01 and for removal at 0.1. Adjusted odds ratios (ORs) were calculated, along with their associated 95% confidence intervals (CIs). Interactions between predictive variables in the model were checked using a pooled interaction test.26 Multicollinearity was checked using Pearson’s correlation coefficient. The model’s goodness-of-fit was tested using deviance, Hosmer-Lemeshow, and log-likelihood.27
The model’s performance was validated on the validation dataset. The area under a receiver operating characteristic curve (AUROC) was calculated to determine the model’s ability to discriminate between those who developed HK and those who did not during the PY follow-up period. AUROC was computed by a nonparametric method.28 An AUROC of 1 implies perfect discrimination, whereas an AUROC of 0.5 implies the model performs no better than chance.29
Calibration was assessed by plotting observed versus predicted probability of HK in the PY among patients grouped by deciles of predicted probability as estimated by the model (decile 1: lowest risk; decile 10: highest risk). Risk accuracy was estimated as the mean absolute difference (error) between the predicted and observed (actual) probability of HK across the 10 risk strata. Risk stratification performance was assessed by (1) the mean actual risk (observed probability) increases between strata, and (2) the risk ratio between the observed probability in the highest-risk strata to that in the lowest-risk strata.
A gains chart was used to compare predictive accuracy with the prediction model versus without the prediction model. The data were sorted in descending order of the probability of HK estimated by the model, binned by deciles, and the cumulative rate of HK at each decile was evaluated, from the highest-risk decile to the lowest-risk decile. The greater the area between the gain curve and the baseline (random selection without a prediction model), the better the model’s performance. The model’s goodness-of-fit was further tested using deviance, Hosmer-Lemeshow, and log-likelihood.
All data management, statistical analyses, and predictive modelling were performed using SAS software, version 9.4 (SAS Institute, Cary, NC, US). The study was approved by an independent institutional review board, Sterling IRB, before proceeding.
Results
Baseline Characteristics
Of the 435,512 individuals who met the study criteria, 57% were female, 42% lived in the South region, and 54% were enrolled in a Medicare Advantage plan (Figure 1, Table 1). Table 1 compares BY characteristics of study group members who went on to exhibit (6235; 1.44%) or not exhibit (429,277; 98.57%) evidence of HK in the PY. Members who were first identified with HK in the PY tended to be older, male, of Southern residence, urban, Medicare-insured, with a higher Charlson-Deyo Comorbidity Index (CCI). They were more likely to have comorbid hypertension, hyperlipidemia, diabetes or congestive HF, and more advanced CKD (Table 2).
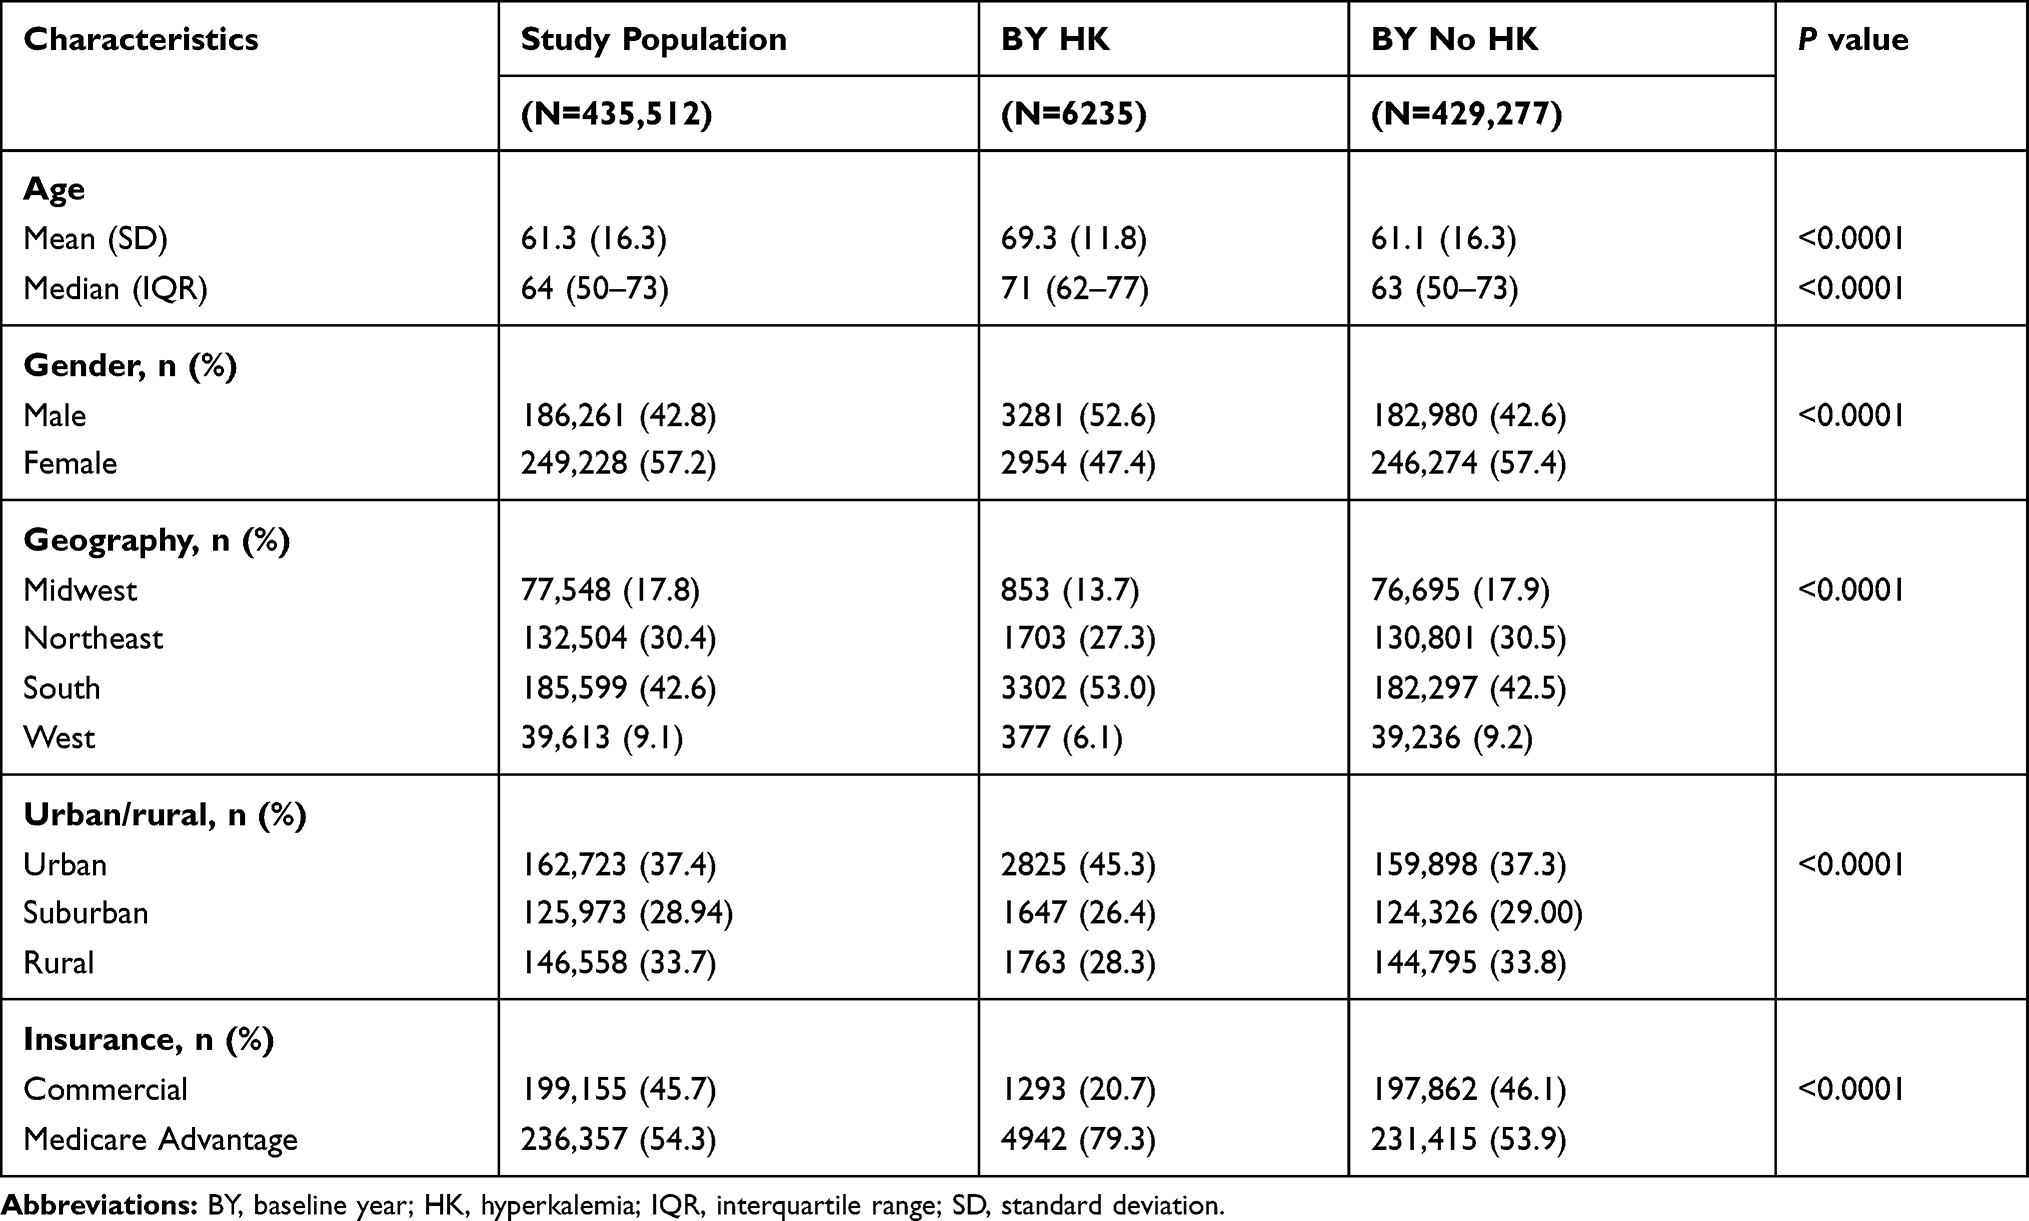 |
Table 1 Baseline Patient Demographics |
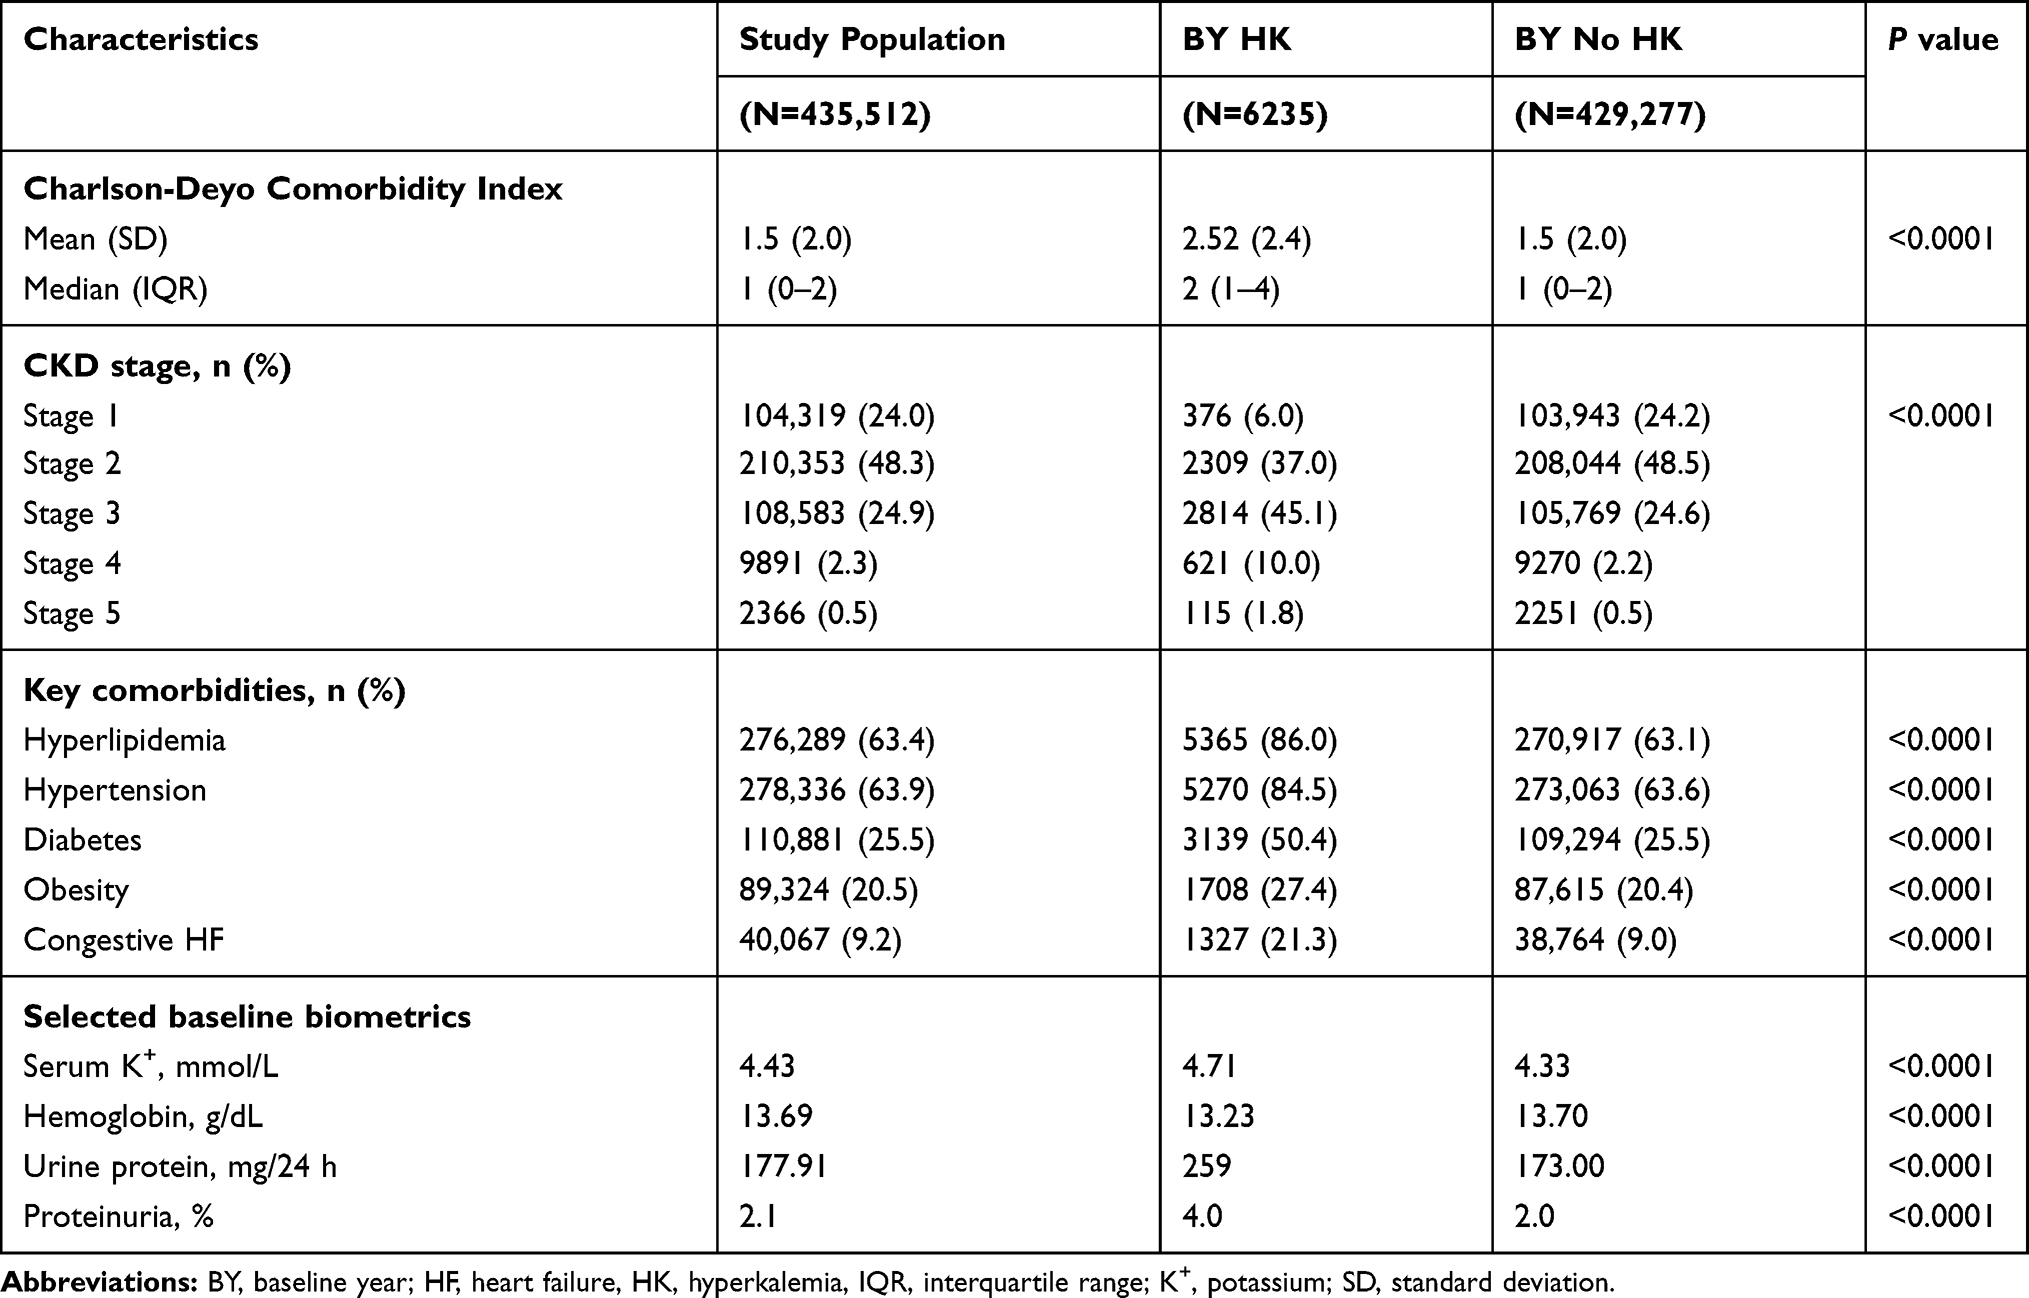 |
Table 2 Clinical Characteristics and Comorbidities |
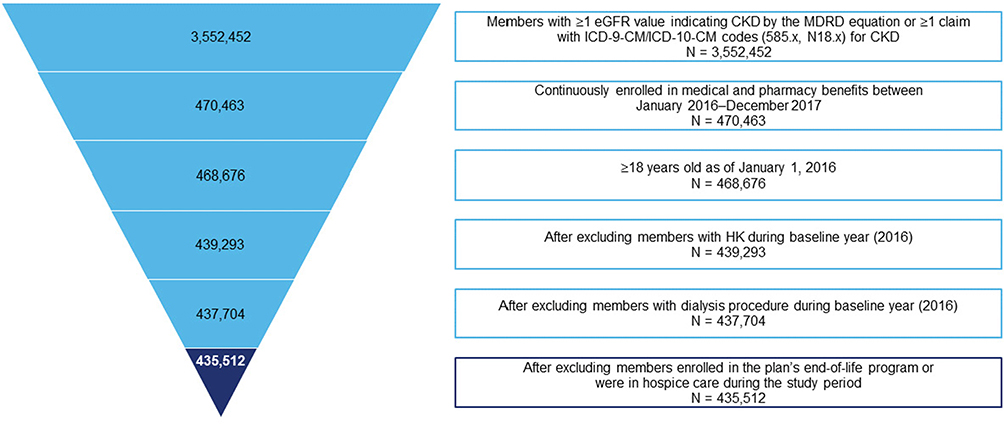 |
Figure 1 Study population flowchart. |
In addition, members of the HK subgroup were 52% likelier to use RAASi in the BY (70% versus 46.1% for the non-HK group; Table 3; Table S3). Submaximal RAASi dosing was widespread, but overall, adherence as measured by PDC ≥80% was similar in the HK and non-HK groups. Serum potassium and urine protein excretion were greater in the HK group (Table 2).
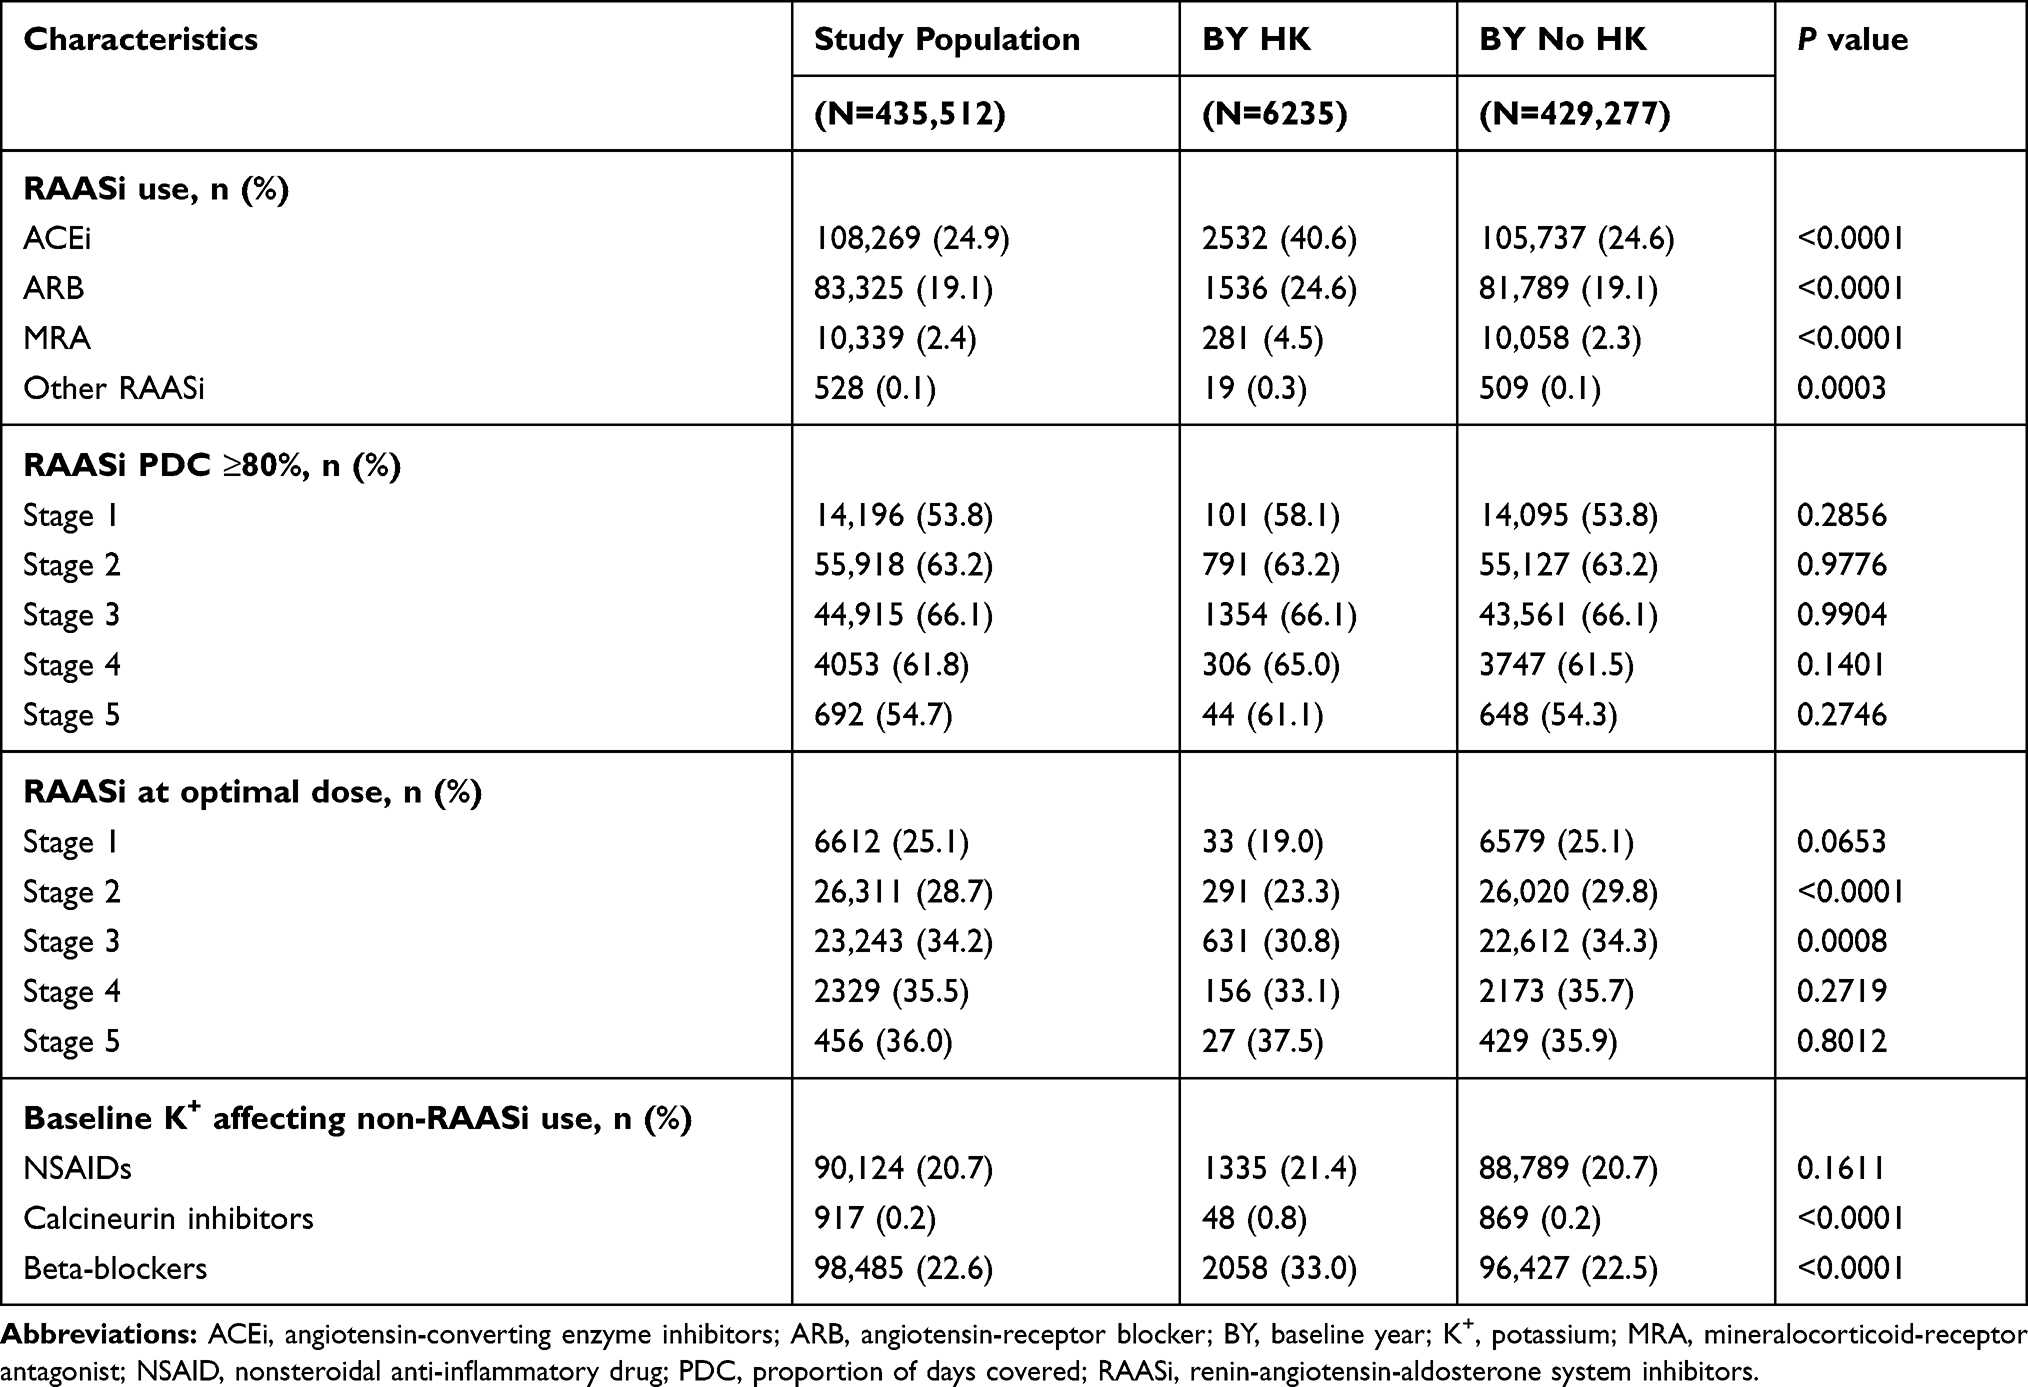 |
Table 3 Baseline Medications |
Variables in the Logistic Regression Model
Forty-six variables with significant univariate association to HK first appearing in the PY (see Table S4) were reduced to 21 by stepwise logistic regression. Table 4 shows that CKD stage, higher BY potassium, use of ACEi, MRA, and calcineurin inhibitors; and certain comorbidities, including diabetes, independently predicted HK. Suboptimal RAASi dose and adherence were equally predictive of HK, but dose and adherence together were not more predictive.
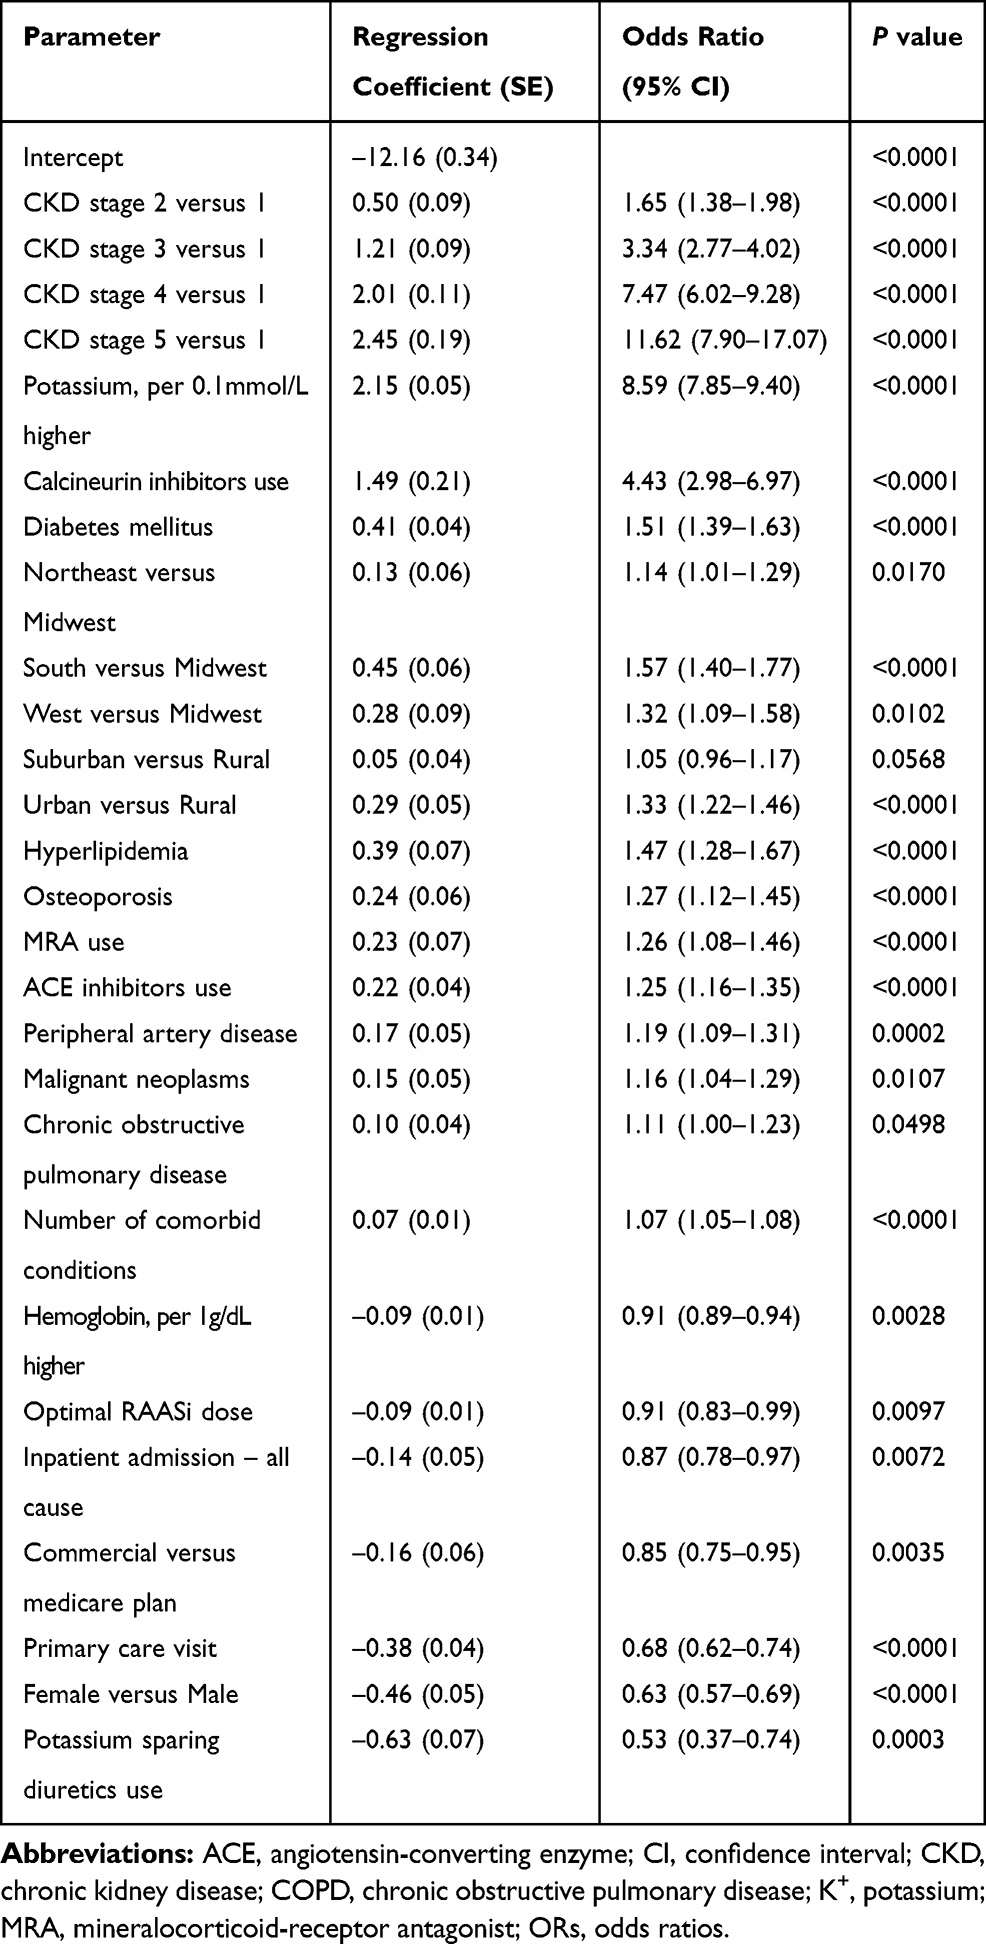 |
Table 4 List of Predictive Variables in the Final Logistic Model |
Validation of the Logistic Prediction Model
Nine predictive models were developed and compared by their AUROC during validation (Figure 2). Among the models based solely on single-feature variables, laboratory-only (M5) performed best (AUROC: 0.784), followed by CKD stage and comorbidities (M2, AUROC: 0.741), whereas models based solely on drugs (M3) or HCRU (M4) or demographics (M1) yielded poor AUROCs. Fitting the model using all predictive variables (full model) yielded a logistic regression model with 27 nonzero coefficients, plus an intercept. The full model’s AUROC was 0.843, demonstrating good discriminative performance.
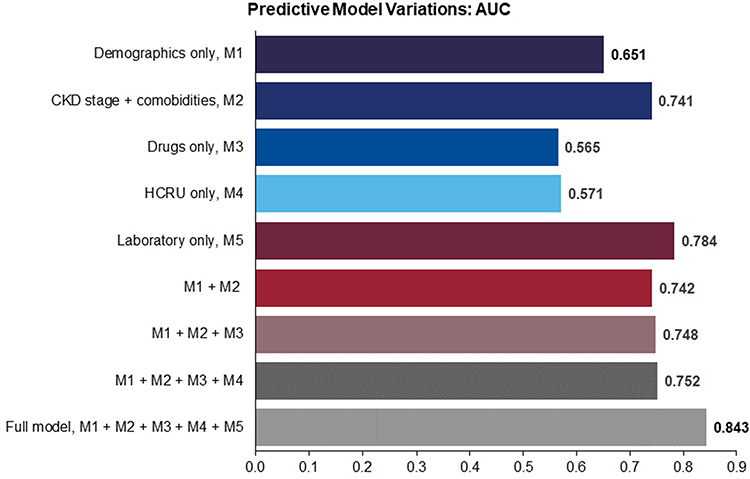 |
Figure 2 Nine candidate models based on single and combinations of variables. |
Figure 3 shows the prediction model’s risk estimation of HK and stratification performance. The model’s estimated average HK risk across the population closely matched the average actual risk (1.43% versus 1.51%, respectively). The mean absolute error was 1.48%, suggesting good accuracy calibration. There was, on average, a 1% increase in risk with each higher stratum, and those in the highest-risk stratum had 240 times the probability of developing HK in the PY than those in the lowest-risk stratum (9.15% versus 0.04%, respectively). The second-highest risk strata’s actual risk was 2.9%, significantly higher than the overall mean of 1.43% for the cohort. Model calibration showed that the top 2 prediction deciles (20% of the study population) identified 75.94% of individuals first identified with hyperkalemia in the PY.
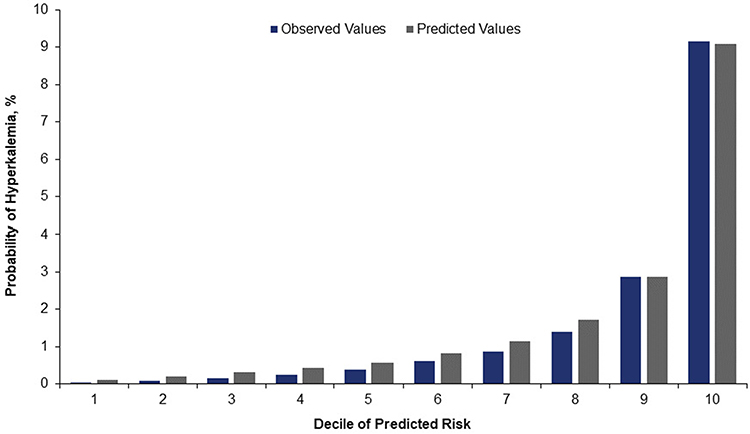 |
Figure 3 HK risk estimation and stratification performance. Calibration plot of observed versus predicted risk of HK during the follow-up period. The predicted risk estimated by the model stratifies the population and yields estimates of the average risk of HK (gray bar) within each decile (risk stratum). The estimates are compared to the actual (observed) risk in each decile (blue bar). |
The model somewhat overpredicted deciles 1–8 and was very close for deciles 9 and 10 in people who actually developed HK. Model gains are shown in Figure 4. For a given decile, gain is the cumulative number of individuals correctly identified with HK up to that point, divided by the total number of individuals with HK. For example, for the second-highest decile, gain = 1572/2070 = 75.94%.
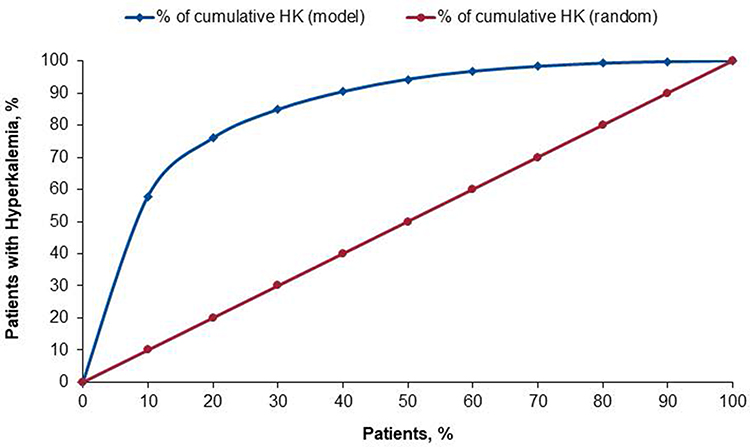 |
Figure 4 Model Validation: Gains chart. The predicted risk stratifies the population and evaluates the cumulative rate of actual HK at each decile (blue line) within each decile. Starting from the highest- toward the lowest-risk decile, the cumulative rate of HK is compared to the rate without predictive model (random selection) in each decile (red line). |
Discussion
Early identification and appropriate management with pharmacologic inhibition of the RAAS has been shown to mitigate the consequences of CKD and slow the progression to ESRD. Yet more than one-third of new ESRD patients receive little or no pre-ESRD nephrology care,30 despite dissemination of kidney disease and diabetes practice guidelines.31–33 To accelerate improving the quality and outcomes of kidney care, the US Department of Health and Human Services recently launched the Advancing American Kidney Health initiative, targeting early CKD identification and incenting evidence-based management of advanced CKD and ESRD.34,35
Using a large national administrative claims database, we identified members with CKD but without HK or dialysis. We developed and internally validated a model to predict the occurrence of HK in the following year. The performance characteristics of the logistic regression model were comparable to those of a neural network and decision tree model (data not shown in this article). We therefore selected the logistic model because of its general applicability in a clinical or care-management setting.
The model’s performance was promising for potential use and further development in health plan–based care management: AUROC was 0.843; the numbers of predicted versus observed individuals with HK were well matched in the highest probability deciles; and a cutoff of the top 20% scores captured more than three-quarters of those who exhibited HK.
There is much evidence supporting maximal recommended RAASi dosing, if tolerated.6,7 An individualized approach using predictive analytics to identify patients at high risk of HK may allow clinicians to treat to guideline-recommended RAASi dosing.
Until recently, options for reducing chronic HK have been limited, but the recent introduction of novel potassium binders patiromer and sodium zirconium cyclosilicate may allow patients to safely achieve higher RAASi doses—underscoring the value of being able to quantitatively predict who will develop HK.36
To our knowledge, no HK predictive model has been validated using data typically available from health plans. The few published predictive models are based on clinical data from integrated health systems. Johnson and colleagues developed a model to predict quintile risk of HK (serum potassium ≥5.5 mmol/L) in patients with eGFR <60 mL/min/m2 within 90 days of starting lisinopril without diuretics. The observed risk was 6.9% and 0.7% for the highest and lowest quintiles, respectively; predicted and observed risks agreed within 1%, but formal performance characteristics were not reported.36 A model based on clinical data and validated in a different healthcare system found that 6 variables (male, diabetes, congestive heart failure, use of potassium-sparing diuretics, lower eGFR, and higher baseline serum potassium) yielded an AUROC of 0.845 and a decile calibration plot comparable to our health plan data model.37
A potential advantage of administrative claims over clinical data is that it essentially covers an individual’s entire continuum of care. Still, claims may under identify HK,38 lab results may not be available, and false positive and negative identifications might arise from lags in claims adjudication. Health plans are familiar with addressing these limitations, and our findings of approximately 6% HK prevalence in both years (BY/PY) is reassuring in that regard. In total, 21 independent predictors were included in the final model. The model may be theoretical in clinical practice, and we usually transform the model’s parameters into a score; but with artificial intelligence technology, it could be implemented in clinical decision-making systems to identify high risk or subpopulations likely to benefit from an early intervention.
A population health program must weigh the marginal cost of outreach against the probability and potential impact of a true identification to maximize the value of its resources. The clinical and economic importance of optimizing RAASi dosing,39–41 together with the emergence of novel potassium binders,24,39–44 make it high value to quantitatively predict the onset of HK in CKD. Health plans will need to adjust their already robust, informatics-driven identification, risk-stratification, and efficient outreach programs to address these concerns.
Conclusion
By slowing the progression of CKD, RAASi have transformed its management, but HK can threaten the optimal use and dosing of these drugs. To facilitate broader, safe use of RAASi, we demonstrated that a predictive model based on administrative claims and laboratory results provides an acceptable level of accuracy in identifying both very high and very low risk CKD patients for HK in a large health plan. The model has been internally validated, but still needs external validation. When validated, this model could improve health outcomes and lower associated costs in the CKD population at the point of care or in population health strategies.
Acknowledgments
Medical writing was provided by Telochain, and editorial support services were provided by Impact Communication Partners, Inc. The abstract of this paper was presented at the 2019 International Society for Pharmacoeconomics and Outcomes Research (ISPOR) International Meeting as a poster presentation with interim findings. The poster’s abstract was published in ISPOR 2019: Rapid. Disruptive. Innovative: A New Era in HEOR in Value in Health. 2019;22 (suppl 2):S385: DOI https://doi.org/10.1016/j.jval.2019.04.1877.
Author Contributions
All authors made substantial contributions to conception and design, acquisition of data, or analysis and interpretation of data; took part in drafting the article or revising it critically for important intellectual content; agreed to submit to the current journal; gave final approval of the version to be published; and agree to be accountable for all aspects of the work.
Funding
The analysis reported in this manuscript was funded by Relypsa, Inc., a Vifor Pharma Group Company. Medical writing assistance and editorial support were funded by Relypsa, Inc., a Vifor Pharma Group Company.
Disclosure
AS reports serving as a clinical investigator for and employment by Healthagen LLC, which conducted research funded by Relypsa, Inc., a Vifor Pharma Group Company. PJA, and SDW report employment by Relypsa Inc., a Vifor Pharma Group Company and stock in Vifor Pharma. DD reports employment by Healthagen LLC, which conducted research funded by Relypsa, Inc., a Vifor Pharma Group Company. The authors report no other potential conflicts of interest for this work.
References
1. United States Renal Data System. USRDS 2018 annual data report: atlas of chronic kidney disease and end-stage renal disease in the United States. National Institutes of Health, National Institute of Diabetes and Digestive and Kidney Diseases; 2018. Available from: https://www.usrds.org/2018/view/Default.aspx.
2. Khan SS, Kazmi WH, Abichandani R, Tighiouart H, Pereira BJ, Kausz AT. Health care utilization among patients with chronic kidney disease. Kidney Int. 2002;62(1):229–236. doi:10.1046/j.1523-1755.2002.00432.x
3. Smith DH, Gullion CM, Nichols G, Keith DS, Brown JB. Cost of medical care for chronic kidney disease and comorbidity among enrollees in a large HMO population. J Am Soc Nephrol. 2004;15(5):1300–1306. doi:10.1097/01.asn.0000125670.64996.bb
4. Wyld ML, Lee CM, Zhuo X, et al. Cost to government and society of chronic kidney disease stage 1–5: a national cohort study. Intern Med J. 2015;45(7):741–747. doi:10.1111/imj.12797
5. Golestaneh L, Alvarez PJ, Reaven NL, et al. All-cause costs increase exponentially with increased chronic kidney disease stage. Am J Manag Care. 2017;23(10 Suppl):S163–S172.
6. Brenner BM, Cooper ME, de Zeeuw D, et al. Effects of losartan on renal and cardiovascular outcomes in patients with type 2 diabetes and nephropathy. N Engl J Med. 2001;345(12):861–869. doi:10.1056/NEJMoa011161
7. Lewis EJ, Hunsicker LG, Clarke WR, et al. Renoprotective effect of the angiotensin-receptor irbesartan in patients with nephropathy due to type 2 diabetes. N Engl J Med. 2001;345(12):851–860. doi:10.1056/NEJMoa011303
8. The GISEN Group. Randomised placebo-controlled trial of effect of ramipril on decline in glomerular filtration rate and risk of terminal renal failure in proteinuric, non-diabetic nephropathy. Lancet. 1997;349(9069):1857–1863. doi:10.1016/S0140-6736(96)11445-8
9. Ruggenenti P, Perna A, Gherardi G, Gaspari F, Benini R, Remuzzi G. Renal function and requirement for dialysis in chronic nephropathy patients on long-term ramipril: REIN follow-up trial. Gruppo Italiano di Studi Epidemiologici in Nefrologia (GISEN). Ramipril Efficacy in Nephropathy. Lancet. 1998;352(9136):1252–1256. doi:10.1016/s0140-6736(98)04433-x
10. Ruggenenti P, Perna A, Benini R, et al. In chronic nephropathies prolonged ACE inhibition can induce remission: dynamics of time-dependent changes in GFR. Investigators of the GISEN Group. Gruppo Italiano Studi Epidemiologici in Nefrologia. J Am Soc Nephrol. 1999;10(5):997–1006.
11. Reaven NR, Funk SE, Bakris GL. The economics of renoprotective therapy in advanced diabetic kidney disease. Am J Pharm Benefits. 2014;6(6):e169–e176.
12. Palmer BF. Managing hyperkalemia caused by inhibitors of the renin-angiotensin-aldosterone system. N Engl J Med. 2004;351(6):585–592. doi:10.1056/NEJMra035279
13. Polson M, Lord TC, Kangethe A, et al. Clinical and economic impact of hyperkalemia in patients with chronic kidney disease and heart failure. J Manag Care Spec Pharm. 2017;23(suppl4–a):S2–S9.
14. Maggioni AP, Anker SD, Dahlström U, et al. Heart Failure Association of the ESC. Are hospitalized or ambulatory patients with heart failure treated in accordance with European Society of Cardiology guidelines? Evidence from 12,440 patients of the ESC Heart Failure Long-Term Registry. Eur J Heart Fail. 2013;15(10):1173–1184. doi:10.1093/eurjhf/hft134
15. Shirazian S, Grant CD, Mujeeb S, et al. Underprescription of renin–angiotensin system blockers in moderate to severe chronic kidney disease. N Am J Med Sci. 2015;349(6):510–515. doi:10.1097/MAJ.0000000000000475
16. Rassi AN, Cavender MA, Fonarow GC, et al. Temporal trends and predictors in the use of aldosterone antagonists post-acute myocardial infarction. J Am Coll Cardiol. 2013;61(1):35–40. doi:10.1016/j.jacc.2012.08.1019
17. Palmer BF. A physiologic-based approach to the evaluation of a patient with hyperkalemia. Am J Kidney Dis. 2010;56(2):387–393. doi:10.1053/j.ajkd.2010.01.020
18. Latts LM, Reaven NL, Funk SE, McGaughey KJ, Oestreicher O, Adamson RT Hyperkalemia is prevalent in patients with cardiorenal comorbidities.
19. Betts KA, Wooley JM, Mu F, Xiang C, Tang W, Wu EQ. The cost of hyperkalemia in the United States. Kidney Int Rep. 2018;3(2):385–393. doi:10.1016/j.ekir.2017.11.003
20. Rafique Z, Weir M, Onuigbo M, et al. Expert panel recommendations for the identification and management of hyperkalemia and role of patiromer in patients with chronic kidney disease and heart failure. J Manag Care Spec Pharm. 2017;23(4–a):S10–S20. doi:10.18553/jmcp.2017.23.4-a.s10
21. Hernandez I, Zhang Y. Using predictive analytics and big data to optimize pharmaceutical outcomes. Am J Health Syst Pharm. 2017;74(18):1494–1500. doi:10.2146/ajhp161011
22. Charlson ME, Pompei P, Ales KL, MacKenzie CR. A new method of classifying prognostic comorbidity in longitudinal studies: development and validation. J Chronic Dis. 1987;40(5):373–383. doi:10.1016/0021-9681(87)90171-8
23. Quan H, Sundararajan V, Halfon P, et al. Coding algorithms for defining comorbidities in ICD-9-CM and ICD-10 administrative data. Med Care. 2005;43(11):1130–1139. doi:10.1097/01.mlr.0000182534.19832.83
24. Centers for Medicare & Medicaid Services. 2019 medicare-medicaid plan performance data technical notes; 2019. Available from: https://www.cms.gov/Medicare-Medicaid-Coordination/Medicare-and-Medicaid-Coordination/Medicare-Medicaid-Coordination-Office/FinancialAlignmentInitiative/Downloads/MMPPerformanceDataTechNotes.pdf.
25. Kosiborod M, Rasmussen HS, Lavin P, et al. Effect of sodium zirconium cyclosilicate on potassium lowering for 28 days among outpatients with hyperkalemia: the HARMONIZE randomized clinical trial. JAMA. 2014;312(21):2223–2233. doi:10.1001/jama.2014.15688
26. Harrell FE, Lee KL, Mark DB. Multivariable prognostic models: issues in developing models, evaluating assumptions and adequacy, and measuring and reducing errors. Stat Med. 1996;15(4):361–387. doi:10.1002/(SICI)1097-0258(19960229)15:4<361::AID-SIM168>3.0.CO;2-4
27. Hosmer DW, Lemeshow S. Model-building strategies and methods for logistic regression. In: Hosmer DW, Lemeshow S, editors. Applied Logistic Regression.
28. DeLong ER, DeLong DM, Clark-Pearson DL. Comparing the area under two or more correlated receiving operating characteristic curves: a nonparametric approach. Biometrics. 1988;44(3):837–845. doi:10.2307/2531595
29. Hanley JA, McNeil BJ. The meaning and use of the area under a receiver operating characteristic (ROC) curve. Radiology. 1982;143(1):29–36. doi:10.1148/radiology.143.1.7063747
30. CKD United States Renal Data System. End-stage renal disease (ESRD) in the United States. In: USRDS 2018 annual data report: atlas of chronic kidney disease and end-stage renal disease in the United States. National Institutes of Health; National Institute of Diabetes and Digestive and Kidney Diseases; 2018. Available from: https://www.usrds.org/2018/view/Default.aspx.
31. Kidney Disease Outcomes Quality Initiative (K/DOQI). K/DOQI clinical practice guidelines on hypertension and antihypertensive agents in chronic kidney disease. Am J Kidney Dis. 2004;43(5 suppl 1):S1–S290.
32. Kidney Disease: Improving Global Outcomes (KDIGO) Blood Pressure Work Group. KDIGO Clinical practice guideline for the management of blood pressure in chronic kidney disease. Kidney Int Suppl. 2012;2:337–414.
33. American Diabetes Association. 11. Microvascular complications and foot care: standards of medical care in diabetes—2019. Diabetes Care. 2019;42(suppl1):S124–S138. doi:10.2337/dc19-S011
34. HHS launches President Trump’s Advancing American Kidney Health Initiative. News release. US department of health and human services; 2019. Available from: https://www.hhs.gov/about/news/2019/07/10/hhs-launches-president-trump-advancing-american-kidney-health-initiative.html.
35. US Department of Health and Human Services. Advancing American kidney health; 2019. Available from: https://aspe.hhs.gov/pdf-report/advancing-american-kidney-health.
36. Johnson ES, Weinstein JR, Thorp ML, et al. Predicting the risk of hyperkalemia in patients with chronic kidney disease starting lisinopril. Pharmacoepidemiol Drug Saf. 2010;19(3):266–272. doi:10.1002/pds.1923
37. Bandak G, Sang Y, Gasparini A, et al. Hyperkalemia after initiating renin-angiotensin system blockade: the Stockholm Creatinine Measurements (SCREAM) project. J Am Heart Assoc. 2017;6(7):
38. Urbine TF, Schwenke DC, Wu WC, Dev S. ICD9 coding of hyperkalemia greatly underestimates incidence of lab-defined hyperkalemia in veterans with heart failure. J Card Fail. 2013;19(8):S32. doi:10.1016/j.cardfail.2013.06.107
39. Fitch K, Woolley JM, Engel T, Blumen H. The clinical and economic burden of hyperkalemia on Medicare and commercial payers. Am Health Drug Benefits. 2017;10(4):202–210.
40. Packham DK, Rasmussen HS, Lavin PT, et al. Sodium zirconium cyclosilicate in hyperkalemia. N Engl J Med. 2015;372(3):222–231. doi:10.1056/NEJMoa1411487
41. Pitt B, Bakris GL, Bushinsky DA, et al. Effect of patiromer on reducing serum potassium and preventing recurrent hyperkalaemia in patients with heart failure and chronic kidney disease on RAAS inhibitors. Eur J Heart Fail. 2015;17(10):1057–1065. doi:10.1002/ejhf.402
42. Weir MR, Bakris GL, Bushinsky DA, et al. Patiromer in patients with kidney disease and hyperkalemia receiving RAAS inhibitors. N Engl J Med. 2015;372(3):211–221. doi:10.1056/NEJMoa1410853
43. Weir MR, Bushinsky DA, Benton WW, et al. Effect of patiromer on hyperkalemia recurrence in older chronic kidney disease patients taking RAAS inhibitors. Am J Med. 2018;131(5):e3. doi:10.1016/j.amjmed.2017.11.011
44. Pitt B, Anker SD, Bushinsky DA, et al. Evaluation of the efficacy and safety of RLY5016, a polymeric potassium binder, in a double-blind, placebo-controlled study in patients with chronic heart failure (the PEARL-HF) trial. Eur Heart J. 2011;32(7):820–828. doi:10.1093/eurheartj/ehq502
 © 2020 The Author(s). This work is published and licensed by Dove Medical Press Limited. The
full terms of this license are available at https://www.dovepress.com/terms
and incorporate the Creative Commons Attribution
- Non Commercial (unported, 3.0) License.
By accessing the work you hereby accept the Terms. Non-commercial uses of the work are permitted
without any further permission from Dove Medical Press Limited, provided the work is properly
attributed. For permission for commercial use of this work, please see paragraphs 4.2 and 5 of our Terms.
© 2020 The Author(s). This work is published and licensed by Dove Medical Press Limited. The
full terms of this license are available at https://www.dovepress.com/terms
and incorporate the Creative Commons Attribution
- Non Commercial (unported, 3.0) License.
By accessing the work you hereby accept the Terms. Non-commercial uses of the work are permitted
without any further permission from Dove Medical Press Limited, provided the work is properly
attributed. For permission for commercial use of this work, please see paragraphs 4.2 and 5 of our Terms.