Back to Journals » Drug Design, Development and Therapy » Volume 15
A Highly Sensitive Nonextraction-Assisted HPLC Method with Fluorescence Detection for Quantification of Duvelisib in Plasma Samples and its Application to Pharmacokinetic Study in Rats
Authors Sayed AY, Khalil NY, Almomen A ![]() , Alzoman NZ, Almehizia AA
, Alzoman NZ, Almehizia AA ![]() , Darwish IA
, Darwish IA ![]()
Received 6 May 2021
Accepted for publication 28 May 2021
Published 21 June 2021 Volume 2021:15 Pages 2667—2677
DOI https://doi.org/10.2147/DDDT.S318714
Checked for plagiarism Yes
Review by Single anonymous peer review
Peer reviewer comments 2
Editor who approved publication: Prof. Dr. Georgios Panos
Ahmed Y Sayed, Nasr Y Khalil, Aliyah Almomen, Nourah Z Alzoman, Abdulrahman A Almehizia, Ibrahim A Darwish
Department of Pharmaceutical Chemistry, College of Pharmacy, King Saud University, Riyadh, 11451, Saudi Arabia
Correspondence: Ibrahim A Darwish
Department of Pharmaceutical Chemistry, College of Pharmacy, King Saud University, P.O. Box 2457, Riyadh, 11451, Saudi Arabia
Tel +966-114677348
Fax +966-114676220
Email [email protected]
Background: Duvelisib (DUV) is a new oral phosphoinositide-3-kinase (PI3K)-δ and PI3K-γ inhibitor. It has been recently granted an accelerated approval for treatment of adult patients with relapsed or refractory chronic lymphocytic leukemia (CLL) and small lymphocytic lymphoma (SLL). It is also effective in therapy of T-cell lymphoma, solid tumors, and non-Hodgkin’s lymphoma. In literature, there is no method valid for quantitation of DUV in human plasma for its therapeutic monitoring and pharmacokinetic studies.
Purpose: The purpose of this study is the establishment of a highly sensitive HPLC method with fluorescence detection for quantitation of DUV in plasma for its therapeutic monitoring and pharmacokinetic studies of DUV.
Methods: The resolution of DUV and the internal standard (IS) olaparib (OLA) was achieved on Nucleosil CN column, with a mobile phase composed of acetonitrile:water (25:75, v/v) at a flow rate of 1.7 mL min– 1. The fluorescence of both DUV and OLA was detected at 410 nm after excitation at 280 nm. The method was validated according to the guidelines of bioanalytical method validation.
Results: The method was linear in the range of 5– 100 ng mL– 1, and its limit of detection (LOD) and limit of quantitation (LOQ) were 2.12 ng mL– 1 and 7 ng mL– 1, respectively. The precisions of the method were ≤ 8.26%, and its accuracies were ≥ 95.32%. All the other validation parameters were satisfactory. The proposed method was successfully employed to the investigation of the pharmacokinetic profile of DUV in rats following a 25 mg/kg single dose of oral administration.
Conclusion: The method is characterized with high sensitivity, accuracy, simple sample pretreatment, rapidity, eco-friendly as it consumes low volumes of organic solvent in the mobile phase and has high analysis throughput as its run time was short (~ 10 min).
Keywords: leukemia, phosphoinositide-3-kinase, duvelisib; DUV, human plasma, therapeutic drug monitoring, pharmacokinetic study
Introduction
Leukemia is a type of cancer that starts in blood-forming tissue (e.g., bone marrow). Chronic lymphocytic leukemia (CLL) is a hematologic malignancy characterized by an overproduction of B-lymphocytes which are the immature lymphoid stem cells.1 Small lymphocytic lymphoma (SLL) is a disease that is very similar to CLL; therefore, their names are often used interchangeably.1,2 Standard treatment for CLL and SLL include chemotherapy with various agents administered individually or in combination and immunotherapy. These therapies include nucleoside analogues, alkylating agents, immunomodulatory-antiangiogenic agents and monoclonal antibodies. Some of these regimes have overall response rates of ≥ 90%, and their median survival is > 10 years; however, eventual relapse occurs with reduced response rates and survival duration.3,4 This necessitates the discovery of new effective and safe drugs with innovative ways of action.
Phosphoinositide 3-kinase (PI3K) is a lipid kinase involved in the intracellular signal transduction. The catalytic subunit of PI3K exists in four isoforms: α, β, δ and γ.5,6 Inhibition of both PI3K-δ and PI3K- γ cause blockade in the tumor microenvironment-mediated malignant β-cell proliferation and migration.7–9 Also, inhibition of both PI3K-δ and PI3K-γ has complementary dual isoform contributions to tumor growth and survival.10,11 Accordingly, dual inhibition of PI3K- δ and γ may enhance the therapeutic benefits in patients with lymphoid malignancies.12 The proven role of PI3K-δ and PI3K-γ in hematologic malignancies has triggered the recent development of class-specific inhibitors of PI3K for use as anticancer agents.11 Idelalisib is the first-in-class of PI3Kδ inhibitors for treatment of CLL (in combination with rituximab), relapsed follicular lymphoma, and relapsed SLL (as monotherapy). Furthermore, it was approved as first-line therapy for poor-prognosis CLL with 17p deletions or TP53 mutations and in patients unsuitable for chemoimmunotherapy.12 Duvelisib (DUV; also known as IPI-145) is chemically named as: 8-chloro-2-phenyl-3-[(1S)-1-(7H-purin-6-ylamino)ethyl]isoquinolin-1-one. It is a small-molecule with dual inhibitory action for both PI3K-δ and PI3K-γ. It demonstrates selective antiproliferative activity against leukemia cells.13 DUV was developed by Verastem, Inc. (Maryland, USA) and its strong evidence-based clinical success and overall response rate have led to its recent (on Sept. 24, 2018) approval by the FDA for treatment of adult patients with relapsed or refractory CLL or SLL14 and accelerated approval for treatment of relapsed or refractory follicular lymphoma.15 DUV has also potential activity on T-cell lymphoma.14,15 DUV is marketed under the trade name, Copiktra® (Verastem, Inc., USA). The recommended dose is 25 mg administered as oral capsules twice daily with a treatment cycle of 28 days.14
Effective and safe therapy with DUV depends on the quality of its dosage form (Copiktra® capsules) and the assessment of its plasma concentrations in patients during therapy. Ch et al16 described HPLC method with photodiode array detector for estimation and stability assessment of DUV in a laboratory-made synthetic mixture. Siddesh et al17 described HPLC with UV detection for estimation of DUV in rat plasma; however, the method involved tedious liquid-liquid extraction process, and its accuracy was ~ 88%. Nigade et al18 described UPLC-MS/MS method for prediction of tissue-to-plasma distribution ratios of basic compounds including DUV in mice; however, this method involved time-consuming sample pretreatment procedures and long run time to achieve a full chromatographic separation of DUV from the other co-administered compounds. Recently, Shao et al19 described UPLC-MS/MS method for determination of DUV in beagle dogs with high sensitivity (0.5 ng mL–1) and better accuracy (86.3% to 94.9%). It is obvious from this review that none of the existing methods was not validated for therapeutic monitoring of DUV in human plasma during patient therapy, and also, these methods rely on instrumental intensive LC-MS/MS. For these reasons, there is an urgent need for new alternative method for determination of DUV in human plasma samples with high sensitivity, simple extraction procedure and enhanced accuracy. HPLC with fluorescence detection (HPLC-FD) has been used as a sensitive and less costly alternative approach than LC-MS-MS.
In this study, we developed and validated a highly sensitive HPLC method with fluorescence detection (HPLC-FD) for quantitation of DUV in plasma samples with LOQ of 7 ng mL–1. The method involved a very simple quick non-extractive preparation of plasma samples using protein precipitation with methanol. The method was successfully applied to the determination of DUV in human plasma samples and to pharmacokinetic studies of DUV in rats.
Methods
Materials and Experimental Animals
DUV and olaparib (OLA) were purchased from LC Laboratories (Woburn, USA); their purities were >99%. Human plasma was obtained from the Blood Bank of King Khalid University Hospital (Riyadh, Saudi Arabia), and it was stored in freezer at –20 °C until analysis. All solvents were of HPLC grade (Merck, Darmstadt, Germany). All other materials were of analytical grade.
Healthy male Wistar rats weighing 250 ± 30 g were obtained from the animal facility of College of Pharmacy at King Saud University (Riyadh, Saudi Arabia). Daily observation of all rats was done to ensure that all animals maintained good health. The rats were placed in cages kept at standard laboratory conditions; a well-ventilated room, a regular 12 h day–night cycle, an average temperature of 24–27°C, and a relative humidity of 40–60%. All the rats had free access to water while diet was prohibited for 12 h before conducting the experiment. The rats were acclimatized for 7 days to laboratory conditions before initiating the study.
Preparation of DUV and OLA Standard Solutions
An accurately weighed amounts (5 mg) of each DUV and OLA (IS) were separately transferred into a 5-mL calibrated flask, dissolved in acetonitrile and completed to volume with the same solvent to produce stock solutions of 1.0 mg mL–1. These solutions were further diluted with the mobile phase to obtain working standard solutions of 1000 and 10,000 ng mL–1 for DUV and OLA, respectively.
Preparation of Calibration Standards and Quality Control Samples
The calibration standards were prepared by spiking blank human plasma with DUV and OLA (IS) to yield final concentrations of DUV in the range of 5–100 ng mL–1 and a fixed concentration of OLA (250 ng mL–1) in all the solutions. The plasma samples were mixed with equal volumes of methanol, vortexed for 30 seconds, and centrifuged for 10 min at 13,000 rpm by Biofuge Pico centrifuge (Heraeus Instruments, Germany). The supernatants were withdrawn using syringes fitted with 0.2 µm Millipore filters. Each sample (10 µL) was injected into the HPLC system.
Quality control (QC) samples at four different levels; 7 ng mL–1 (the limit of quantitation [LOQ]), lower quality control (LQC) 20 ng mL–1 (LQC is ~ three times of the LOQ); medium quality control (MQC) 60 ng mL–1 and high quality control (HQC) 80 ng mL–1. QC samples of DUV were prepared in the same manner as the calibration standards and stored in the refrigerator until use. The samples were analyzed on different days and the system suitability parameters were evaluated each working day.
HPLC System and Analysis Conditions
HPLC system (Shimadzu Corporation, Kyoto, Japan) equipped with auto-sampler and fluorescence detector (set at λex 280 nm and λem at 410 nm). HPLC column was Nucleosil CN (250 mm length × 4.6 mm i.d., 5 µm particle diameter) manufactured by Macherey-Nagel GmbH & Co. (Düren, Germany), connected to a guard column. The column temperature was kept constant at 25 ± 2 °C. Chromatographic resolutions were conducted in an isocratic mode with a mobile phase composed of acetonitrile:water (25:75, v/v) delivered at flow rate of 1.7 mL min–1. Aliquots (10 μL) of the sample (standards, blank plasma, blank plasma spiked with OLA [IS] or blank plasma spiked with both DUV and OLA) were injected into the HPLC system by the autosampler. The fluorescence detector was set at 280 nm as an excitation wavelength and 410 nm as an emission wavelength. The data was acquisitioned by CLASS-VP software, version 5.032 (Shimadzu Corporation, Kyoto, Japan). The relation between the peak area ratio of DUV to OLA peaks (Y-axis) and the DUV concentration (X-axis) was used as the basis for the quantification. The regression equation was derived and used for determination of DUV in its samples.
Method Validation Procedure
The proposed HPLC-FD method was fully validated as per required by ICH guidelines of validation of bioanalytical procedure20 to ensure acceptability of the method in terms of its linearity, sensitivity, precision, accuracy, selectivity, robustness, ruggedness, and stability of DUV in its samples. Linearity was tested by generating three independent calibration curves and derivation of the regression equations and the correlation coefficients of the calibration lines.
Assessment of Linearity and Sensitivity
The value of correlation coefficient of the calibration line was used to express the extent of method linearity. The sensitivity was expressed as LOD and LOQ. The formula used was: LOD or LOQ = ×SDa/b, where × = 3.3 for LOD and 10 for LOQ, SDa is the standard deviation (SD) of the intercept, and b is the slope of the calibration line.
Determination of Precision and Accuracy
Intra-day precision and accuracy were estimated by replicate (n = 6) analysis of each QC sample at four QC levels (LOQ, LQC, MQC and HQC) as a batch in a single run. The inter-day precision and accuracy were estimated by replicate (n = 3) analysis of each QC sample at each level on 3 consecutive days. The precisions were expressed as percentages of the relative standard deviation (RSD, %), and the accuracies were expressed percentages of the recovery values (recovery, %).
Determination of Method Selectivity and Chromatographic Parameters
The method selectivity was assessed by conducting blank experiments (DUV-free human plasma samples) to identify any peaks originated by possible biogenic plasma components. The chromatographic performance parameters (capacity factor, retention time, and peak areas) were determined, and their acceptability was evaluated as per the guidelines. The capacity factor (k’) for both DUV and OLA (IS) was calculated by the formula: k’ = (tR– t0)/t0; where tR and t0 are the retention times of the peak of interest and the solvent front, respectively. The separation factor or selectivity (α) was estimated by the formula: α = k’2/k’1; where k’1 and k’2 are retention factors of IS and DUV, respectively. Useful and practical measurement of the peak asymmetry factor was calculated at 10% of peak height. The resolution factor (Rs) was calculated by the formula: Rs = (t2 –t1)/0.5 (w2+w1); where t2 and t1 are the retention of DUV and OLA peaks and w2 and w1 are the peak width that were obtained from the intersection of the tangent with the base line of DUV and OLA. The column plate number was determined using the formula: N = 16 (tR/w)2; where w is the peak width.
Assessment of Method Robustness and Ruggedness
To assess the method robustness, minor changes in the method conditions (mobile phase composition and flow rate) were made and the effects of these changes on the method recovery and precision was checked. To assess the method ruggedness, the operating conditions of the method was applied to the analysis of DUV on two different HPLC instruments at two different laboratories and different elapsed times. Results were expressed as RSD (%).
Stability Studies of DUV in Samples
Stability of DUV at different conditions and places (autosampler, bench-top, freeze-thaw and long-term) studies were evaluated. For studying the autosampler stability, QC samples were stored for ∼48 h under autosampler conditions and then subjected to analysis. For studying the bench-top stability, plasma samples were kept at room temperature for ∼6 h. For freeze-thaw stability, three cycles of freeze (at −80 °C)–thaw (at room temperature) was performed. For studying the long-term stability, Samples were kept at −80°C for 60 days and then subjected to analysis. For the stability of stock solutions and working solutions of DUV and OLA, they were kept at room temperature for 24 h and in the refrigerator temperature (below 10°C) for 30 days prior to analysis. Freshly spiked calibration standards were used to perform all the stability tests. If the deviation was within ±15% from the mean calculated concentration of stability QC, the samples were considered stable in plasma.
Pharmacokinetic Study in the Rats
Five healthy male Wistar rats, weighing 250 ± 30 g, were housed at room temperature (25°C) and at an average relative humidity of 50%. Animal were administered DUV (25 mg/kg) dissolved in 1% dimethyl sulfoxide/saline through oral gavage. Blood samples (~ 300 μL) were collected prior to dosing and at predetermined time points after drug administration at 0.5, 1, 2, 3, 4, 6, and 8 h into heparinized tubes. Plasma was separated from blood samples by centrifugation at 4500 rpm and 4°C for 30 minutes and stored at −20°C until the time of analysis. The animal study has strictly followed the guidelines of the Research Ethics Committee (RCE) for conducting studies on living creatures at King Saud University (Riyadh, Saudi Arabia) with reference No: KSU‐SE‐20‐51.
Statistical Analysis
The statistical analysis was performed by Microsoft Excel Software, version 2018, of the Microsoft Office 365 (Microsoft Corporation, Redmond, Washington, USA). All values were given as mean ± SD or relative standard deviation (RSD). Regression analysis of the calibration line of the HPLC-FD method was performed by Data Analysis Package embedded in the Excel Software at a probability value (p value) < 0.05. Analysis included the calculation of the line’s parameters which included the intercept, slope, correlation coefficient, and variance.
The pharmacokinetic parameters were determined by the non-compartmental model using WinNonlin software (Pharsight Co., Mountain View, CA, USA). Area under the curve, zero to last and infinity (AUC0–24; AUC0-∞), the maximum plasma concentration (Cmax), time to achieve this concentration (Tmax), half-life (T½) and mean residence time (MRT) parameters were calculated. Means, SDs and RSD values (%) were calculated by utilizing Microsoft-Excel 2013 (Microsoft Corporation, Washington, USA).
Results and Discussion
Background and Strategy for Method Development
Since the development of DUV and its clinical success in treatment of CLL and SLL, it has been attracting the interest of researchers in different places of the world to expand its use in the therapy of T-cell lymphoma,21 solid tumors,22 and non-Hodgkin’s lymphoma.23 High frequency of adverse events leading to treatment discontinuation was reported in patients treated with DUV. The quantification of DUV in plasma samples could be useful to determine drug plasmatic concentration even in patients reducing DUV dosage due to adverse events. Furthermore, the relation between plasmatic levels and occurrence of adverse events is of potential interest for drug management in clinical practice. Therefore, pharmacokinetic information of DUV is important for its dosing optimization for safe and effective therapy. Accordingly, determining and monitoring the plasma concentrations of DUV is necessary. Few bioanalytical methods are existing for the determination of DUV,17–19 and these methods are characterized by poor sensitivity, low accuracy and/or based on LC–MS/MS which is expensive and not available in most clinical laboratories. In addition, none of these methods was validated for therapeutic monitoring of DUV. HPLC with fluorescence detection showed comparable sensitivity and less costly than LC-MS/MS. As expected from its chemical structure (Figure 1), DUV is a fluorescent molecule, and thus the present study was aimed to use its native fluorescence in the development of a sensitive HPLC-FD method for quantitation of DUV in human plasma samples. In previous studies,24–26 our laboratory has successfully developed simple non-extractive procedures for HPLC analysis of some pharmaceuticals in plasma samples. Therefore, this non-extractive procedure was employed in the development of the HPLC-FD method described herein.
 |
Figure 1 The chemical structures of duvelisib (DUV) and olaparib (OLA). |
Optimization of the HPLC-FD Conditions
It was found that DUV exhibits native fluorescence (Figure 2), therefore its native fluorescence was attempted for its detection in the present study. The fluorescence spectra (excitation and emission) of DUV indicated that it exhibits maximum fluorescence intensity at 410 nm after excitation at 280 nm (Figure 2). A currently going study in our laboratory showed that OLA is a highly fluorescent molecule and it exhibits a significant fluorescence emission at the emission wavelength of DUV (Figure 2). For this reason, OLA was considered as an internal standard (IS) in the HPLC-FD method described herein.
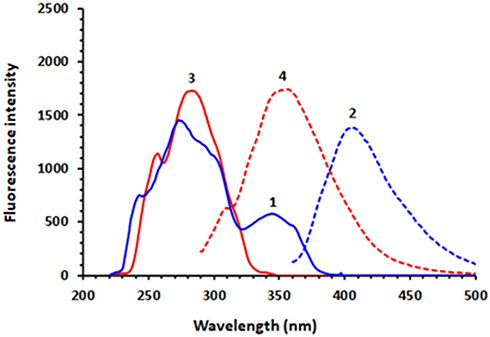 |
Figure 2 The excitation and emission spectra of DUV (1 and 2, respectively) and those of OLA (3 and 4, respectively). The concentrations of DUV and OLA were 100 and 50 ng mL−1, respectively; solutions were in methanol. |
Optimization of chromatographic conditions aimed to the establishment of the most appropriate mobile phase, column and flow rate. The separation was started in isocratic elution on C18 column (150 mm length × 3.9 mm i.d., 5 μm particle diameter) connected to a guard column. The column temperature was kept constant at 25 ± 2 °C. Experiments for separations were conducted using mobile phases composed of acetonitrile:water (50:50, v/v) and a flow rate of 1.5 mL min–1. Under these preliminary conditions, the run time was fairly long for application in therapeutic monitoring of DUV (run time was ~ 20 min and DUV was eluted at 16.5 min). This slow elution was attributed to the high lipophilic nature of DUV, thus, more polar cyano (CN) column was used instead and the composition of the mobile phase was changed to be acetonitrile:methanol:water (40:20:40, v/v). Under these conditions, the elution of DUV was significantly enhanced (retention time of DUV was ~ 4 min); however, it was not adequately resolved from the IS (OLA). For obtaining the best resolution, different mobile phase compositions were tested along with variations in their flow rates. The best resolution with good peak shape was realized when the mobile phase was acetonitrile:water (25:75, v/v) and the flow rate was 1.7 mL min−1.
Other reversed phase columns including C18 and phenyl columns (250 mm length × 4.6 mm i.d., 5 μm particle diameter; manufactured by Phenomenex USA) were also tested. Nucleosil CN (250 mm length × 4.6 mm i.d., 5 µm particle diameter) manufactured by Macherey-Nagel GmbH & Co. (Düren, Germany) gave the best chromatographic resolution, thus it was selected for all the subsequent work. Under these conditions a good resolution between DUV and OLA was achieved in a short run time (~10 min); OLA and DUV were eluted as sharp narrow symmetric peaks at 5.1 and 7.7 min, respectively (Figure 3). The system suitability and effectiveness were assessed and the chromatographic parameters (capacity factor, separation factor, resolution factor, peak symmetry factor, and number of effective theoretical plates) were measured; the results are given in Table 1.
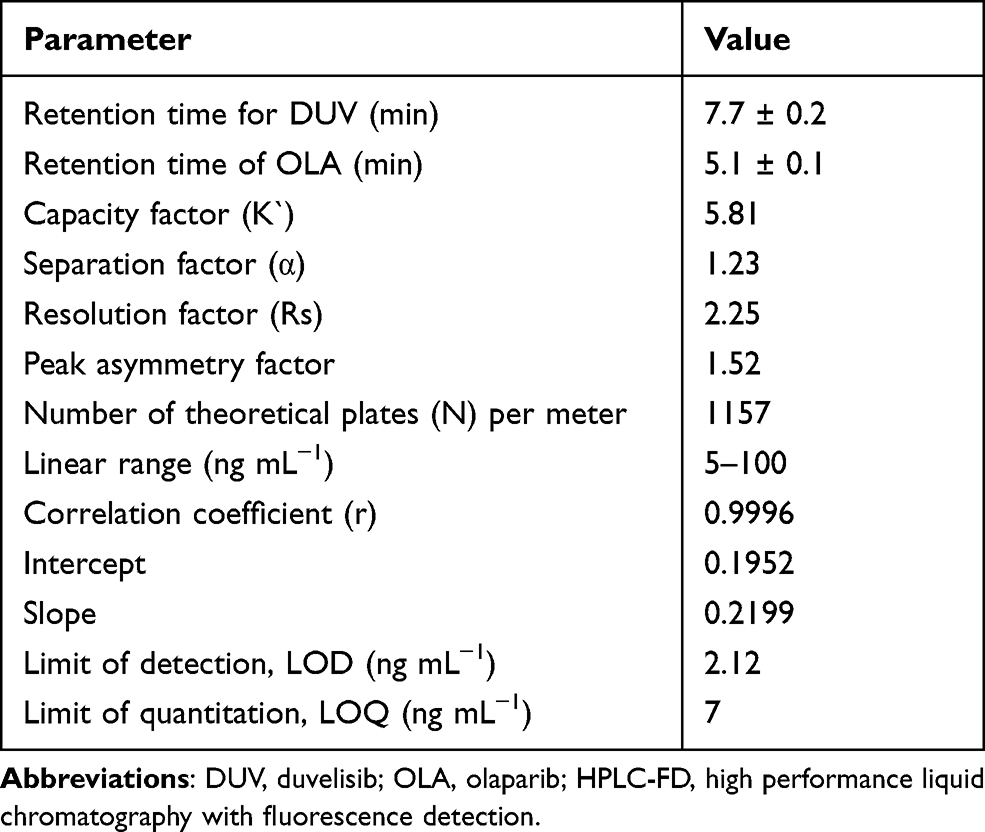 |
Table 1 Chromatographic Parameters for DUV and OLA (IS) by the Proposed HPLC-FD Method |
 |
Figure 3 The chromatogram standard solutions of DUV and OLA (internal standard). The concentrations of OLA and DUV 250 and 60 ng mL−1, respectively. |
Validation of the Proposed HPLC-FD Method
Selectivity and Carryover
The selectivity of the proposed bioanalytical HPLC-FD method was assessed by screening blank DUV-free human plasma samples. Figure 4 showed representative chromatograms at four different conditions as follows: a DUV-free sample (no DUV, no IS), a sample from blank plasma spiked with IS at a concentration of (250 ng mL–1), a sample from blank plasma spiked with both DUV at the LOQ concentration (7 ng mL–1) and IS at a concentration of (250 ng mL–1), sample from blank plasma spiked with both DUV at a concentration (60 ng mL–1) and IS at a concentration of (250 ng mL–1). As shown in Figure 4, no apparent interfering peaks were found at the corresponding retention times of both DUV and IS. In addition, no carryover was observed for either DUV or IS in plasma samples, as evident from the absence of any interference peaks following injection of LOQ-containing plasma samples.
 |
Figure 4 Representative chromatograms from (A) blank DUV-free human plasma, (B) plasma spiked with OLA (250 ng mL−1), (C) plasma spiked with OLA (250 ng mL−1) and DUV (7 ng mL−1; LOQ), and (D) plasma spiked with OLA (250 ng mL−1) and DUV (60 ng mL−1). mV is the detector response in millivolts. |
Linearity and Sensitivity
The relation between the peak area ratio of DUV/OLA (on Y-axis) versus DUV concentration (on X-axis) was found to be linear with good correlation coefficient (r) which was found to be 0.9996, in the range of 5–100 ng mL−1 of DUV (Figure 5). The fitting equation of the line was Y = 0.1952 + 0.2199 X. The RSD values of all points were less than 8% (Figure 5). The LOD and LOQ were calculated and found to be 2.12 and 7 ng mL–1, respectively.
 |
Figure 5 The calibration curve (●) and precision profile (▲) for determination of DUV in plasma by the proposed HPLC-FD method. |
Accuracy and Precision
The results of both intra- and inter-day accuracy (expressed as recovery, %) and precisions (expressed as RSD, %) of QC samples in plasma were summarized in Table 2. Intra-day recovery values were in the range of 95.32–103.22% (with a mean value of 99.01 ± 3.28%) whereas those of the inter-day were in the range of 96.11–104.38% (with a mean value of 99.89 ± 4.24%). These good recovery values confirmed the accuracy of the method. The RSD values in the intra- and inter-day precisions were in the range of 1.04–7.09 and 1.36–8.26%, respectively. These results proved that the HPLC-FD method has acceptable precision.
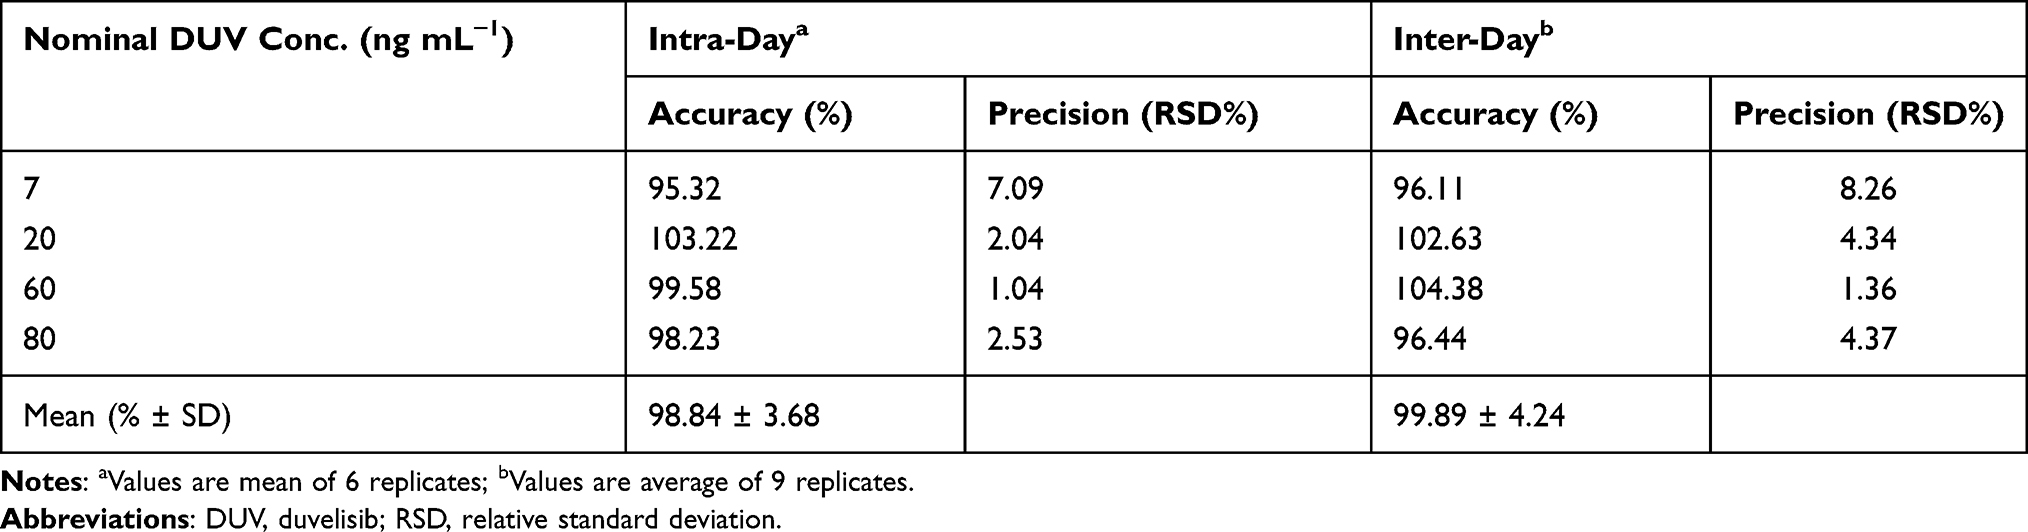 |
Table 2 Intra-Assay and Inter-Assay Precision and Accuracy for Determination of DUV in Spiked Human Plasma |
Robustness and Ruggedness
As shown in Table 3, the minor changes in the operating conditions of the HPLC-FD method did not alter the accuracy and precision of the method as revealed from the recovery values (97.45–103.29%) and the RSD did not exceed 5.58%. In ruggedness evaluation, the recovery values were in the range of 97.82–104.62% and the RSD values did not exceed 7.82%, indicating the ruggedness and reproducibility of the method.
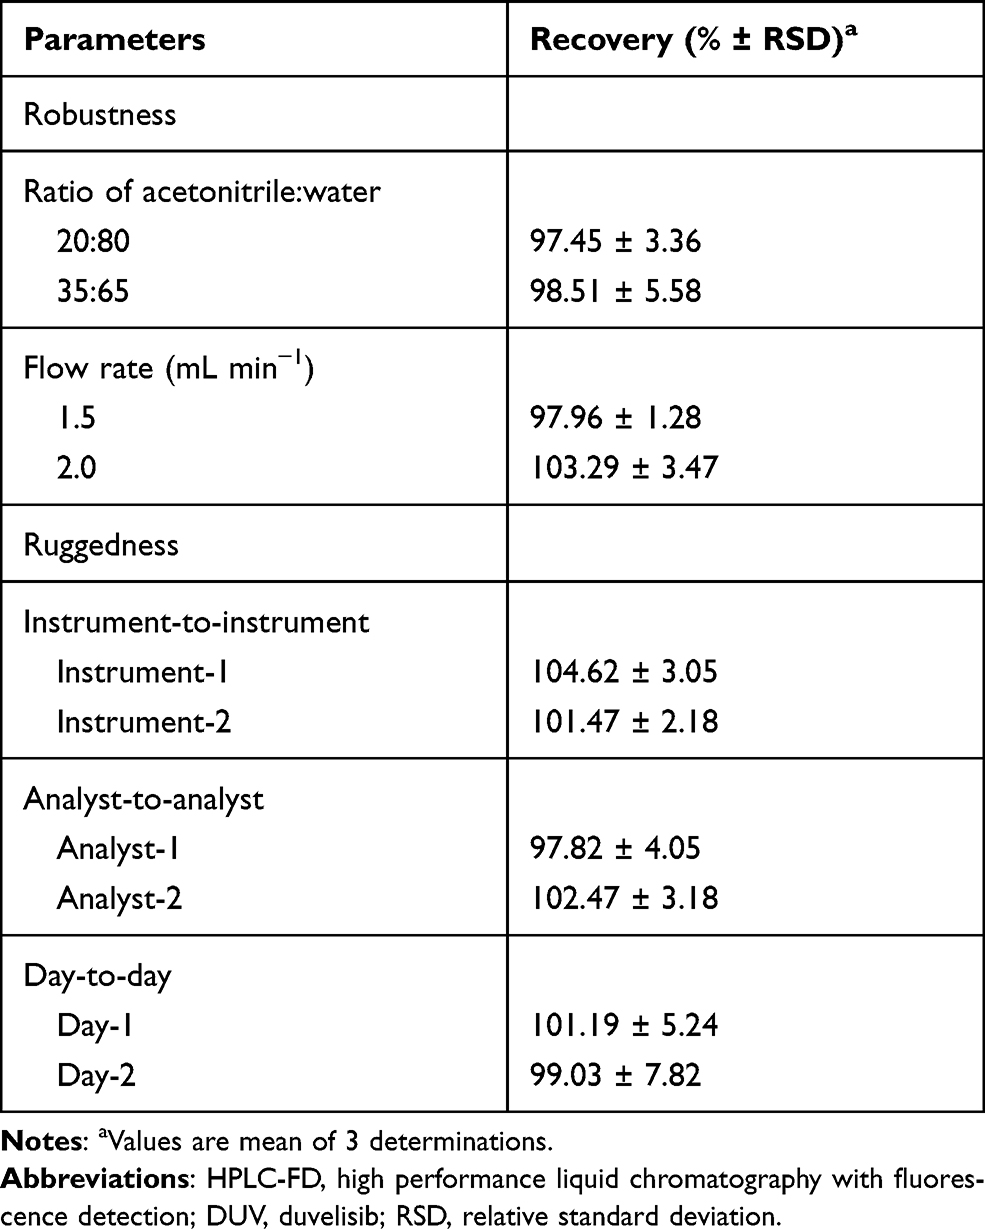 |
Table 3 Robustness and Ruggedness Study of the Proposed HPLC-FD Method for Determination of DUV in Human Plasma Samples |
Stability Studies of DUV in Plasma Samples
The results obtained from stability studies of DUV (Table 4) revealed that DUV in spiked human plasma samples was stable for a minimum of 6 h at room temperature on the bench and 48 h under autosampler storage conditions. DUV was also found to be stable during the three freeze–thaw cycles and at −80°C for 60 days. The stock and working standard solutions of DUV were found to be stable at refrigerator temperature (at 8°C) for 30 days. These results are evident from the obtained recovery values that were in the range of 95.54% and the RSD values did not exceed 7.15%.
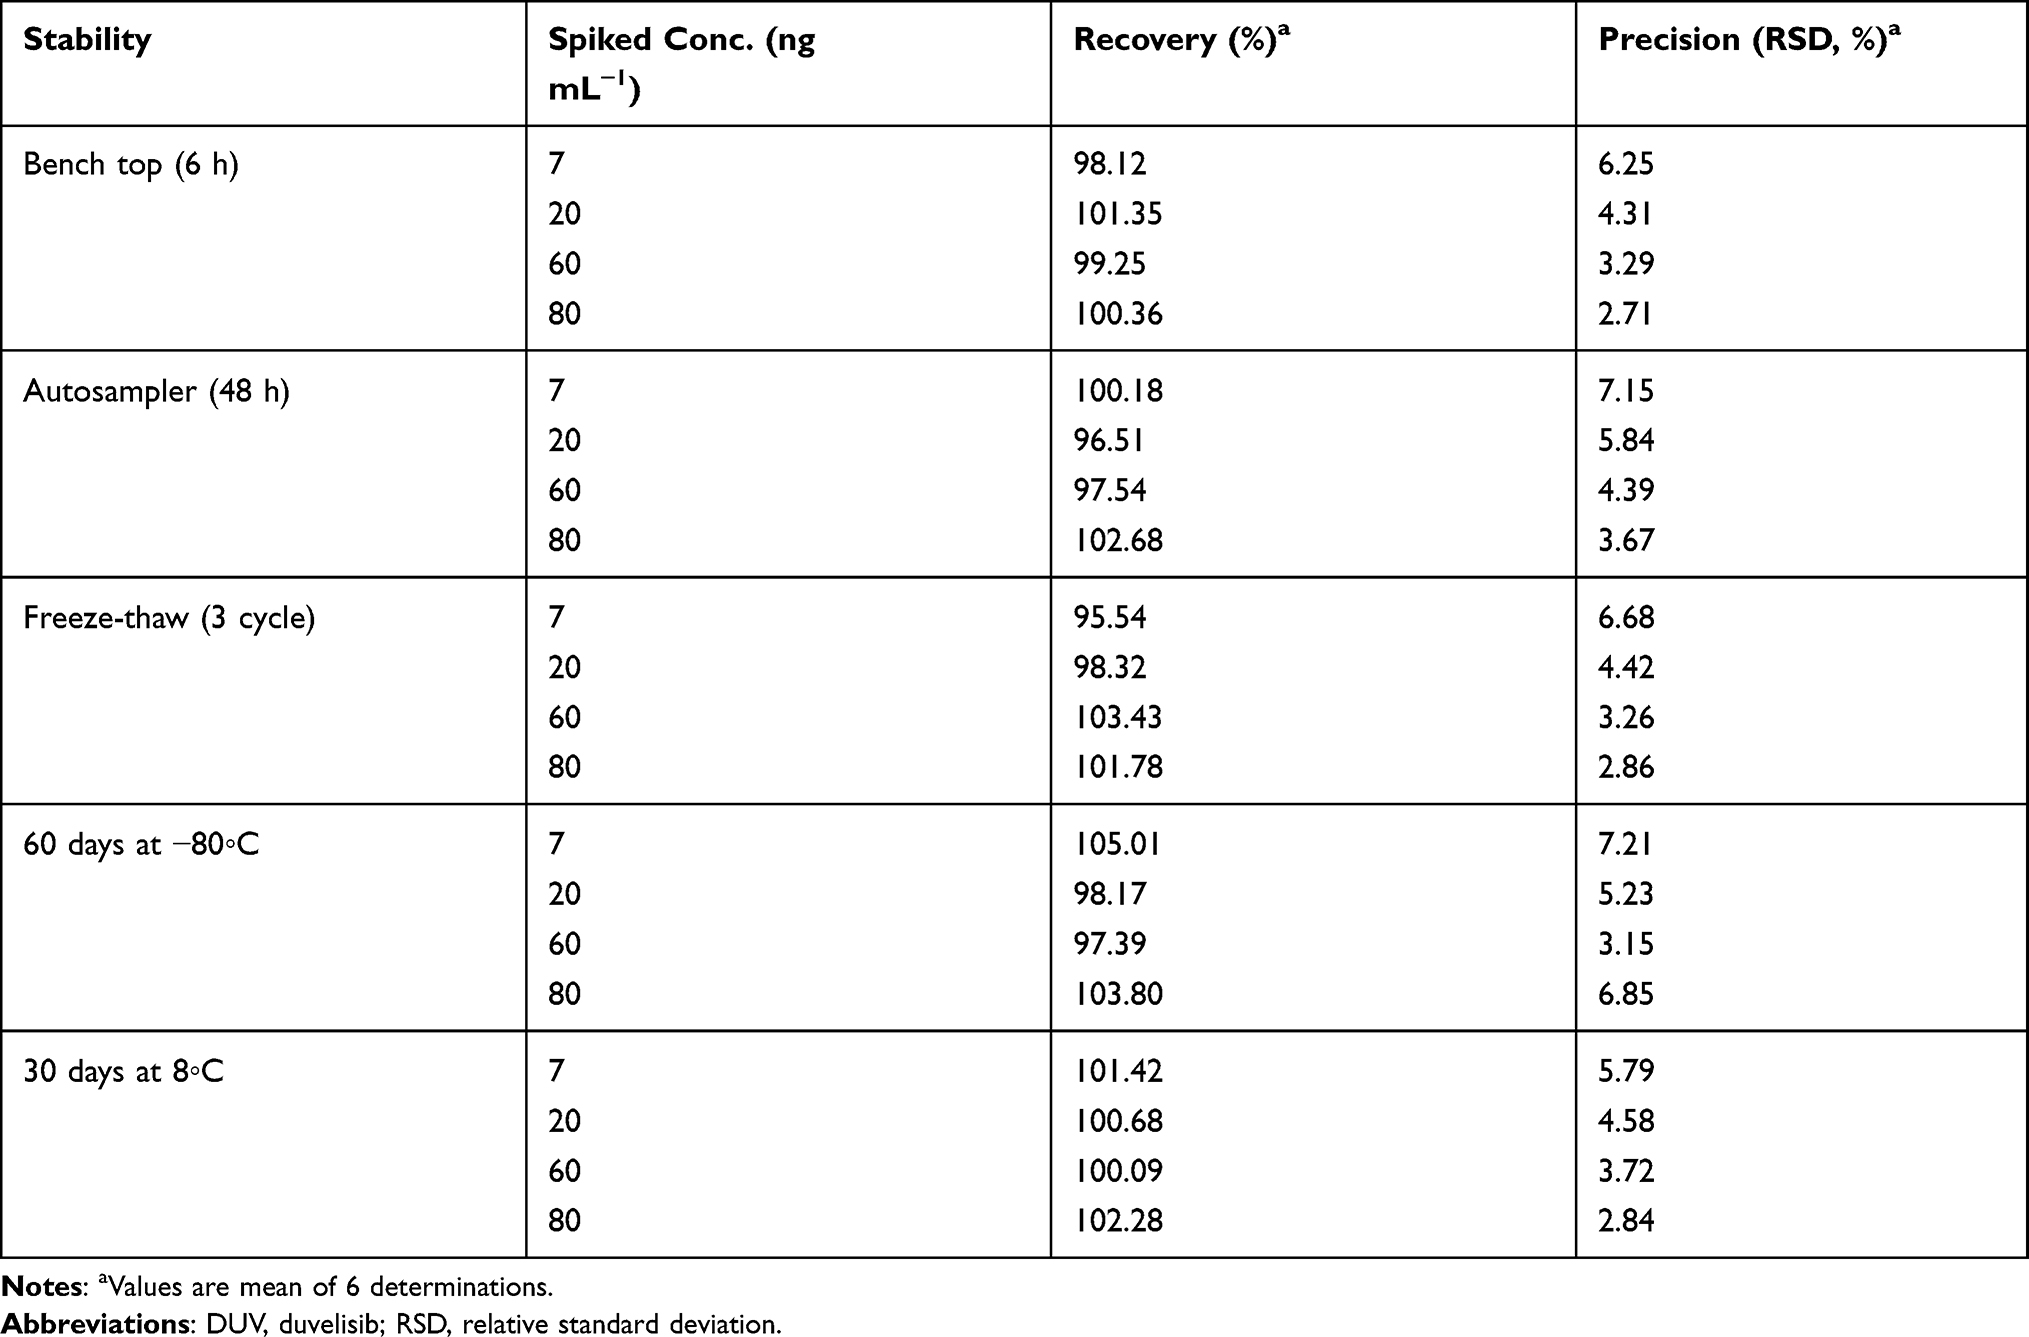 |
Table 4 Stability Data of DUV in Human Plasma |
Dilution Integrity and Matrix Effect
Plasma samples containing 10-fold high concentration of QC samples (70, 200, 600 and 800 ng mL–1) were diluted 10-fold with the mobile phase and analyzed. The results (Table 5) showed that the measured concentrations after 10-fold dilution lied within the acceptable limits for accuracy and precision, as evident from the good recovery (96.87–103.24%) and low RSD values (2.42–6.54%).
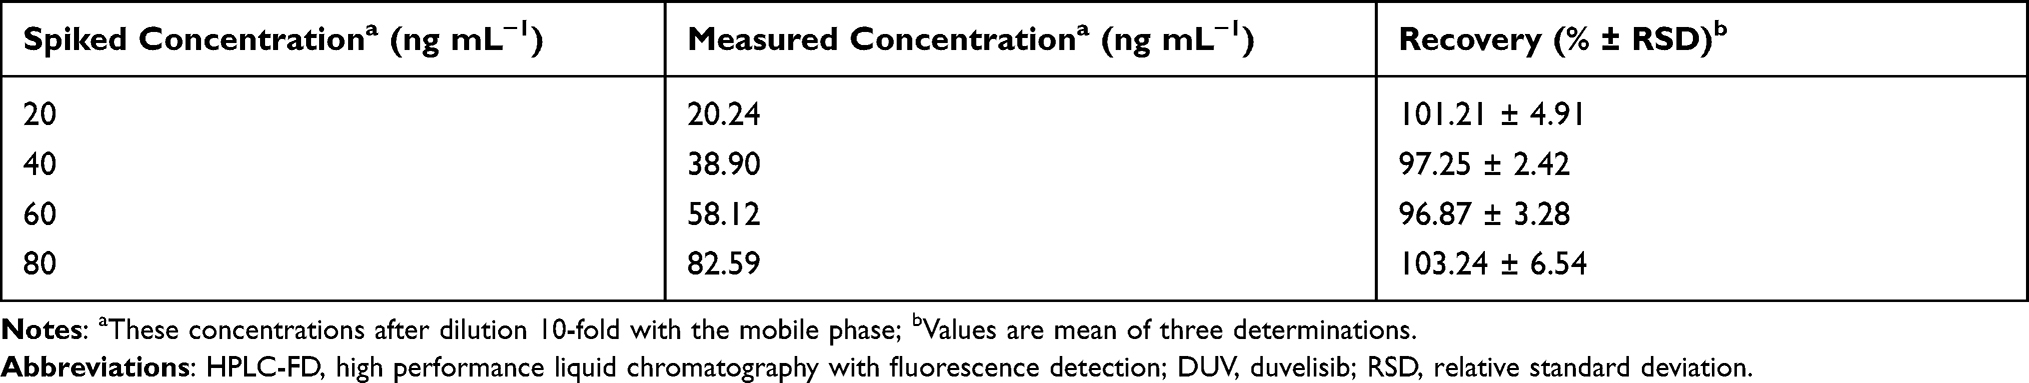 |
Table 5 Dilution and Integrity Studies of the Proposed HPLC-FD for Determination of DUV in Spiked Human Plasma Samples |
Pharmacokinetic Study in Rats
To assess the applicability of the developed HPLC-FD method for the determination of DUV in plasma samples, a pharmacokinetic study after oral administration of DUV at a dose of 25 mg/kg was conducted. Rats were selected in this study because they were proved to be the most appropriate animal model to study human biology due to their high degree of genomic and physiologic similarities to humans.27 Pharmacokinetic analyses were performed using non-compartmental analysis (NCA) with the aid of Excel 2010, PKSolver Add-In as described previously.28 The mean plasma concentration (in ng mL−1) versus time (h) profile of DUV in rats is shown in Figure 6, and the main pharmacokinetic parameters explored are summarized in Table 6.
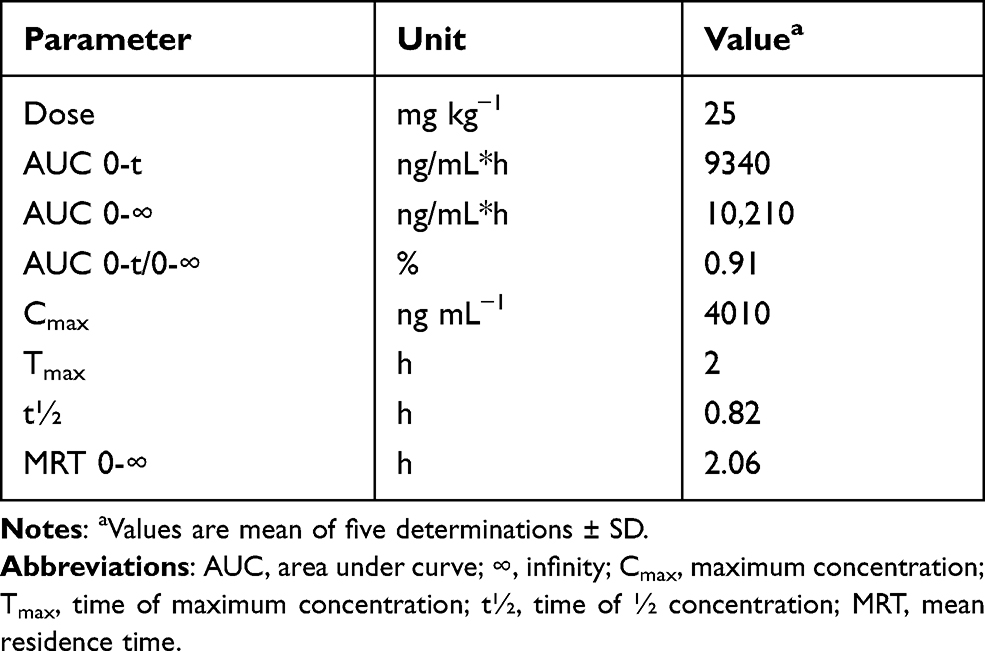 |
Table 6 The Pharmacokinetic Parameters of DUV in Rat Plasma After Oral Administration of 25 Mg/Kg |
 |
Figure 6 Concentration-time profile of DUV in rats after single oral gavage administration at a dose of 25 mg kg−1. Concentrations are means of 5 rats ± SD. |
After oral administration of DUV in rats, it was rapidly absorbed and reached maximum plasma concentration (Cmax) of 4010 ± 410 ng mL−1 after 2 h (tmax) and had an eliminated half-life (t½) of 0.82 h. The ratios of AUC (AUC0–t/AUC0-∞) were found to be 0.91%, demonstrating that the present HPLC-FD method was sensitive sufficient to cover the elimination phase of DUV. Similar drug plasma profile was observed in adult patients with advanced hematologic malignancies after oral administration of DUV as single dose of 25 mg twice daily. It was reported that DUV has a rapid absorption, with Tmax of 1 to 2 h, after administration in human.14
Conclusion
This study describes, for the first time, the development and validation of HPLC-FD method for quantitation of DUV in human plasma samples. The proposed HPLC-FD method was highly sensitive, quick, and accurate for the measurement of the concentrations of DUV in human plasma samples. This method had many advantages: the procedure of sample preparation was very simple as it did not employ liquid-liquid or solid phase extraction. It was based on only protein precipitation with methanol. The chromatographic separation was achieved using the simple isocratic elution for a short run time (10 min). The proposed HPLC-FD method is suitable for the accurate quantification of DUV in human plasma at concentrations as low as 7 ng mL−1 and has a wide linear range. This proposed novel HPLC-FD method was also successfully applied to determine the DUV concentrations in a preclinical pharmacokinetic study in rats, which were orally treated with DUV at a single dose of 25 mg/kg by lavage method. The advantages of the HPLC-FD method make it valuable for pharmacokinetic studies, bioavailability evaluation and therapeutic monitoring of DUV in human subjects after oral administration of low therapeutic DUV doses.
Abbreviations
DUV, duvelisib; PI3K, phosphoinositide 3-kinase; CLL, chronic lymphocytic leukemia; FDA, US Food and Drug Administration; HPLC, high performance liquid chromatography; FD, fluorescence detection; UPLC, ultraperformance liquid chromatography; MS/MS, tandem mass spectrometry; OLA, olaparib; IS, internal standard; ICH, The International Conference on Harmonization; LOD, limit of detection; LOQ, limit of quantification; QC, quality control; RSD, relative standard deviation; AUC, area under curve.
Ethics Statement
Human plasma was obtained from the Blood Bank of King Khalid Hospital of King Saud University (Riyadh, Saudi Arabia). Samples were collected from a healthy volunteer after receiving the consent, and the guidelines outlined in the Helsinki were followed. All procedures performed in studies involving experimental animals were in accordance with the ethical standards for conducting studies on Living Creatures at King Saud University (Riyadh, Saudi Arabia). The study, presented in this manuscript, was approved by the Research Ethics Committee (RCE) of King Saud University with Ethics Reference No: KSU‐SE‐20‐51.
Acknowledgments
The authors would like to extend their appreciation to the Deanship of Scientific Research at King Saud University for its funding of this research through the research group project No. RGP-225.
Disclosure
The authors report no conflicts of interest for this work.
References
1. Canadian Cancer Society. Chronic lymphocytic leukemia. Ontario; 2019. Available from: http://www.cancer.ca/en/cancer-information/cancer-type/leukemia-chronic-lymphocytic-cll/chronic-lymphocytic-leukemia/?region=on.
2. The American Chemical Society. Key statistics for chronic lymphocytic leukemia. Washington; 2019. Available from: https://www.cancer.org/cancer/chronic-lymphocytic-leukemia/about/key-statistics.html.
3. Kotiah SD. Chronic lymphocytic leukemia treatment protocols. New York; 2019. Available from: https://emedicine.medscape.com/article/2005390-overview.
4. Bello C, Zhang L, Naghashpour M. Follicular lymphoma: current management and future directions. Cancer Control. 2012;19(3):187–195. doi:10.1177/107327481201900303
5. Clayton E, Bardi G, Bell SE, et al. A crucial role for the p110 delta subunit of phosphatidylinositol 3-kinase in B cell development and activation. J Exp Med. 2002;196(6):753–763. doi:10.1084/jem.20020805
6. Fung-Leung WP. Phosphoinositide 3-kinase delta (PI3Kδ) in leukocyte signaling and function. Cell Signal. 2011;23(4):603–608. doi:10.1016/j.cellsig.2010.10.002
7. Peluso M, Faia K, Winkler D, et al. Duvelisib (IPI-145) inhibits malignant B-cell proliferation and disrupts signaling from the tumor microenvironment through mechanisms that are dependent on PI3K-δ and PI3K-γ. Blood. 2014;124(21):328. doi:10.1182/blood.V124.21.328.328
8. Hoellenriegel J, Meadows SA, Sivina M, et al. The phosphoinositide 30-kinase delta inhibitor, CAL-101, inhibits B-cell receptor signaling and chemokine networks in chronic lymphocytic leukemia. Blood. 2011;118(13):3603–3612. doi:10.1182/blood-2011-05-352492
9. Okkenhaug K, Bilancio A, Farjot G, et al. Impaired B and T cell antigen receptor signaling in p110 delta PI 3-kinase mutant mice. Science. 2002;297(5583):1031–1034. doi:10.1126/science.1073560
10. Vanhaesebroeck B, Guillermet-Guibert J, Graupera M, Bilanges B. The emerging mechanisms of isoform-specific PI3K signalling. Nat Rev Mol Cell Biol. 2010;11(5):329–341.
11. Faia K, White K, Proctor J, et al. The phosphoinositide-3 kinase (PI3K)-δ,γ inhibitor, duvelisib shows preclinical synergy with multiple targeted therapies in hematologic malignancies. PLoS One. 2018;13(8):1–14. doi:10.1371/journal.pone.0200725
12. Qingshan Y, Prexy M, Terry N, Christophe Q, Varsha G. Idelalisib: first-in-class PI3K delta inhibitor for the treatment of chronic lymphocytic leukemia, small lymphocytic leukemia, and follicular lymphoma. Clin Cancer Res. 2015;21(7):1537–1542. doi:10.1158/1078-0432.CCR-14-2034
13. Balakrishnan K, Peluso M, Fu M, et al. The phosphoinositide-3-kinase (PI3K)-delta and gamma inhibitor, IPI-145 (Duvelisib), overcomes signals from the PI3K/AKT/S6 pathway and promotes apoptosis in CLL. Leukemia. 2015;29(9):1811–1822. doi:10.1038/leu.2015.105
14. U.S. Food & Drug Administration (FDA). Duvelisib (Copiktra, Verastem, Inc.) for adult patients with relapsed or refractory chronic lymphocytic leukemia (CLL) or small lymphocytic lymphoma (SLL). Maryland; 2018. Available from: https://www.fda.gov/Drugs/InformationOnDrugs/ApprovedDrugs/ucm621503.htm.
15. Leah L. Duvelisib granted priority review for R/R CLL/SLL and FL. Cancer Network; 2018. Available from: https://www.cancernetwork.com/view/duvelisib-granted-priority-review-rr-cllsll-and-fl.
16. Ch S, Annapurna P, Nataraj KS, Pawar KMA. Analytical quality by design approach in RP-HPLC method development and validation for the estimation of duvelisib. Asian J Pharm Clin Res. 2021;14(2):99–108. doi:10.22159/ajpcr.2021.v14i2.40181
17. Siddesh A, Sriram D, Zakkula A, et al. Validated HPLC‐UV method for simultaneous quantification of phosphatidylinositol 3‐kinase inhibitors, copanlisib, duvelisib and idelalisib, in rat plasma: application to a pharmacokinetic study in rats. Biomed Chromtogr. 2020;35(4):e5015.
18. Nigade PB, Gundu J, Pai KS, Nemmani KVS. Prediction of tissue-to-plasma ratios of basic compounds in mice. Eur J Drug Metab Pharmacokinet. 2017;42(5):835–847. doi:10.1007/s13318-017-0402-5
19. Shao Y, Xie S, Zhu H, Du X, Xu R. Development of a novel and quick LCMS/MS method for the pharmacokinetic analysis of duvelisib in beagle dogs. J Pharm Biomed Anal. 2020;187:113355. doi:10.1016/j.jpba.2020.113355
20. The International Conference on Harmonization (ICH). Q2(R1): Validation of Analytical Procedure: Text and Methodology. Geneva: The International Conference on Harmonization (ICH); 2005.
21. Horwitz SM, Koch R, Porcu P, et al. Activity of the PI3K-δ,γ inhibitor duvelisib in a Phase 1 trial and preclinical models of T-cell lymphoma. Blood. 2018;131(8):888–898. doi:10.1182/blood-2017-08-802470
22. Blair HA. Duvelisib: first global approval. Drugs. 2018;78(17):1847–1853. doi:10.1007/s40265-018-1013-4
23. Flinn IW, Patel M, Oki Y, et al. Duvelisib, an oral dual PI3K-δ, γ inhibitor, shows clinical activity in indolent non-Hodgkin lymphoma in a phase 1 study. Am J Hematol. 2018;93(11):1311–1317. doi:10.1002/ajh.25228
24. Darwish IA, Mahmoud AM, Khalil NY. Nonextractive procedure and precolumn derivatization with 7-chloro-4-nitrobenzo-2-oxa-1,3-diazole for trace determination of trimetazidine in plasma by high-performance liquid chromatography with fluorescence detection. J AOAC Int. 2008;91(5):1037–1044. doi:10.1093/jaoac/91.5.1037
25. Darwish IA, Al-Majed AA, Mahmoud AM, Khalil NY. New nonextractive and highly sensitive high-performance liquid chromatographic method for determination of paroxetine in plasma after offline precolumn derivatization with 7-chloro-4-nitrobenzo-2-oxa-1,3-diazole. J AOAC Int. 2009;92(5):1349–1355. doi:10.1093/jaoac/92.5.1349
26. Khalil NY, Mahmoud AM, Darwish IA, Al-Majed AA. Highly sensitive HPLC method with automated co-sense system and fluorescence detection for determination of sertraline in human plasma. Chromatographia. 2010;71(9–10):825–831. doi:10.1365/s10337-010-1560-7
27. Blais EM, Rawls KD, Dougherty BV, et al. Reconciled rat and human metabolic networks for comparative toxicogenomics and biomarker predictions. Nat Commun. 2017;8:14250. doi:10.1038/ncomms14250
28. Almomen A, Maher HM, Alzoman NZ, Shehata SM, Alsubaie A. Flavoured water consumption alters pharmacokinetic parameters and increases exposure of erlotinib and gefitinib in a preclinical study using Wistar rats. Peer J. 2020;8:e9881.
 © 2021 The Author(s). This work is published and licensed by Dove Medical Press Limited. The
full terms of this license are available at https://www.dovepress.com/terms
and incorporate the Creative Commons Attribution
- Non Commercial (unported, 3.0) License.
By accessing the work you hereby accept the Terms. Non-commercial uses of the work are permitted
without any further permission from Dove Medical Press Limited, provided the work is properly
attributed. For permission for commercial use of this work, please see paragraphs 4.2 and 5 of our Terms.
© 2021 The Author(s). This work is published and licensed by Dove Medical Press Limited. The
full terms of this license are available at https://www.dovepress.com/terms
and incorporate the Creative Commons Attribution
- Non Commercial (unported, 3.0) License.
By accessing the work you hereby accept the Terms. Non-commercial uses of the work are permitted
without any further permission from Dove Medical Press Limited, provided the work is properly
attributed. For permission for commercial use of this work, please see paragraphs 4.2 and 5 of our Terms.