Back to Journals » International Journal of Nanomedicine » Volume 14
A highly sensitive biosensor based on Au NPs/rGO-PAMAM-Fc nanomaterials for detection of cholesterol
Authors Zhu J ![]() , Ye Z, Fan X, Wang H, Wang Z
, Ye Z, Fan X, Wang H, Wang Z ![]() , Chen B
, Chen B
Received 15 August 2018
Accepted for publication 12 December 2018
Published 25 January 2019 Volume 2019:14 Pages 835—849
DOI https://doi.org/10.2147/IJN.S184013
Checked for plagiarism Yes
Review by Single anonymous peer review
Peer reviewer comments 2
Editor who approved publication: Professor Lei Yang
Jianmeng Zhu,1 Zhilu Ye,1 Xiaoying Fan,1 Hongqin Wang,1 Zhen Wang,1,2 Bingyu Chen1,2
1Department of Clinical Laboratory, Chun’an First People’s Hospital (Zhejiang Provincial People’s Hospital Chun’an Branch), Hangzhou, Zhejiang, China; 2Department of Blood Transfusion, Zhejiang Provincial People’s Hospital, People’s Hospital of Hangzhou Medical College, Hangzhou, Zhejiang, China
Objective: This study aimed to construct a biosensor using Au nanoparticles (Au NPs) and reduced graphene-polyamide-amine-ferrocene (rGO-PAMAM-Fc) nanomaterials designed for rapid and sensitive detection of cholesterol.
Materials and methods: In this study, a highly sensitive biosensor based on Au NPs/rGO-PAMAM-Fc nanomaterials was manufactured for detection of cholesterol. The rGO-PAMAM-Fc and Au NPs were modified on the surface of the electrode and then coated with cholesterol oxidase (ChOx) and cholesterol esterase (ChEt) to develop the ChOx&ChEt/Au NPs/rGO-PAMAM-Fc biosensor.
Results: The capability of rGO-PAMAM-Fc nanomaterials in fabricating a more efficient biosensor was validated through stability, selectivity and reproducibility checks. Under optimal conditions, the newly developed biosensor showed a linear relationship with logarithm of cholesterol concentration from 0.0004 to 15.36 mM (R2=0.9986), and a low detection limit of 2 nM was obtained at the signal/noise ratio of 3.
Conclusion: The ChOx&ChEt/Au NPs/rGO-PAMAM-Fc biosensor was successfully applied for the measurement of cholesterol in human serum, which implies that the biosensor has a potential application in clinical diagnostics.
Keywords: diagnostics, graphene, polyamide-amine, ferrocene, Au nanoparticles
Introduction
Cholesterol is the most abundant steroid in the body, mainly found in the brain and muscle. It acts as an essential raw material in the synthesis of adrenal cortex hormones and sex hormones and plays an important role in strengthening and maintaining of blood vessels.1–4 A large body of medical data indicates that high cholesterol (based upon the cut-off of 120–260 mg/dL total cholesterol) is significantly related to peripheral vascular disease and coronary heart disease, and it has become a significant clinical parameter.5–7 Therefore, it is necessary to have a constant monitoring of cholesterol for medical screening or diagnosis. Methods of measurement of cholesterol have been reported, including colorimetric,8 spectrophotometric,9 HPLC10 and electrochemical methods.11 Among these, electrochemical biosensors have been a particularly promising means of detection because of the advantages of their excellent specificity and selectivity,12 low fabrication cost and operational simplicity.13 Thus, developing and utilizing highly sensitive, low-cost and biocompatible cholesterol biosensors for the measurement of cholesterol may have a significant influence on clinical diagnostics.14
Nanomaterials have attracted great attention in the field of sensing for improving the performance of biosensors, which can provide high surface areas for loading of enzymatic molecules and help them to retain bioactivity in the compatible microenvironment. Graphene comprising SP2 hybrid carbon atoms and forming covalent bonds, is a two-dimensional honeycomb-like lattice-structured nanomaterial,15–17 which makes it a perfect material, with good biocompatibility (non-toxic effect), high surface area, zero band gap and extra high electrical conductivity, for biosensors.18–20 Reduced graphene oxide (rGO), generated through the deoxidization of graphene, has a lot of functional groups such as hydroxyl and carboxyl groups, which make it eligible for more considerable chemical interactions.21
Polyamideamine (PAMAM) has a specific three-dimensional structure with highly branched and dendritic macromolecules that contain active functional groups.22–24 Increased number of terminal functional groups can be achieved by modifying the end of the functional groups with different dendrimers.25,26 PAMAM dendrimers have advantages of no immunogenicity, no toxicity at the dosages used and high efficiency of transporting bioactive agents, which make it a macromolecule of significant value as gene carriers, drug carriers, magnetic resonance contrast agents and in sensing. Dendrimers, containing different functional groups, can usually used to modify the electrode surface using polymer cross-linking.27 PAMAM dendrimers reduce the conductivity of the electrode surface, which limits their extensive application in the biosensors. To overcome this limitation, various nanomaterials including Au nanoparticles (NPs), Pt NPs, graphene oxide (GO) and multi-walled carbon nanotube have been immobilized on the surface of the dendrimer.28–30
Ferrocene (Fc) with its derivatives is a kind of electronic mediator with excellent performance, which is widely used in the construction of highly sensitive biosensor.31,32 Bai et al15 developed a electrochemical biosensor based on Fc-modified nanohybrids for the detection of hydrogen peroxide, which shows outstanding catalytic ability in detecting hydrogen peroxide.
The objective of our work was to fabricate a biosensor (based on Au NPs and rGO-polyamide-amine-Fc nanomaterials), which is highly sensitive in detecting cholesterol. Au NP was selected for the fabrication of electron conduction fibers, and it can bind to a variety of biomacromolecules without affecting their biological activity. Fc molecules, acting as electron mediators, were imploded into the sensor by grafting on PAMAM. The rGO enhances the electrical conductivity of the film, which can synergistically promote electronic transfer with Fc, improving the sensitivity of the prepared biosensor. In order to validate this approach, different concentrations of cholesterol and some human serum sample were used for detection and some interfering species was assessed by investigating selectivity of the biosensor.
In this study, a novel biosensor based on Au NPs/rGO-PAMAM-Fc was fabricated for cholesterol determination. The prepared rGO-PAMAM-Fc nanomaterials were immobilized on the electrode, which can increase the amount of effective enzyme-binding sites and enhance electron conductivity. Au NPs were electrodeposited on the surface of rGO-PAMAM-Fc. Cholesterol oxidase (ChOx) and cholesterol esterase (ChEt) were immobilized on the surface of Au NPs/rGO-PAMAM-Fc electrode. Through cooperation of the two enzymes, as well as the synergic effect of Au NPs and rGO-PAMAM-Fc nanomaterials, improved sensitivity and stability of the sensor for the measurement of cholesterol were achieved. Under optimal conditions, the ChOx&ChEt/Au NPs/rGO-PAMAM-Fc biosensor exhibited an excellent linear response to cholesterol and low detection limit.
Materials and methods
Reagents
ChOx (EC 1.1.3.6, ≥50 units/mg, from Brevibacterium sp.), ChEt (EC 3.1.1.13, ≥100 units/mg, from Pseudomonas sp.), cholesterol (C27H46O, molecular weight [MW]: 386.67, ≥99% purity, from lanolin), Triton X-100 (C34H62O11, MW: 646.85), N-hydroxy succinimide (NHS) and N-(3-dimethylaminopropyl)-N-ethyl-carbodiimide hydrochloride (EDC) were purchased from Sigma-Aldrich (St Louis, MO, USA). GO was obtained from XFNANO Materials Tech Co., Ltd (Nanjing, China). Mercaptoethylamine, gold chloride (HAuCl4), Fc carboxylic acid, uric acid and glucose were obtained from Sigma-Aldrich. All other reagents were of analytical grade. Ultra-pure water of 18.2 MΩ was used to prepare all solutions.
Ten milligrams of cholesterol was put into the mixture solution of 10 mL isopropanol and 10 mL Triton X-100. The mixture solution was redispersed in 30 mL glycine buffer solution (0.1 mol/L, pH 8.0) and stored at 4°C for future use.
Instruments
The morphologies and surface structures were characterized using atomic force microscope (AFM; Veeco, Wood bury, NY, USA) and scanning electron microscope (SEM; JSM-6700; JSM Ltd, Tokyo, Japan). Raman spectra were obtained on a Raman microscope (Thermo Fisher Scientific, Waltham, MA, USA). Fourier transform infrared (FT-IR) spectra were measured on an FT-IR spectrometer (Bruker Optik GmbH, Ettlingen, Germany). 1H-nuclear magnetic resonance (1H-NMR) spectra were recorded on a Varian Mercury-Plus 400 spectrometer.
Electrochemical measurements were carried out on the CHI 660 electrochemical workstation. A conventional three-electrode system was used with modified gold electrode (GE) as the working electrode, platinum electrode as the auxiliary electrode and saturated calomel electrode as the reference electrode. Linear sweep voltammetry (LSV) was performed in 0.1 M HNO3 solution containing 0.6 M KNO3 from −0.2 to 0.6 V with 100 mV/s scanning rate. Cyclic voltammetry (CV) and electrochemical impedance spectroscopy (EIS) were carried out in PBS containing 5 mM [Fe(CN)6]3−/4−. Amperometric i–t curve was carried out in 0.01% stirring HAuCl4 solution under the potential of −0.8 V.
Preparation of rGO-PAMAM-Fc nanomaterials
GO was synthesized by Hummer’s method.33 Briefly, GO was sonicated for 4 hours and then 3 μL hydrazine was injected into 1 mL of the GO suspension (1 mg/mL) and shaken for 10 minutes vigorously. Subsequently, the mixed solution was incubated for 4 hours in a water bath at 60°C and centrifuged for 10 minutes at 25,000 rpm and the supernatant was removed.15 Finally, the precipitate of rGO obtained was redispersed to form 1 mg/mL rGO solution.
PAMAM dendrimers were synthesized using the divergent method.34 The addition of ethylenediamine to the initial nucleus and methyl acrylate was carried out by Michael addition reaction. The formation of 0.5 generation PAMAM dendrimer was followed by amidation with excess ethylenediamine to obtain 1.0 generation PAMAM dendrimer. Then, the above two reaction steps were repeated to obtain algebraically increasing levels of PAMAM dendritic molecules. The concrete experimental steps for the synthesis of PAMAM dendrimers are as follows: 2 g ethylenediamine was dissolved in 200 mL anhydrous methanol in three burners and filled with nitrogen for deoxidation. Then it was added dropwise to 28.39 g methyl acrylate at a rate of 1 drop/s stirring continuously for 24 hours. The solvent or monomer was removed by distillation under reduced pressure to obtain G 0.5 PAMAM dendrimers. Then 4.68 g of the above substances was dissolved in 100 mL anhydrous methanol and added dropwise to 14.69 g ethylenediamine methanol solution at a rate of 1 drop/s with stirring for 24 hours. The methanol and excess ethylenediamine were removed by distillation under reduced pressure to obtain the G1.0 PAMAM dendrimers. The above-mentioned steps for the reaction process were repeated to obtain G 5.0 PAMAM dendrimers.
The rGO-PAMAM-Fc nanomaterials were prepared by the following procedure: 1 mL of 0.5 mg/mL PAMAM, 0.2 mg Fc acid and 1 mL of 1 mg/mL rGO solution were added to 8 mL water. Then 50 mM EDC and NHS were added into the above solution and stirred for 24 hours. The mixture was centrifuged to remove the supernatant and the precipitates were washed thrice. The nanomaterials were redispersed in 5 mL of double-distilled water and stored at 4°C for future use.
Fabrication of cholesterol biosensor
To fabricate the detection electrode, first, bare GEs (3 mm in diameter) were polished with 0.3 and 0.05 μm alumina powder and were sonicated for 3 minutes each by deionized water and ethanol. The electrodes were scanned in 0.5 M H2SO4 solution to activate the surface by CV. Twenty microliters of 15 μM of mercaptoethylamine was added dropwise on the electrodes at 4°C overnight to obtain a functional amino groups. The electrodes were washed thrice with 0.1 M PBS and then soaked in 2.5% glutaraldehyde for 10 minutes. After rinsing with 0.1 M PBS, 20 μL rGO-PAMAM-Fc nanomaterials were casted onto the electrode surface and incubated at 37°C for 30 minutes. Electrodes were washed thrice with PBS and immersed in glutaraldehyde for 10 minutes; 20 μL of rGO-PAMAM-Fc was dropped on the electrode again and then rinsed with 0.1 M PBS. These procedures were cycled for several times. Subsequently, the electrodes were dipped into 5 mL of 0.01% HAuCl4 solution and Au NPs were deposited by amperometry at −0.8 V with the scanning rate of 100 mV/s. Electrodes were immersed in the glutaraldehyde solution for 10 minutes and then washed with 0.1 M PBS; 10 μL of ChOx and ChEt (2 mg/mL) were immobilized on the Au NPs/rGO-PAMAM-Fc electrode surface. Finally, the electrodes were rinsed with PBS to remove unattached enzymes. The optimization studies were performed to investigate the optimized parameters (ie, Ag+ concentration, the layer number of rGO-PAMAM-Fc on the surface of GE, reaction time, deposition temperature) for high-performance cholesterol biosensor fabrication. Thus, electrochemical biosensor based on the ChOx&ChEt/Au NPs/rGO-PAMAM-Fc came into being.
Detection of cholesterol with biosensor
The ChOx&ChEt/Au NPs/rGO-PAMAM-Fc electrodes were incubated in glycine buffer solution containing AgNO3 and different concentrations of cholesterol for 10 minutes at 37°C. Electrodes were rinsed thrice with PBS and the current response of cholesterol was recorded by LSV at a potential ranging from −0.2 to 0.8 V with the scanning rate of 100 mV/s in 5 mL KNO3 (0.6 M) solution containing HNO3 (0.1 M).
Exploration of the selectivity of the biosensor
The selectivity of the cholesterol biosensor was investigated with estradiol, glucose, ascorbic acid and uric acid instead of cholesterol. The current response signals of the enzymatic silver deposition were recorded.
Statistical analysis
The results are presented as means and SD. For statistical evaluation, independent t-test was used for comparison between groups. GraphPad Prism software version 6.0 (GraphPad Software, Inc., La Jolla, CA, USA) was used for data analysis. P-values <0.05 were considered as statistically significant. Least significant difference, Student–Newman–Keuls and Bonferroni post hoc tests were used.
Results and discussion
Principle of ChOx&ChEt/Au NPs/rGO-PAMAM-Fc biosensor
The fabrication procedure of cholesterol biosensor is illustrated in Scheme 1. The process can be summarized in four steps. Firstly, rGO-PAMAM-Fc nanomaterials were synthesized by amide reaction, in which −NH2 in PAMAM conjugated with −COOH in rGO and Fc by EDC/NHS. In the rGO-PAMAM-Fc nanomaterials, Fc molecules acted as the electron mediators to promote electron transfer and rGO acted as the enhancers for increasing the electrical conductivity. At the same time, PAMAM could provide a large number of attachment sites for the enzyme. Secondly, mercaptoethylamine (MEA) was used to modifiy the surface of bare electrode by the self-assembly. The rGO-PAMAM-Fc nanomaterials were cross-linked and immobilized on the electrode modified with MEA by the amide reaction and the process was cycled for several times. Thirdly, Au NPs were deposited on the above electrode. Fourthly, ChOx and ChEt were immobilized on the Au NPs/ rGO-PAMAM-Fc-modified electrode surface. Finally, 5 μL of 0.5 wt% nafion solution was added dropwise onto the electrode surface to prevent possible enzyme leakage and eliminate foreign interferences.35 Measurement of cholesterol was based on the following reaction catalyzed by ChEt and ChOx.
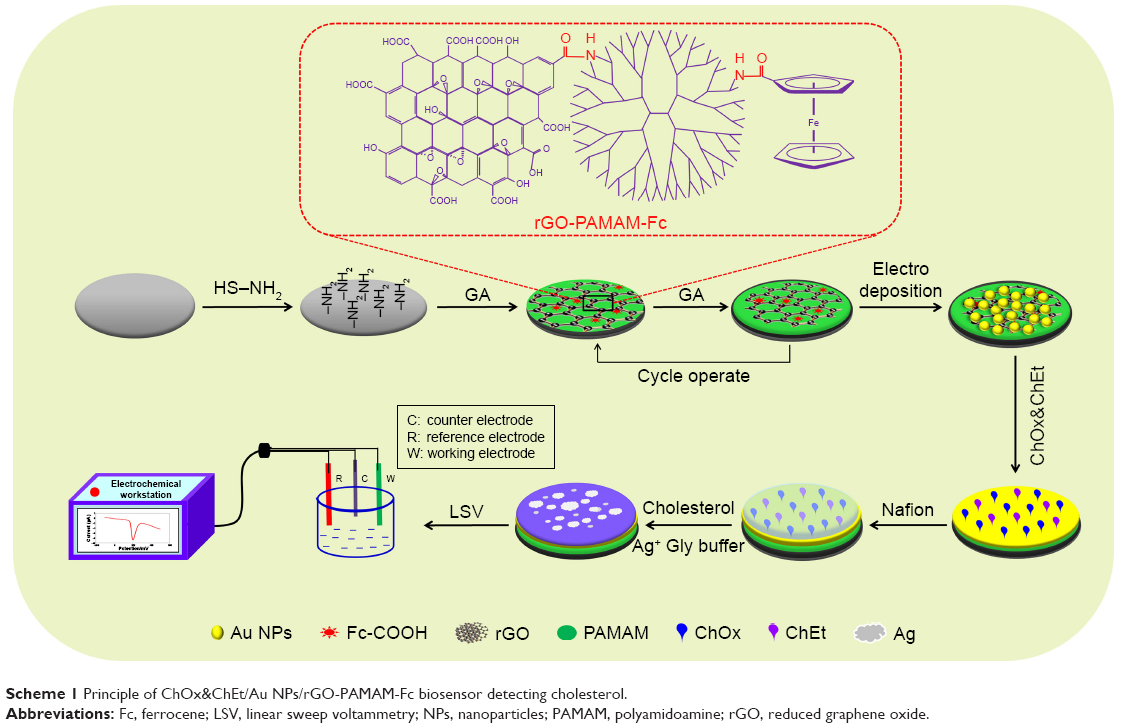 | Scheme 1 Principle of ChOx&ChEt/Au NPs/rGO-PAMAM-Fc biosensor detecting cholesterol. |
Cholesterol is oxidized to cholest-4-en-3-one by the flavin cofactor. The reduced cofactor is recycled by oxygen to produce H2O2,36 and then the Ag ions in glycine solution are reduced into metallic Ag. Detection of the enzymatically deposited Ag is achieved by anodic stripping voltammetry. Thus, ChOx&ChEt/Au NPs/rGO-PAMAM-Fc/GE can be applied for the measurement of cholesterol levels.
Characterization of rGO-PAMAM-Fc nanomaterials
The rGO-PAMAM-Fc nanomaterials were characterized with Raman spectra, AFM, ultraviolet (UV)–vis, FT-IR and so on. Figure 1A shows the 1H NMR spectrum of PAMAM materials. The characteristic peaks at 3.17, 2.64, 2.53 and 2.19 ppm represent CH2CH2NH2, NCH2, CH2CONH and NH2, respectively. This result implied that PAMAM (Generation 5) had been successfully synthesized.
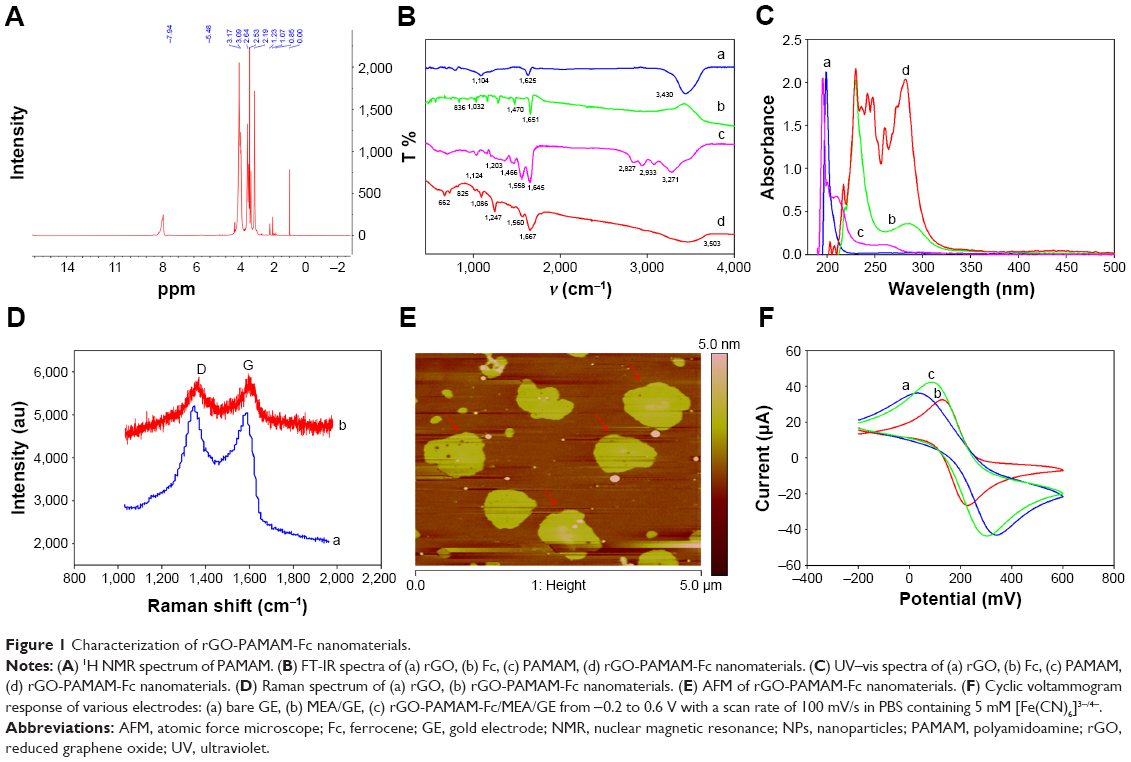 | Figure 1 Characterization of rGO-PAMAM-Fc nanomaterials. |
Figure 1B depicts the FT-IR spectrum of rGO (curve a), Fc (curve b), PAMAM (curve c) and rGO-PAMAM-Fc nanomaterials (curve d). In curve a, the peak at 1,625 cm−1 is the stretching of C=C and at 3,430 cm−1 is a stretching vibration of OH. In curve b, the peaks at 836 and 1,032 cm−1 are the characteristic of Fc ring and the peak at 1,651 cm−1 displays the antisymmetric COO− vibrations. In the FT-IR spectra of PAMAM (curve c), the peak at 3,271 cm−1 is a stretching vibration peak of −NH2; two groups of absorption peaks appear at 2,933 and 2,827 cm−1, which are asymmetric stretching vibration and symmetrical stretching vibration of −CH2−; the peaks at 1,645 and 1,558 cm−1 are the characteristic absorption peaks of the amide groups, which are caused by the carbonyl stretching vibration and the bending vibration of −CONH− and the stretching vibration of C−N bond, respectively; 1,203 and 1,124 cm−1 are the peaks caused by the stretching vibration of primary and tertiary amines, respectively. In the curve d, 825 cm−1 is indexed to Fc ring vibration, the peaks at 1,560 and 1,247 cm−1 can be attributed to N−H and C−O vibration and the peak at 1,667 cm−1 can be regarded as the CO−NH group. These results indicated that rGO-PAMAM-Fc nanomaterials had been successfully synthesized. Figure 1C depicts the UV–vis spectra of rGO (curve a), Fc (curve b), PAMAM (curve c) and rGO-PAMAM-Fc nanomaterials (curve d), which also implied that rGO-PAMAM-Fc nanomaterials had been successfully synthesized.
Figure 1D shows the Raman spectrum of rGO (curve a) and rGO-PAMAM-Fc nanomaterials (curve b). The two characteristic peaks at 1,348 and 1,592 cm−1 of rGO and rGO-PAMAM-Fc nanomaterials, respectively, represent the defects induced by the D band and G band of carbon lattice,13 respectively. The intensity ratio of the D band to the G band (D/G) of rGO-PAMAM-Fc was almost as high as that of rGO, which implied that the oxygen-containing functional groups of rGO in rGO-PAMAM-Fc showed no change.
AFM images of rGO-PAMAM-Fc nanomaterials immobilized on the gold substrate are shown in Figure 1E. The image of rGO-PAMAM-Fc nanomaterials shows flakes on the electrode surface and the size of the flakes is about 5 nm.
Electrochemical behavior of rGO-PAMAM-Fc nanomaterials was evaluated by CV in [Fe(CN)6]3−/4− (Figure 1F). A pair of reversible redox peaks of the bare electrode is clearly found in curve a (blue curve). When the electrode was modified with MEA, the redox current declined as MEA prevented the electron transfer (curve b, red curve). Because MEA is a non-conductive substance which blocks the conduction of electrons, the current reduced. The reversible redox peak of rGO-PAMAM-Fc/MEA/GE was higher than the bare GE (curve c, green curve), which was due to the synergistic conductivity of reduced graphene and Fc. When electrons were transferred to the bio-composite film, the rGO of rGO-PAMAM-Fc nanomaterial increased the electrical conductivity and promoted electron transfer of the incorporated electroactive Fc mediators, improving the conductivity ability of the electrons. These results imply that rGO-PAMAM-Fc nanomaterials had excellent conductivity ability. According to the Randled−Sevcik equation, Ip=2.69×10⁵ AD1/2n3/2γ1/2C, where A represents the electroactive surface area (cm2), D the diffusion coefficient of the molecule in solution (6.70±0.02×10⁻⁶ cm2/s), n the number of electrons participating in the redox reaction (for [Fe(CN)6]3−/4−, n=1), γ the scan rate of the potential perturbation (V/s) and C is the bulk concentration of the redox probe (mol/cm3). The effective surface areas of electrodes with various modifications were calculated in the order MEA/GE (0.0117 cm2) < bare GE (0.012 cm2) < rGO-PAMAM-Fc/GE (0.0134 cm2), indicating that rGO-PAMAM-Fc nanomaterials could enlarge the effective surface area of the electrodes.
Electrochemical behaviors of the biosensor
Figure 2A presents the CV of the bare electrode and modified electrode in 0.1 M PBS containing 5 mmol/L [Fe(CN)6]3−/4−. Current response of bare electrode, MEA-modified elecand nanocomposites based on rGO-PAMAM-Fc, respectively. The bare electrode showed a quasi-reversible redox reaction, and the redox peak current of the electrode modified with MEA decreased because of the non-conductivity of MEA. The redox peak current of rGO-PAMAM-Fc/GE increased. This may be attributed to the formation of rGO-PAMAM-Fc film on the modified electrode, which indicated rGO-PAMAM-Fc possessed excellent conductivity. After Au NPs deposition on the modified electrode surface, the peak current increased due to the increase in effective surface area of the electrode. When ChOx and ChEt were immobilized on Au NPs/rGO-PAMAM-Fc/GE, the current decreased, which may be on account of the macromolecule enzyme blocking the charge transfer of the redox probe. Under the effect of ChEt and ChOx, the cholesterol on the ChOx&ChEt/Au NPs/rGO-PAMAM-Fc/GE disintegrated and produced H2O2. At the same time, H2O2 reduced the silver ions to metallic silver, which was the reason for the increase in redox peak current.
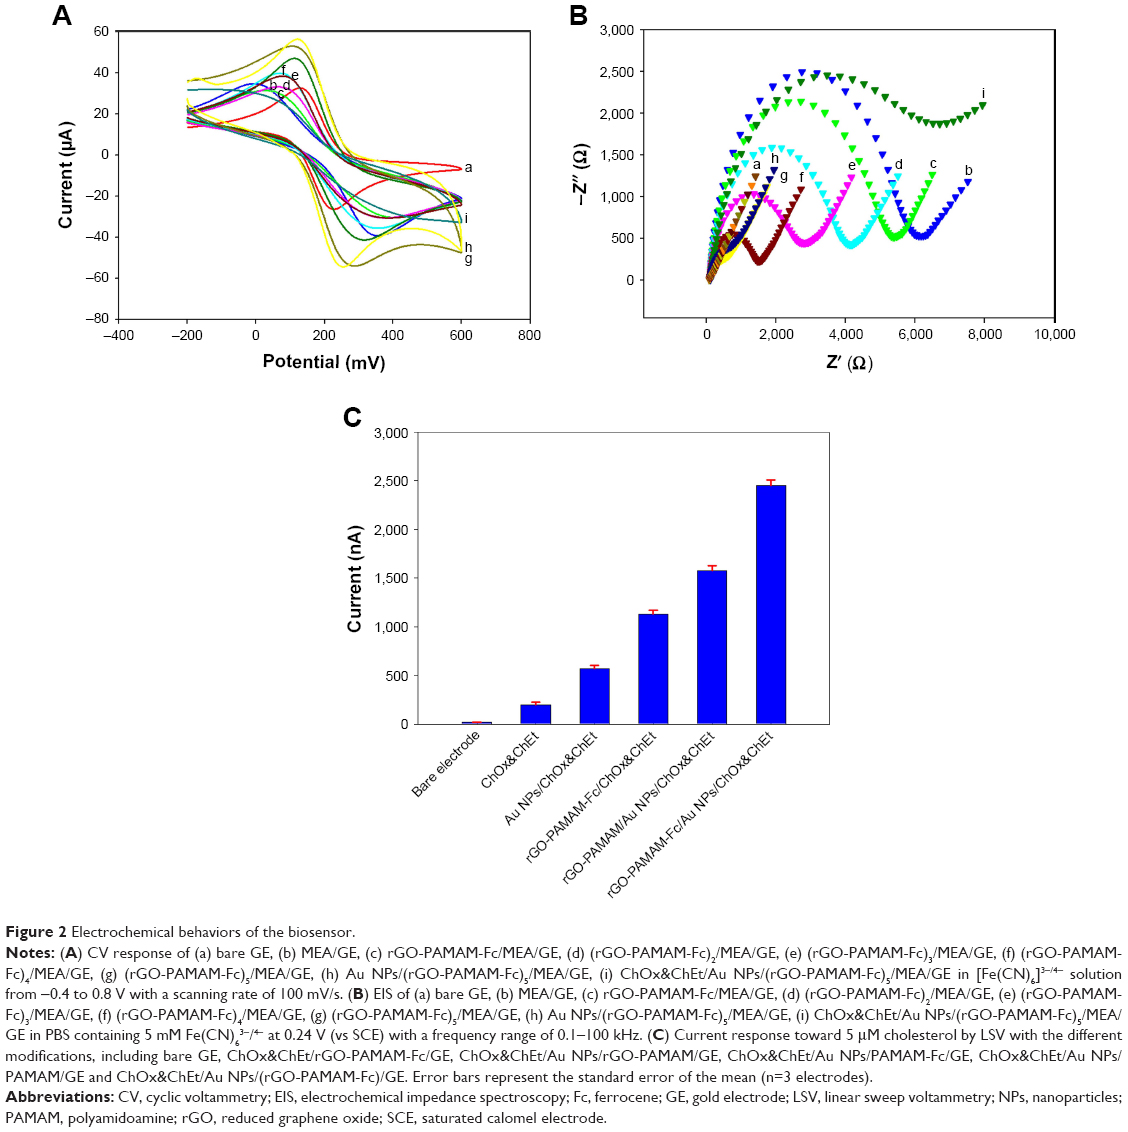 | Figure 2 Electrochemical behaviors of the biosensor. |
EIS was widely used for exploring the electron transfer kinetics, which was carried out to probe the different stages of modification of electrode surface. The results are shown in Figure 2B. The resistance value of bare GE was 220 Ω (curve a). When MEA was absorbed on the surface electrode, the resistance increased to 6,020 Ω (curve b). After the rGO-PAMAM-Fc nanomaterials were modified on the electrode, the resistance decreased to 5,160 Ω (curve c). On further increasing in the number of rGO-PAMAM-Fc nanomaterials, the resistance values changed to 4,030 Ω (curve d), 2,850 Ω (curve e) and 1,630 Ω (curve f), which indicated that rGO-PAMAM-Fc nanomaterials had an excellent electrical conductivity. When the Au NPs were deposited on the surface of rGO-PAMAM-Fc, the resistance decreased to 680 Ω (curve g). When ChOx and ChEt were immobilized on the electrode, the resistance increased to 7,480 Ω, which was due to the non-conductivity of the enzyme (curve i). After the deposition reaction occurred on ChOx&ChEt/Au NPs/rGO-PAMAM-Fc/GE, the resistance decreased to 520 Ω, which was due to the good electrical conductivity of the elemental Ag.
Figure 2C shows the current response of ChOx&ChEt/Au NPs/rGO-PAMAM-Fc/GE for the detection of cholesterol. When 5 μM cholesterol was added in glycine buffer containing AgNO3, it is apparent that ChOx&ChEt/Au NPs/rGO-PAMAM-Fc/GE exhibited enhanced anodic stripping Ag response for the detection of cholesterol. Compared with the different modifications, including bare GE, ChOx&ChEt/rGO-PAMAM-Fc/GE, ChOx&ChEt/Au NPs/rGO-PAMAM/GE, ChOx&ChEt/Au NPs/PAMAM-Fc/GE and ChOx&ChEt/Au NPs/PAMAM/GE, the anodic stripping current of the control electrode was significantly lower than that of ChOx&ChEt /Au NPs/rGO-PAMAM-Fc/GE.
Characterization of the ChOx&ChEt/Au NPs/rGO-PAMAM-Fc biosensor
SEM technique was used to verify the construction procedure of the biosensor. SEM images of morphology of the electrodes modified with different nanomaterials are presented in Figure 3. The image of bare GE is uniformly dark (Figure 3A). The image of rGO-PAMAM-Fc nanomaterials shows a homogeneous surface and exhibits a sheet-like structure (Figure 3B). After Au NPs were deposited on the rGO-PAMAM-Fc film, numerous flower-like particles appeared on the surface of the electrode (Figure 3C). The image of ChOx&ChEt/Au NPs/rGO-PAMAM-Fc/GE shows a smoothing effect as compared with Au NPs/rGO-PAMAM-Fc/GE. Au particles disappeared and random cloud-like structure displayed, which might be due to ChEt and ChOx filling the interstitial places between Au NPs. This indicates that the enzymes were immobilized on Au NPs/rGO-PAMAM-Fc/GE surface (Figure 3D). After enzymatic silver deposition, lots of white flaky silver could be clearly seen on the surface of ChOx&ChEt/Au NPs/rGO-PAMAM-Fc/GE (Figure 3E). Energy dispersive spectrometer analysis was carried out to characterize the reaction of silver deposition and verify the existence of the element Ag, which generated by the reduction of silver ions with catalysis of ChOx and ChEt (Figure 3F).
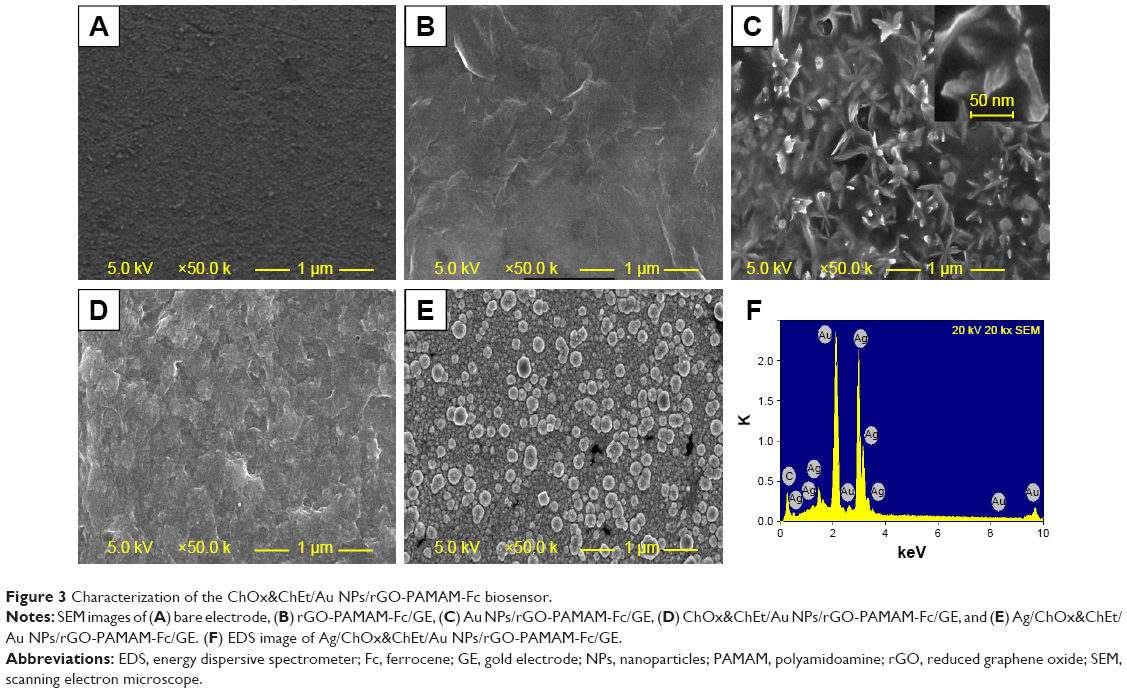 | Figure 3 Characterization of the ChOx&ChEt/Au NPs/rGO-PAMAM-Fc biosensor. |
Chronocoulometric results from the reduction of 5 mM [Fe(CN)6]3−/4− obtained from different electrodes were used to compare the apparent electrode areas with the following equation:37
|
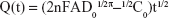
where Q(t) represents the absolute value of the reduction charge, n the number of electrons transferred, F the Faraday constant, A the apparent electrode area, t is time and D0 and C0 represent the diffusion coefficient and the bulk concentration of the oxidized form of the hexacyanoferrate (III) complex, respectively. Here A can be estimated from the slope of the Q(t) vs t1/2 plot.38 Thus, the order of the slope values was: Au NPs/rGO-PAMAM-Fc/GE (c) > rGO-PAMAM-Fc/GE (b) > GE (a), indicating that Au NPs/rGO-PAMAM-Fc can enlarge the apparent electrode area (Figure 4A). As it is known, Au NPs have a large specific surface area and excellent electrical conductivity; after the Au NPs were deposited on rGO-PAMAM-Fc/GE, the conductivity of the electrode became obviously higher than that of rGO-PAMAM-Fc/GE. So, the nanomaterials of Au NPs/rGO-PAMAM-Fc had a better effect on the developed biosensor.
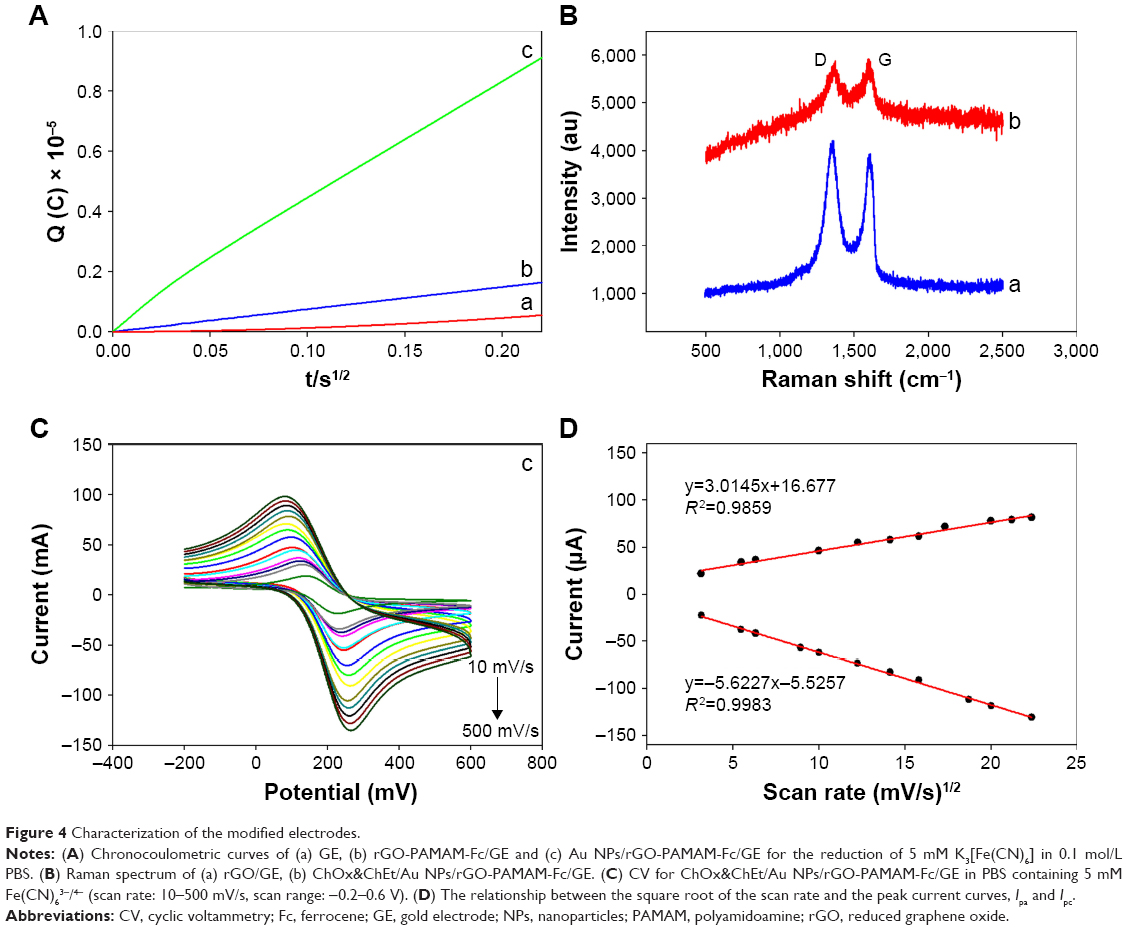 | Figure 4 Characterization of the modified electrodes. |
Raman spectra of rGO/GE (curve a) and ChOx&ChEt/Au NPs/rGO-PAMAM-Fc/GE (curve b) are shown in Figure 4B. The peaks of D-band and G-band of ChOx&ChEt/Au NPs/rGO-PAMAM-Fc/GE are clearly seen, which indicate that the biosensor was formed successfully. The graphene of the composite material is lesser than the graphene directly modified on the surface of the electrode, so the Raman spectra intensity of rGO/GE is higher than that of ChOx&ChEt/Au NPs/rGO-PAMAM-Fc/GE.
Figure 4C shows the CV for ChOx&ChEt/Au NPs/rGO-PAMAM-Fc/GE at scan rates from 10 to 500 mV/s. Both the cathodic and anodic peak currents (Ipc and Ipa, respectively) were linearly related to the square root of the scan rate (Figure 4D), with the linear regression equations Ipa (μA)=3.0145v1/2+16.677 (mV/s, R2=0.9859) and Ipc (μA)=5.6227 39.47v1/2−5.5257 (mV/s, R2=0.9983). The results indicate that the process was predominantly diffusion controlled,39 which means that the rate of the entire reaction depends on the speed of the material diffusing from the body of the solution to the surface of the electrode. Oxygen reacts on the surface of the electrode, where the electrochemical reaction and the diffusion of the electrolyte are mutually constrained. If the diffusion is slow and the electrochemical reaction is relatively fast, the electrochemical reaction is completed and the substances involved in the reaction have not yet traversed, and thus, the rate of diffusion becomes a controlling factor that restricts the reaction.
Optimization of the determining conditions
In order to acquire the optimized performance of the biosensor for the detection of cholesterol, the concentration of Ag+, temperature and time of deposition reaction, deposition time of NPs and number of layers of rGO-PAMAM-Fc nanomaterials were investigated. Effect of different numbers of rGO-PAMAM-Fc nanomaterials on the response current signal of the biosensor was studied (Figure 5A). The current intensity increased with an increasing number of layers of rGO-PAMAM-Fc nanomaterials and reached the maximum value at the five layers; with further increase in the number of rGO-PAMAM-Fc nanomaterials, the response current of the biosensor declined slightly. This might be because of the rGO-PAMAM-Fc being too thick to affect the transfer of electron. Therefore, five films were selected as the optimum number for further experiments. Effect of different molecular generations of PAMAM in the rGO-PAMAM-Fc nanomaterials is shown in Figure 5B. As can be seen from the figure, current response of the biosensor reached the maximum value at the generation 5 of PAMAM.
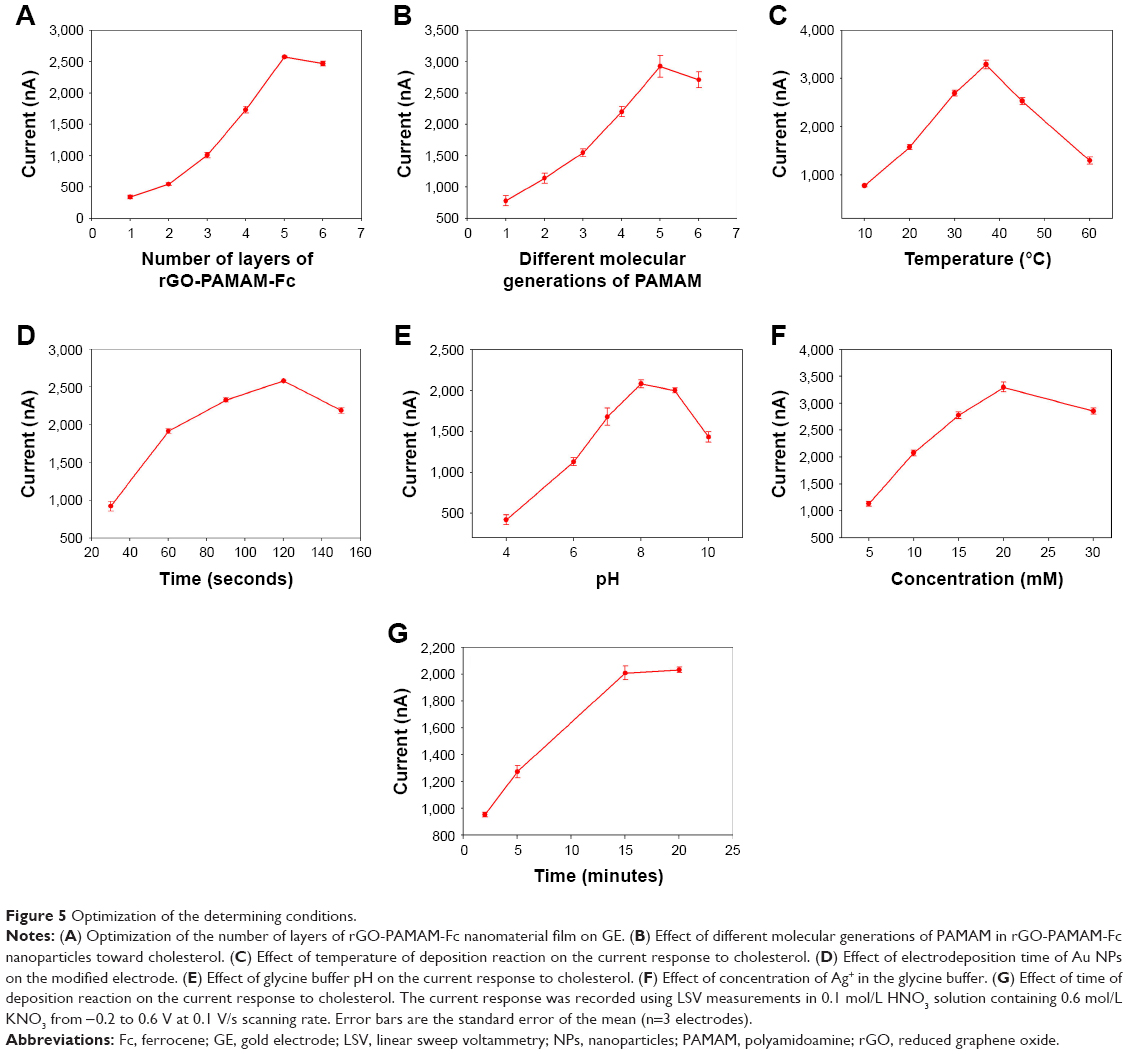 | Figure 5 Optimization of the determining conditions. |
Enzyme-catalytic efficiency is related to the temperature. The response current increased with an increase of temperature from 4°C to 37°C and reached the maximum value at 37°C; on further increasing the temperature, the structure of enzyme changes, leading to loss of its activity. The biological activity of the enzyme is very sensitive. The enzymatic activities of ChOx and ChEt are not high at low temperature and are easily deactivated under high temperature conditions, which would severely affect the catalytic performance of the enzyme, resulting in reduction of hydrogen peroxide generated and dropping of the current signal. At 37°C, the enzyme showed efficient biological activity, which catalyzed and generated large amount of hydrogen peroxide and the current signal reached the maximum value. Therefore, 37°C was chosen as the optimized temperature for further experiments (Figure 5C).
The effect of the deposition time of Au NPs on current response of the biosensor was investigated. Figure 5D depicts the effect of electrodeposition time of Au NPs on the cholesterol biosensor. The current response increased with an increase of time and reached the optimum value at 120 seconds; then, the current of biosensor declined with further increase of time. As the deposition time increased, deposition sites of gold atom grew in number, particles gradually increased and the surface of the electrode formed an uneven structure. With further increase in deposition time, a large number of gold atoms were deposited, structure of the particles continued to grow and the spacing gradually became smaller. When the deposition time exceeded a certain limit, the space between the particles further reduced and they grew into a single piece, which would affect the fixation and adsorption of the biological macromolecules. So, 120 seconds was chosen to be the optimum deposition time for further experiments.
The response currents of the modified electrode were evaluated in glycine buffer with pH values from 4 to 10 containing AgNO3 (Figure 5E). The current response increased with an increase of pH and then started to decline. Acidic environment disrupted catalytic reaction of the enzyme, which works properly in physiological conditions; so, further rise in pH of the buffer is harmful for the enzyme and would end in lower response current. By putting these factors together, the behavior of current intensity toward different pH values seems to be logical. Finally, and since the maximum current was obtained at pH =8.0, it was chosen as the optimum value and used in quantification of protein. These results are compatible with those of other literatures.
The effect of the concentration of silver ion on the current response of the biosensor was investigated (Figure 5F). The current response increased with an increase in the concentration of silver ion from 5 to 20 mM, which was because of the efficient enzyme catalysis; with further increase in the concentration of the silver ion, the current value declined. This is because a large number of heavy metals cause inactivation and poisoning of the enzyme. The effect of the time of deposition reaction is shown in Figure 5G. As can be seen from the figure, the current value reached the maximum value when the time of deposition reaction was 15 minutes, and with further increase in time, the current value almost remained constant.
Performance of the biosensor toward cholesterol
The performance of the ChOx&ChEt/Au NPs/rGO-PAMAM-Fc biosensor was evaluated at different concentrations of cholesterol under optimal experimental conditions (Figure 6A). The current of the ChOx&ChEt/Au NPs/rGO-PAMAM-Fc biosensor was obtained at different concentrations of cholesterol in 0.1 M (pH 8.0) glycine buffer solution containing AgNO3, and the low detection limit of 2 nM was obtained at the signal/noise ratio of 3. Figure 6B shows that the response current demonstrated a linear relationship with cholesterol concentration from 0.0004 to 15.36 mM (R2=0.9986). The LSV measurement curve is shown in Figure 6C. It can be seen from the figure that the peaks of LSV curve were obtained at a voltage of 0.2 V. As the cholesterol concentration increased, the current peak value (absolute value) increased, indicating that the generated response signal had a certain relationship with the concentration of cholesterol. The performance of biosensor with different materials for measurement of cholesterol was compared with the previous reports and is shown in Table 1. ChOx&ChEt/Au NPs/rGO-PAMAM-Fc/GE showed a better performance in detection of cholesterol.
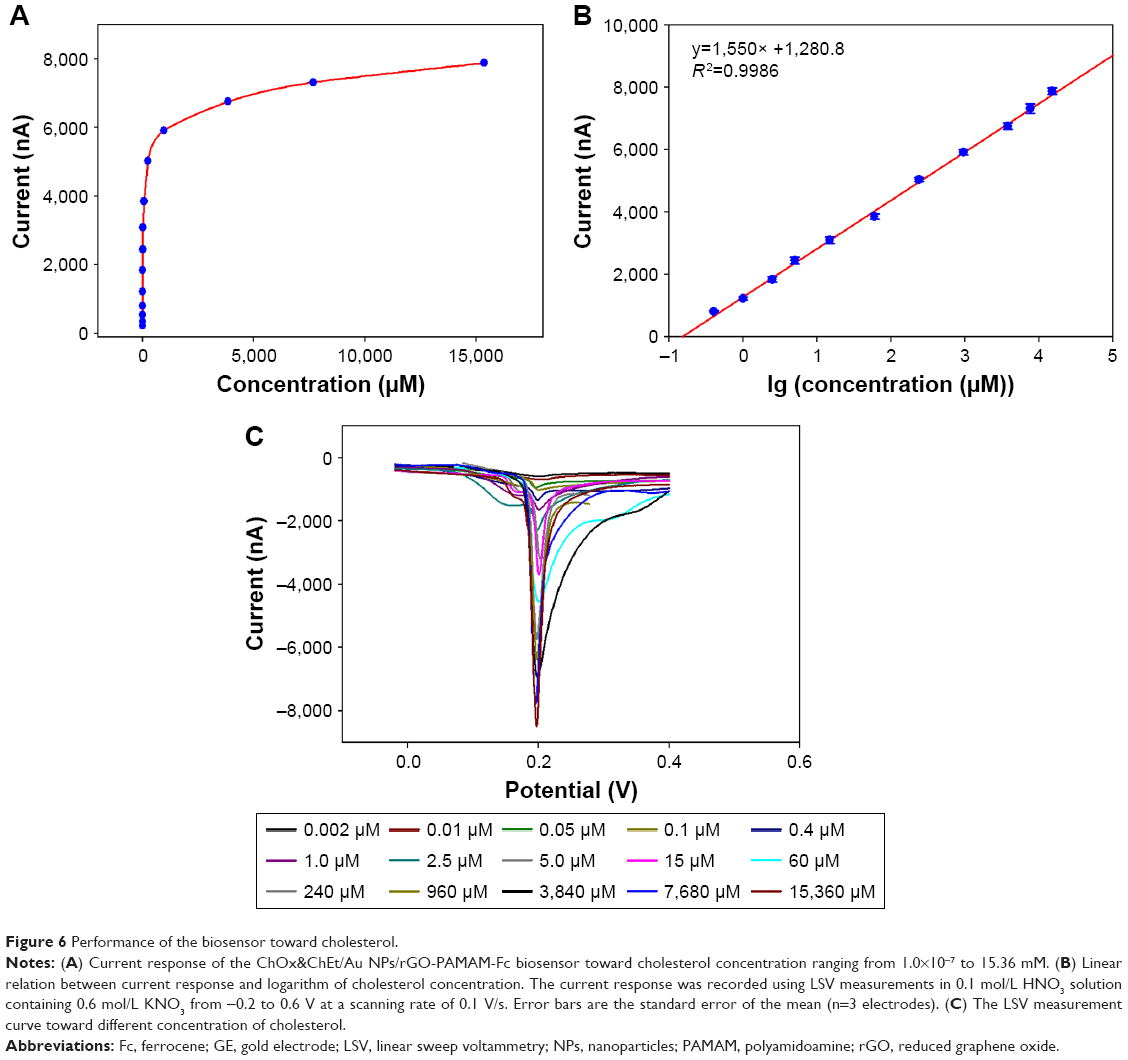 | Figure 6 Performance of the biosensor toward cholesterol. |
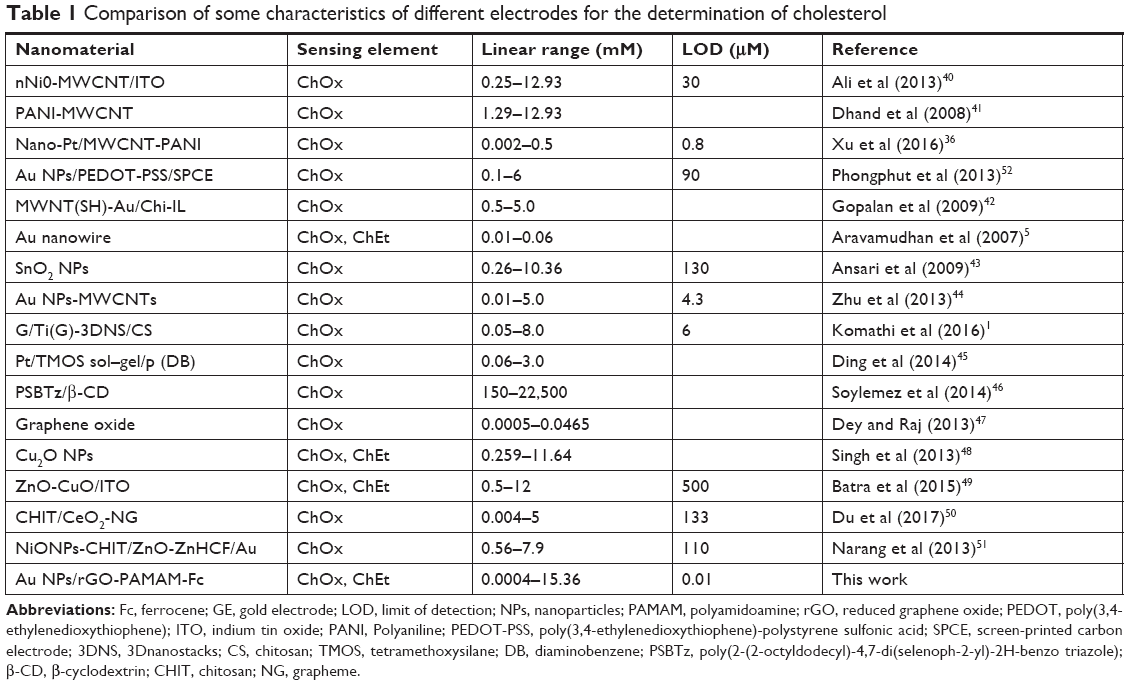 | Table 1 Comparison of some characteristics of different electrodes for the determination of cholesterol |
Selectivity, reproducibility and stability of the biosensor
Selectivity of ChOx&ChEt/Au NPs/rGO-PAMAM-Fc/GE biosensor was investigated when possible interfering substances were used as the control, including estradiol, glucose, ascorbic acid, uric acid. The selectivity experiments were investigated by comparing the performance of biosensor in the presence of estradiol, ascorbic acid, uric acid or glucose (20 μM) instead of cholesterol (Figure 7). According to the statistical analysis, the response current signal in the presence of cholesterol was significantly higher than that of interfering substances (P>0.05). There was no significant change in response to the presence of the interfering species, which indicated that estradiol, glucose, ascorbic acid and uric acid have no interference in the measurement of cholesterol.
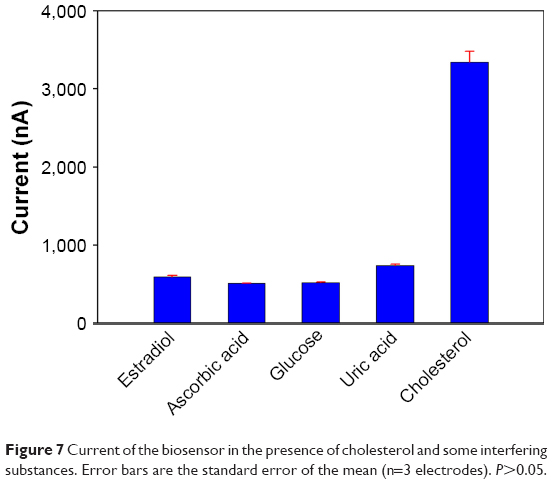 | Figure 7 Current of the biosensor in the presence of cholesterol and some interfering substances. Error bars are the standard error of the mean (n=3 electrodes). P>0.05. |
Reproducibility of the ChOx&ChEt/Au NPs/rGO-PAMAM-Fc/GE biosensor was verified by comparing the current response signal of six different electrodes at the same concentration of cholesterol. The relative SD for cholesterol detection was found to be <5.9%, which indicated acceptable fabrication reproducibility.
The stability was investigated by detecting the current of Ag/ChOx&ChEt/Au NPs/rGO-PAMAM-Fc biosensor by repeated measurements. The response of Ag/ChOx&ChEt/Au NPs/rGO-PAMAM-Fc/GE biosensor almost retained about 80% of its original response on the 12th measurement.
Human serum analysis
In order to study the potential of ChOx&ChEt/Au NPs/rGO-PAMAM-Fc biosensors for practical application, it was used to measure cholesterol in human serum by the standard addition method. Perchloric acid was added to human serum at a volume ratio of 1:10 to remove protein. After centrifugation, 1 mL of the above-mentioned serum solution was diluted with ethanol to 10 mL. A series of sample solutions were prepared by adding a certain volume of cholesterol to human serum samples. The results are shown in Table 2, which demonstrates the biosensor could be applied to human serum assays. Due to certain deviation in the process of sensor electrode modification, the stability of the generated detection signal needs to be improved. In addition, cholesterol is oxidized to cholest-4-en-3-one by the flavin cofactor. The reduced cofactor is recycled by oxygen to produce H2O2, and then the Ag ions are reduced into metallic Ag. At the same time, due to the presence of some interfering substances in the blood, such as proteins, hydrogen peroxide could be also decomposed by partially reducing proteins, which results in a certain deviation of the detection signal. In the process, after centrifugation of the blood to remove the protein, the response signal was more accurate than in the sample with the protein not removed. Therefore, we have been trying to find a solution to improve the sensor, which can then be more accurately used for the detection of cholesterol in whole blood. It is well known that electrochemical biosensors have the advantages of simple operation, easy miniaturization, rapid detection and online monitoring. It is the ultimate goal to develop working electrode into a portable test strip. Therefore, small instruments for rapid detection of clinical cholesterol need to be developed.
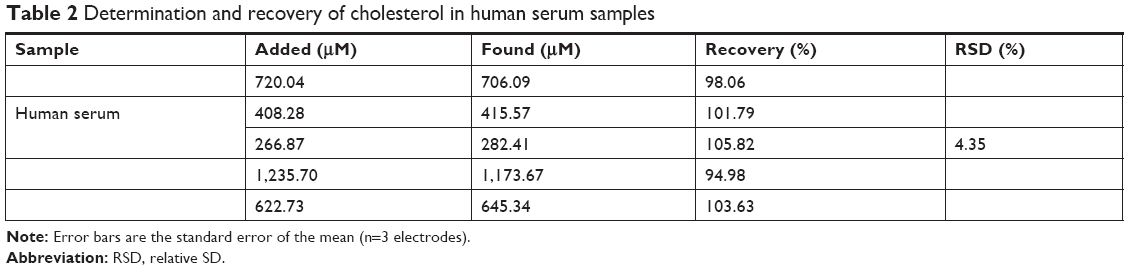 | Table 2 Determination and recovery of cholesterol in human serum samples |
Conclusion
In this work, a cholesterol biosensor based on Au NPs/rGO-PAMAM-Fc was constructed and detected by LSV in the presence of cholesterol molecules. The rGO-PAMAM-Fc nanomaterials combined the excellent electron conductivity properties and larger surface area of rGO, biocompatibility of PAMAM and reversible electrochemical properties of Fc. The doped Au NPs enhanced the electron transfer ability. The lowest detectable concentration of cholesterol was 2 nM, and the linear detection range extended to 0.0004–15.36 mM. Besides, the biosensor has displayed great possibility for application in the detection of cholesterol in clinical diagnostics.
Data sharing statement
The authors do not intend to share individual deidentified participant data.
Acknowledgments
This work is supported by the Health Science and Technology Project of Hangzhou (2018B072), Medicine and Health Research Foundation of Zhejiang Province (2018KY147, 2019KY017, 2016DTB001, 2017KY005), the Basic Ability Enhancement Program for Young and Middle-age Teachers of Guangxi (2018KY0115), Fund for “Integration of Cloud Computing and Big Data, Innovation of Science and Education” (2017A11036), Traditional Chinese Medicine Scientific Research Foundation of Zhejiang Province (2018ZY001, 2019ZZ001), Natural Science Foundation of Zhejiang Province (Y15H280010, LQ17H160017) and Hangzhou Science Technology Bureau (20140633B67).
Disclosure
The authors report no conflicts of interest in this work.
References
Komathi S, Muthuchamy N, Lee KP, Gopalan AI. Fabrication of a novel dual mode cholesterol biosensor using titanium dioxide nanowire bridged 3D graphene nanostacks. Biosens Bioelectron. 2016;84:64–71. | ||
Parlak O, Tiwari A, Turner AP, Tiwari A. Template-directed hierarchical self-assembly of graphene based hybrid structure for electrochemical biosensing. Biosens Bioelectron. 2013;49:53–62. | ||
Saxena U, Das AB. Nanomaterials towards fabrication of cholesterol biosensors: key roles and design approaches. Biosens Bioelectron. 2016;75:196–205. | ||
Sekretaryova AN, Beni V, Eriksson M, Karyakin AA, Turner AP, Vagin MY. Cholesterol self-powered biosensor. Anal Chem. 2014;86(19):9540–9547. | ||
Aravamudhan S, Kumar A, Mohapatra S, Bhansali S. Sensitive estimation of total cholesterol in blood using Au nanowires based micro-fluidic platform. Biosens Bioelectron. 2007;22(9–10):2289–2294. | ||
Becker L, Gharib SA, Irwin AD, et al. A macrophage sterol-responsive network linked to atherogenesis. Cell Metab. 2010;11(2):125–135. | ||
Lee YJ, Park JY. Nonenzymatic free-cholesterol detection via a modified highly sensitive macroporous gold electrode with platinum nanoparticles. Biosens Bioelectron. 2010;26(4):1353–1358. | ||
Chung M, Jang YJ, Kim MI. Convenient colorimetric detection of cholesterol using multi-enzyme co-incorporated organic-inorganic hybrid nanoflowers. J Nanosci Nanotechnol. 2018;18(9):6555–6561. | ||
Aneesh K, Vusa CS, Berchmans S. Impurity-induced peroxidase mimicry of nanoclay and its potential for the spectrophotometric determination of cholesterol. Anal Bioanal Chem. 2016;408(22):6213–6221. | ||
Bocos C, Castro M, Orozco E, et al. A rapid and sensitive method for HPLC cholesterol determination in bile. Rev Esp Fisiol. 1992;48:211–214. | ||
Safavi A, Farjami F. Electrodeposition of gold–platinum alloy nanoparticles on ionic liquid-chitosan composite film and its application in fabricating an amperometric cholesterol biosensor. Biosens Bioelectron. 2011;26(5):2547–2552. | ||
Shrestha BK, Ahmad R, Shrestha S, Park CH, Kim CS. In situ synthesis of cylindrical spongy polypyrrole doped protonated graphitic carbon nitride for cholesterol sensing application. Biosens Bioelectron. 2017;94:686–693. | ||
Sarkar S, Bekyarova E, Haddon RC. Chemistry at the Dirac point: Diels–Alder reactivity of graphene. Acc Chem Res. 2012;45(4):673–682. | ||
Umar A, Rahman MM, Al-Hajry A, Hahn YB. Highly-sensitive cholesterol biosensor based on well-crystallized flower-shaped ZnO nanostructures. Talanta. 2009;78(1):284–289. | ||
Bai Z, Li G, Liang J, et al. Non-enzymatic electrochemical biosensor based on Pt NPs/RGO-CS-Fc nano-hybrids for the detection of hydrogen peroxide in living cells. Biosens Bioelectron. 2016;82:185–194. | ||
Guo S, Dong S, Wang E. Three-dimensional Pt-on-Pd bimetallic nanodendrites supported on graphene nanosheet: facile synthesis and used as an advanced nanoelectrocatalyst for methanol oxidation. ACS Nano. 2010;4(1):547–555. | ||
Guo Y, Deng L, Li J, Guo S, Wang E, Dong S. Hemin–graphene hybrid nanosheets with intrinsic peroxidase-like activity for label-free colorimetric detection of single-nucleotide polymorphism. ACS Nano. 2011;5(2):1282–1290. | ||
Ji D, Liu L, Li S, et al. Smartphone-based cyclic voltammetry system with graphene modified screen printed electrodes for glucose detection. Biosens Bioelectron. 2017;98:449–456. | ||
Xu Y, Bai H, Lu G, Li C, Shi G. Flexible graphene films via the filtration of water-soluble noncovalent functionalized graphene sheets. J Am Chem Soc. 2008;130(18):5856–5857. | ||
Zhang Q, Zhang D, Lu Y, Yao Y, Li S, Liu Q. Graphene oxide-based optical biosensor functionalized with peptides for explosive detection. Biosens Bioelectron. 2015;68:494–499. | ||
Kaminska I, Barras A, Coffinier Y, et al. Preparation of a responsive carbohydrate-coated biointerface based on graphene/azido-terminated tetrathiafulvalene nanohybrid material. ACS Appl Mater Interfaces. 2012;4(10):5386–5393. | ||
Ge Y, Guo Y, Qin W. Polyamidoamine dendrimers as sweeping agent and stationary phase for rapid and sensitive open-tubular capillary electrophoretic determination of heavy metal ions. Talanta. 2014;121:50–55. | ||
Guo D, Lou C, Zhang P, et al. Polystyrene-divinylbenzene-glycidyl methacrylate stationary phase grafted with poly (amidoamine) dendrimers for ion chromatography. J Chromatogr A. 2016;1456:113–122. | ||
Kim DM, Rahman MA, Do MH, Ban C, Shim YB. An amperometric chloramphenicol immunosensor based on cadmium sulfide nanoparticles modified-dendrimer bonded conducting polymer. Biosens Bioelectron. 2010;25(7):1781–1788. | ||
Mignani S, El Kazzouli S, Bousmina M, Majoral JP. Expand classical drug administration ways by emerging routes using dendrimer drug delivery systems: a concise overview. Adv Drug Deliv Rev. 2013;65(10):1316–1330. | ||
Uram Ł, Szuster M, Filipowicz A, Gargasz K, Wołowiec S, Wałajtys-Rode E. Different patterns of nuclear and mitochondrial penetration by the G3 PAMAM dendrimer and its biotin-pyridoxal bioconjugate BC-PAMAM in normal and cancer cells in vitro. Int J Nanomedicine. 2015;10:5647–5661. | ||
Miodek A, Mejri-Omrani N, Khoder R, Korri-Youssoufi H. Electrochemical functionalization of polypyrrole through amine oxidation of poly(amidoamine) dendrimers: application to DNA biosensor. Talanta. 2016;154:446–454. | ||
Tang D, Tang J, Su B, Chen G. Gold nanoparticles-decorated amine-terminated poly(amidoamine) dendrimer for sensitive electrochemical immunoassay of brevetoxins in food samples. Biosens Bioelectron. 2011;26(5):2090–2096. | ||
Yang X, Lu J, Zhu Y, et al. Microbial fuel cell cathode with dendrimer encapsulated Pt nanoparticles as catalyst. J Power Sources. 2011;196(24):10611–10615. | ||
Zheng J, Lin S, Zhu X, Jiang B, Yang Z, Pan Z. Reductant-directed formation of PS-PAMAM-supported gold nanoparticles for use as highly active and recyclable catalysts for the aerobic oxidation of alcohols and the homocoupling of phenylboronic acids. Chem Commun (Camb). 2012;48(50):6235–6237. | ||
Dervisevic M, Dervisevic E, Senel M, Cevik E, Yildiz HB, Camurlu P. Construction of ferrocene modified conducting polymer based amperometric urea biosensor. Enzyme Microb Technol. 2017;102:53–59. | ||
Rabti A, Mayorga-Martinez CC, Baptista-Pires L, Raouafi N, Merkoçi A. Ferrocene-functionalized graphene electrode for biosensing applications. Anal Chim Acta. 2016;926:28–35. | ||
Low FW, Lai CW, Abd Hamid SB. Facile synthesis of high quality graphene oxide from graphite flakes using improved Hummer’s technique. J Nanosci Nanotechnol. 2015;15(9):6769–6773. | ||
Hamidi A, Sharifi S, Davaran S, Ghasemi S, Omidi Y, Rashidi MR. Novel aldehyde-terminated dendrimers; synthesis and cytotoxicity assay. Bioimpacts. 2012;2(2):97–103. | ||
Ahmad R, Tripathy N, Hahn YB. High-performance cholesterol sensor based on the solution-gated field effect transistor fabricated with ZnO nanorods. Biosens Bioelectron. 2013;45:281–286. | ||
Xu Z, Cheng X, Tan J, Gan X. Fabrication of multiwalled carbon nanotube-polyaniline/platinum nanocomposite films toward improved performance for a cholesterol amperometric biosensor. Biotechnol Appl Biochem. 2016;63(6):757–764. | ||
Lin X, Ni Y, Kokot S. Electrochemical cholesterol sensor based on cholesterol oxidase and MoS2-AuNPs modified glassy carbon electrode. Sens Actuators B Chem. 2016;233:100–106. | ||
Lin X, Ni Y, Kokot S. Electrochemical and bio-sensing platform based on a novel 3D Cu nano-flowers/layered MoS2 composite. Biosens Bioelectron. 2016;79:685–692. | ||
Ji J, Zhou Z, Zhao X, Sun J, Sun X. Electrochemical sensor based on molecularly imprinted film at Au nanoparticles-carbon nanotubes modified electrode for determination of cholesterol. Biosens Bioelectron. 2015;66:590–595. | ||
Ali MA, Srivastava S, Solanki PR, et al. Highly efficient bienzyme functionalized nanocomposite-based microfluidics biosensor platform for biomedical application. Sci Rep. 2013;3(1):2661–2669. | ||
Dhand C, Arya SK, Datta M, Malhotra BD. Polyaniline-carbon nanotube composite film for cholesterol biosensor. Anal Biochem. 2008;383(2):194–199. | ||
Gopalan AI, Lee KP, Ragupathy D. Development of a stable cholesterol biosensor based on multi-walled carbon nanotubes-gold nanoparticles composite covered with a layer of chitosan-room-temperature ionic liquid network. Biosens Bioelectron. 2009;24(7):2211–2217. | ||
Ansari AA, Kaushik A, Solanki PR, Malhotra BD. Electrochemical cholesterol sensor based on tin oxide-chitosan nanobiocomposite film. Electroanalysis. 2009;21(8):965–972. | ||
Zhu L, Xu L, Tan L, Tan H, Yang S, Yao S. Direct electrochemistry of cholesterol oxidase immobilized on gold nanoparticles-decorated multiwalled carbon nanotubes and cholesterol sensing. Talanta. 2013;106:192–199. | ||
Ding Y, Zhu H, Zhang X, et al. An upconversion nanocomposite for fluorescence resonance energy transfer based cholesterol-sensing in human serum. Nanoscale. 2014;6(24):14792–14798. | ||
Soylemez S, Hacioglu SO, Kesik M, Unay H, Cirpan A, Toppare L. A novel and effective surface design: conducting polymer/β-cyclodextrin host-guest system for cholesterol biosensor. ACS Appl Mater Interfaces. 2014;6(20):18290–18300. | ||
Dey RS, Raj CR. Redox-functionalized graphene oxide architecture for the development of amperometric biosensing platform. ACS Appl Mater Interfaces. 2013;5(11):4791–4798. | ||
Singh J, Srivastava M, Roychoudhury A, Lee DW, Lee SH, Malhotra BD. Bienzyme-functionalized monodispersed biocompatible cuprous oxide/chitosan nanocomposite platform for biomedical application. J Phys Chem B. 2013;117(1):141–152. | ||
Batra N, Tomar M, Gupta V. ZnO–CuO composite matrix based reagentless biosensor for detection of total cholesterol. Biosens Bioelectron. 2015;67:263–271. | ||
Du X, Jiang D, Chen S, et al. CeO2 nanocrystallines ensemble-on-nitrogen-doped graphene nanocomposites: one-pot, rapid synthesis and excellent electrocatalytic activity for enzymatic biosensing. Biosens Bioelectron. 2017;89(Pt 1):681–688. | ||
Narang J, Chauhan N, Pundir CS. Construction of triglyceride biosensor based on nickel oxide-chitosan/zinc oxide/zinc hexacyanoferrate film. Int J Biol Macromol. 2013;60:45–51. | ||
Phongphut A, Sriprachuabwong C, Wisitsoraat A, Tuantranont A, Prichanont S, Sritongkham P. A disposable amperometric biosensor based on inkjet-printed Au/PEDOT-PSS nanocomposite for triglyceride determination. Sensors & Actuators: B. Chemical. 2013;178:501–507. |
 © 2019 The Author(s). This work is published and licensed by Dove Medical Press Limited. The
full terms of this license are available at https://www.dovepress.com/terms
and incorporate the Creative Commons Attribution
- Non Commercial (unported, 3.0) License.
By accessing the work you hereby accept the Terms. Non-commercial uses of the work are permitted
without any further permission from Dove Medical Press Limited, provided the work is properly
attributed. For permission for commercial use of this work, please see paragraphs 4.2 and 5 of our Terms.
© 2019 The Author(s). This work is published and licensed by Dove Medical Press Limited. The
full terms of this license are available at https://www.dovepress.com/terms
and incorporate the Creative Commons Attribution
- Non Commercial (unported, 3.0) License.
By accessing the work you hereby accept the Terms. Non-commercial uses of the work are permitted
without any further permission from Dove Medical Press Limited, provided the work is properly
attributed. For permission for commercial use of this work, please see paragraphs 4.2 and 5 of our Terms.