Back to Journals » International Journal of General Medicine » Volume 14
A Five Autophagy-Related Long Non-Coding RNA Prognostic Model for Patients with Lung Adenocarcinoma
Received 17 August 2021
Accepted for publication 28 September 2021
Published 27 October 2021 Volume 2021:14 Pages 7145—7158
DOI https://doi.org/10.2147/IJGM.S334601
Checked for plagiarism Yes
Review by Single anonymous peer review
Peer reviewer comments 2
Editor who approved publication: Dr Scott Fraser
Boxuan Liu, Shuanying Yang
Department of Critical Care and Respiratory Medicine, The Second Affiliated Hospital, Xi’an Jiaotong University, Xi’an, Shaanxi, 710004, People’s Republic of China
Correspondence: Shuanying Yang
Department of Critical Care and Respiratory Medicine, The Second Affiliated Hospital, Xi’an Jiaotong University, 157 Xiwu Road, Xi’an, Shaanxi, 710004, People’s Republic of China
Tel +86 13991392919
Email [email protected]
Purpose: Lung adenocarcinoma is the most common pathological type among non-small cell lung cancer. Although huge progress has been made in terms of early diagnosis and precision treatment in recent years, the overall 5-year survival rate of a patient remains low. In our study, we try to construct an autophagy-related lncRNA prognostic signature that may guide clinical practice.
Methods: The mRNA and lncRNA expression matrix of lung adenocarcinoma patients were retrieved from the TCGA database. Next, we constructed a co-expression network of lncRNAs and autophagy-related genes. Lasso regression and multivariate Cox regression were then applied to establish a prognostic risk model. Subsequently, a risk score was generated to differentiate the high and low risk groups and a ROC curve and nomogram to visualize the predictive ability of the current signature. Finally, gene ontology and pathway enrichment analysis were executed via GSEA.
Results: A total of 1,703 autophagy-related lncRNAs were screened and five autophagy-related lncRNAs (LINC01137, AL691432.2, LINC01116, AL606489.1, and HLA-DQB1-AS1) were finally included in our signature. Judging from univariate (HR=1.075, 95% CI=1.046– 1.104) and multivariate (HR=1.088, 95% CI=1.057− 1.120) Cox regression analysis, the risk score is an independent factor for LUAD patients. Further, the AUC value based on the risk score for 1-year, 3-years, and 5-years, was 0.735, 0.672, and 0.662, respectively, indicating a reliable model. Drug sensitivity analysis revealed low risk patients were more sensitive to Gemcitabine and Gefitinib, while high risk patients had a better response to Paclitaxel and Erlotinib. Moreover, the lncRNAs included in our signature were primarily enriched in the autophagy process, metabolism, p53 pathway, and JAK/STAT pathway. Finally, a multi-omics analysis of correlated genes showed CFLAR overexpressed in the tumor sample, while GAPDH and MLST8 had a slightly higher expression in the normal sample.
Conclusion: Overall, our study indicated that the prognostic model we generated had certain predictability for LUAD patients’ prognosis and the related genes might be potential biomarkers and therapeutic targets.
Keywords: lung adenocarcinoma, autophagy, long non-coding RNA, prognostic model, The Cancer Genome Atlas
Introduction
Lung cancer is the leading cause of cancer-related deaths worldwide. Newly-diagnosed lung cancer patients in the US has exceeded 2 million a year. Non-small cell lung cancer (NSCLC) accounts for nearly 80% of all new lung cancer cases including lung adenocarcinoma and lung squamous carcinoma.1 For lung adenocarcinoma, it is the most common pathological type of NSCLC.2 Despite the advancement of treatment strategy, the prognosis of lung adenocarcinoma (LUAD) patients has limited improvement in 5 year survival rate. Therefore, it is of great need for us to establish a novel prognostic signature for physicians to formulate a patient-specific treatment plan.
Autophagy is a protein degradation process with multiple steps in eukaryotes which makes a vital part in maintaining homeostasis. Studies have shown autophagy plays a critical part in various human diseases such as heart disease, tumorigenesis, and tumor progression, as well as neurology malfunction.3,4 Recent studies indicate the involvement of autophagy in tumor occurrence, maintenance, as well as progression. Further analysis on autophagy shows it can be classified into one of the tumor suppressor mechanisms that enhances chemotherapy response.5,6 In past years, numerous cancer-related pathways such as P53/DRAM and JAK-STAT were found to be involved in autophagy. Therefore, researchers believed that the molecules in autophagy may serve as novel biomarkers or therapeutic targets for lung cancer. For example, Goldberg et al7 found hydroxychloroquine to be safe to use in cancer therapy and exhibita promising future.
In addition to autophagy-related targets, long non-coding RNAs (lncRNA) represent another promising field in finding cancer biomarkers. Non-coding RNA makes up a majority of the human RNAs with lncRNAs (>200 nucleotide-long) being the most studied due to their role in tumorigenesis, cell cycle, apoptosis, and chemo-resistance.8–11 Furthermore, several studies have found the expression of certain lncRNA may also serve as biomarkers in predicting a patients’ prognosis. For example, Kumar et al found the high expression of p53 in LUAD patients predicted a poor prognosis. Zeng et al established a five-lncRNA signature which can serve as an independent survival predictor. Nevertheless, none of the studies have investigated whether autophagy-related lncRNA (ARlncRNA) can be used to establish a prognosis model to predict patients’ survival. Thus, we applied a mRNA and lncRNA expression profile from the TCGA database to generate a risk model for LUAD patients.
Materials and Methods
Raw Data Acquisition and Initial Analysis
The mRNA and lncRNA expression profile and its clinical data of LUAD patients were downloaded from The Cancer Genome Atlas (TCGA) database (https://portal.gdc.cancer.gov/). The Practical Extraction and Report Language (Perl) script was then applied to extract survival time, age, gender, tumor stage, and TNM stage to merge into a single file. After initial screening of the clinical file, we excluded patients with a short follow-up time (<30 days), yielding a final sample of 454.
Screening Autophagy-Related lncRNAs
A list of autophagy related genes (Supplementary Material S1) were obtained from the Human Autophagy Database (HADb, http://autophagy.lu/clustering/index.html). Then, the autophagy-related gene matrix was filtered out and went through a log2 transformation. Pearson correlation test was exploited to filter out the most correlated lncRNAs. The cut-off value of correlation coefficient was set as | R2 | >0.3 and P<0.001.
Identification of Autophagy-Related lncRNAs Signature for Lung Adenocarcinoma
After initial screening of autophagy-related lncRNAs, Cox regression was used to determine if the lncRNA was significantly correlated with patients’ prognosis. Then, the least absolute shrinkage and selection operator (Lasso) regression were adopted to construct a prognostic risk score based on the following formula:
risk score=coef(lncRNA1)×expr(lncRNA1)+coef(lncRNA2)×expr(lncRNA2)++coef(lncRNAn)×expr(lncRNAn)with coef (lncRNAn) being the coefficient of lncRNAs and expr (lncRNAn) being the expression of lncRNAs.
According to the median risk score, all included samples were then allocated into a high‐risk group and a low‐risk group.
Independent Survival Analysis of the Signature for LUAD Patients
To test the credibility of the prognostic model we constructed, we applied both univariate and multivariate Cox regression to assess patients’ survival with clinicopathological factors and risk score. The receiver operating characteristic (ROC) curves were generated using the “survivalROC” package in R software. Further, we drew a Nomogram to visualize a patient’s survival probability under our prognostic signature, and the index of concordance (C-index) was also calculated to show the accuracy of the signature.
Functional Analysis
Gene Set Enrichment Analysis (GSEA) (http://software.broadinstitute.org/gsea/index.jsp) is a software that calculates whether a set of genes exhibits significant differences between two groups. We conducted GSEA analysis using the risk score as the phenotype to identify the differentially expressed genes along with the gene ontology (GO) terms and KEGG pathways.
Multi-Omics Analysis of Associated Genes
The gene expression profiling interactive analysis (GEPIA) (http://gepia.cancer-pku.cn/) is another public platform that can investigate mRNA expression data between various cancer tissues and normal tissues.12 The HPA (human protein atlas) is an open source database with multiple immunohistochemistry (IHC) results of normal tissue and tumor sample which identifies the protein expression level of different molecules.
Statistical Analysis
All statistical analyses were performed using R Studio (version 1.1.453). The “limma” package was applied to differentiate the survival-related lncRNAs and the co‐expression network of the lncRNAs‐mRNAs was established and visualized via Cytoscape and Sankey diagram. The Kaplan-Meier survival analysis was visualized using survival R package and the P-value was calculated via Log rank tests. The univariate and multivariate Cox regression analysis were applied to assess the relationship between risk score and clinicopathological parameters via t-test. The Nomogram was drawn by applying the “rms” package. The ROC curve was used to visualize the credibility of the the signature and an area under the ROC curve (AUC) value over 0.60 was considered to have certain credibility. Two‐tailed P<0.05 was considered as statistically significant.
Results
Establishment of a Co-Expression Network
A total of 14,142 lncRNAs were separated from the patients’ expression profiles. In searching for HADb, we found 223 autophagy related genes (Supplementary Material S1), of which 210 genes were extracted from the TCGA-LUAD expression matrix. Next, we constructed a co-expression network between the autophagy related gene we identified and the correlated lncRNAs with a cut-off value of | R2 | >0.3 and P<0.001. Finally, a total of 1,703 autophagy-related ARlncRNAs were filtered out for further analysis.
Development of Prognostic Risk Model from Autophagy-Related lncRNA
The univariate Cox regression identified a total of 74 ARlncRNAs that had a significant correlation with patients’ survival in LUAD. Of these, 57 ARlncRNAs were favorable factors (HR<1), while 17 ARlncRNAs showed harmful results (Supplementary Table S1). The Lasso regression (Figure 1A) and multivariate Cox regression finally incorporated five ARlncRNAs (LINC01137, AL691432.2, LINC01116, AL606489.1, and HLA-DQB1-AS1) to constitute a prognostic signature (Figure 1B and C, Table 1). Besides, the Kaplan-Meier survival analysis suggested AL691432.2 and HLA-DQB1-AS1 were positively correlated with the survival of LUAD patients, while the other three ARlncRNAs were risk factors (Figure 2). Moreover, we established a co-expression network to show the correlation between ARlncRNAs and autophagy-related genes (Figure 3A and B). Meanwhile, we also did a Pearson correlation test to find out the most correlated genes with each of the included lncRNAs in our signature (Supplementary Table S2). Finally, according to the results of the multivariate Cox regression analysis, a risk score was generated and allocated patients into high- and low-risk groups based on the following formula: Risk Score=(0.0538×LINC01137 expression)+(−0.0853×AL691432.2 expression)+(0.0718×LINC01116 expression)+(0.221×AL606489.1 expression)+(−0.0562×HLA-DQB1-AS1 expression).
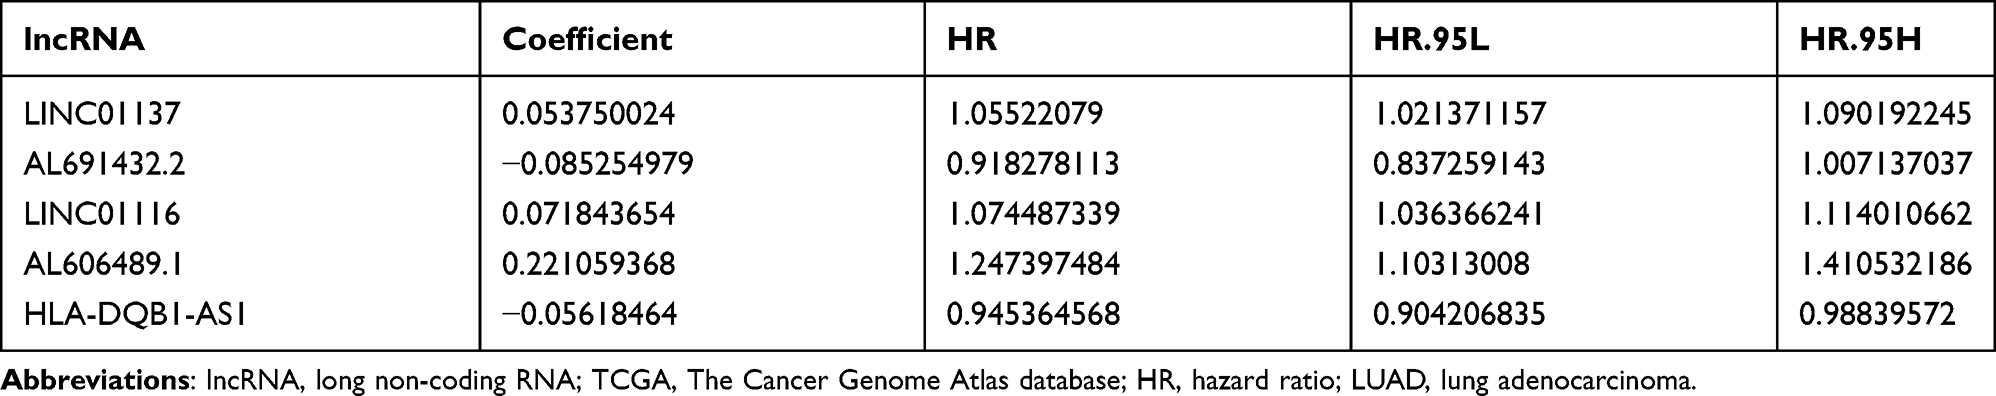 |
Table 1 Coefficient and Survival Analysis of Included lncRNAs Based on TCGA-LUAD Data |
 |
Figure 1 Selection of lncRNA using Lasso regression. (A) Lasso coefficient of the five included lncRNAs. (B) Profiles of Lasso coefficients. (C) Univariate analysis of included lncRNAs from the samples. *P<0.05; **P<0.01, ***P<0.001. |
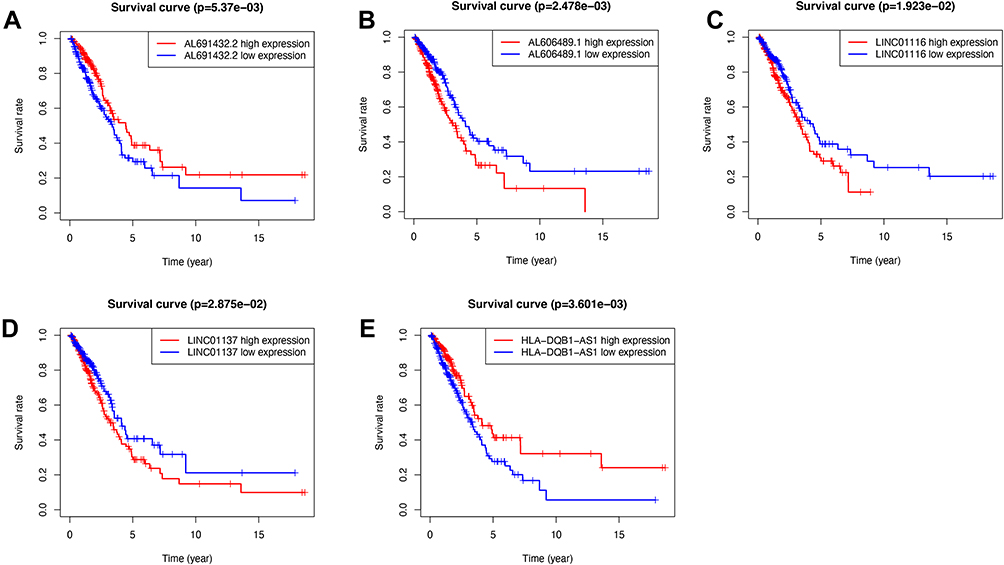 |
Figure 2 The Kaplan-Meier survival analysis of five included lncRNAs. LINC01137, AL606489.1, and LINC01116 were independent unfavorable factors. AL691432.2 and HLA-DQB1-AS1 were independent protective factors for lung adenocarcinoma. (A) Survival analysis of AL691432.2 in LUAD patients; (B) Survival analysis of AL606489.1 in LUAD patients; (C) Survival analysis of LINC01116 in LUAD patients; (D) Survival analysis of LINC01137 in LUAD patients; (E) Survival analysis of HLA-DQB1-AS1 in LUAD patients. |
 |
Figure 3 The co-expression network of autophagy-related lncRNA-mRNA and Sankey diagram. (A) mRNA – Autophagy-related lncRNAs – risk type relationship showed in Sankey diagram. (B) The co-expression network visualized using Cytoscape 3.7.2 software. |
The Prognostic Influence of the Established Signature
The cut-off value of risk score in our analysis was 0.9939, and 223 patients were assigned to low risk group, while 222 patients was assigned to the high risk group. The Kaplan-Meier survival analysis showed that the high-risk group had a poorer prognosis than the low-risk group (P-value<0.001, Figure 4E). For the time-dependent ROC curve, the AUC value for 1-year, 3-years, 5-years, and 7-years was 0.735, 0.672, 0.662, and 0.732, respectively, which indicate a reliability of this signature combination to predict patients’ survival (Figure 4A–D). A heatmap illustrating lncRNA expression patterns also indicated that AL691432.2 and HLA-DQB1-AS1 were protective factors (Figure 5A). Next, the risk score distribution along with the survival time between high and low risk group implies a poorer survival probability in the high risk group (Figure 5B and C).
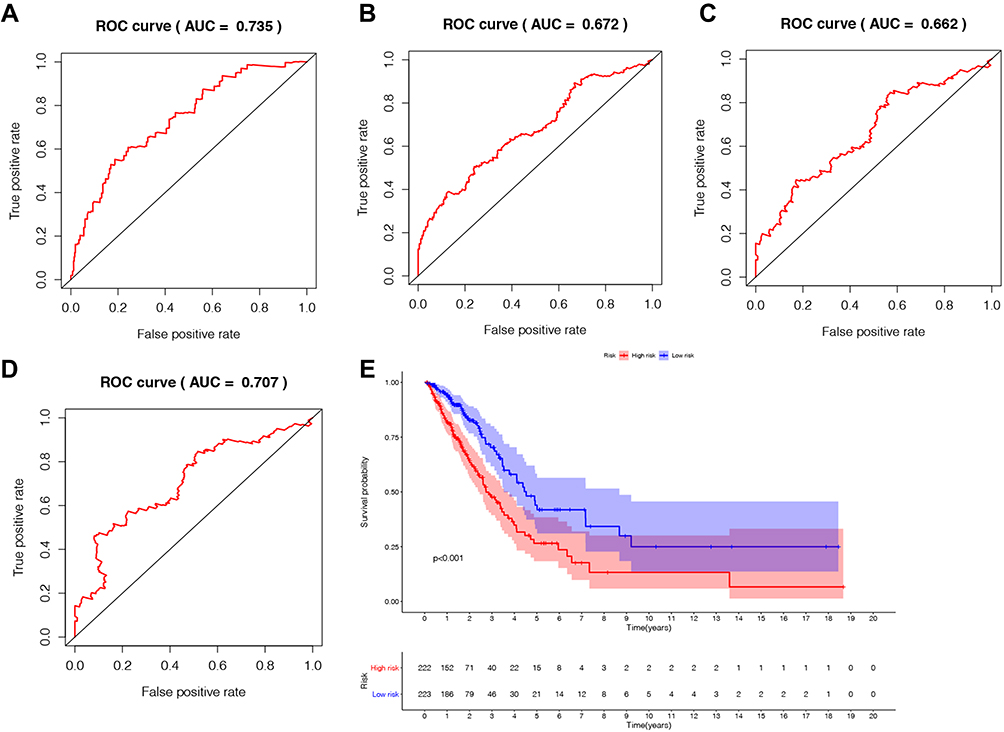 |
Figure 4 The prognostic indicators of the five autophagy-related lncRNAs signature. (A) 1-year survival ROC curve for LUAD patients. (B) 3-year survival ROC curve for LUAD patients. (C) 5-year survival ROC curve for LUAD patients. (D) 7-year survival ROC curve for LUAD patients. (E) Kaplan–Meier survival curve of the high-risk and low-risk groups for LUAD patients. |
 |
Figure 5 The analysis of the risk score from the generated risk model. (A) Expression profiles of lncRNAs in different groups; (B) the risk curve of each sample in high and low risk group; (C) the survival plot of each sample based on the risk score. |
Clinical Value of the ARlncRNA Signature
Univariate Cox regression analysis showed that the risk score and tumor stage were independent prognostic indicators with a HR of 1.075 (95% CI=1.046–1.104, P<0.001) and 1.666 (95% CI=1.409–1.969, P<0.001), respectively (Table 2 and Figure 6A). Multivariate Cox regression analysis – with clinical factors (age, gender, stage, and TNM) as covariates of risk score – revealed that risk score was an independent factor in our analysis with a HR of 1.088 (95% CI=1.057−1.120, P<0.001, Table 3 and Figure 6B). A nomogram incorporated clinicopathological parameters to quantify a patient’s survival. We established a nomogram system to predict a patient’s 1-year, 3-year, and 5-year survival rate, and the risk score and tumor stage were the biggest two contributors (Figure 6C). An ROC curve also suggested tumor stage (0.733) and risk score (0.668) had the highest AUC value among other clinicopathological factors (Figure 6D). A detailed clinical stratification on risk score showed this 5-ARlncRNAs signature had a close relationship with tumor stage, especially the tumor size, as well as the lymph nodes metastasis (Table 4).
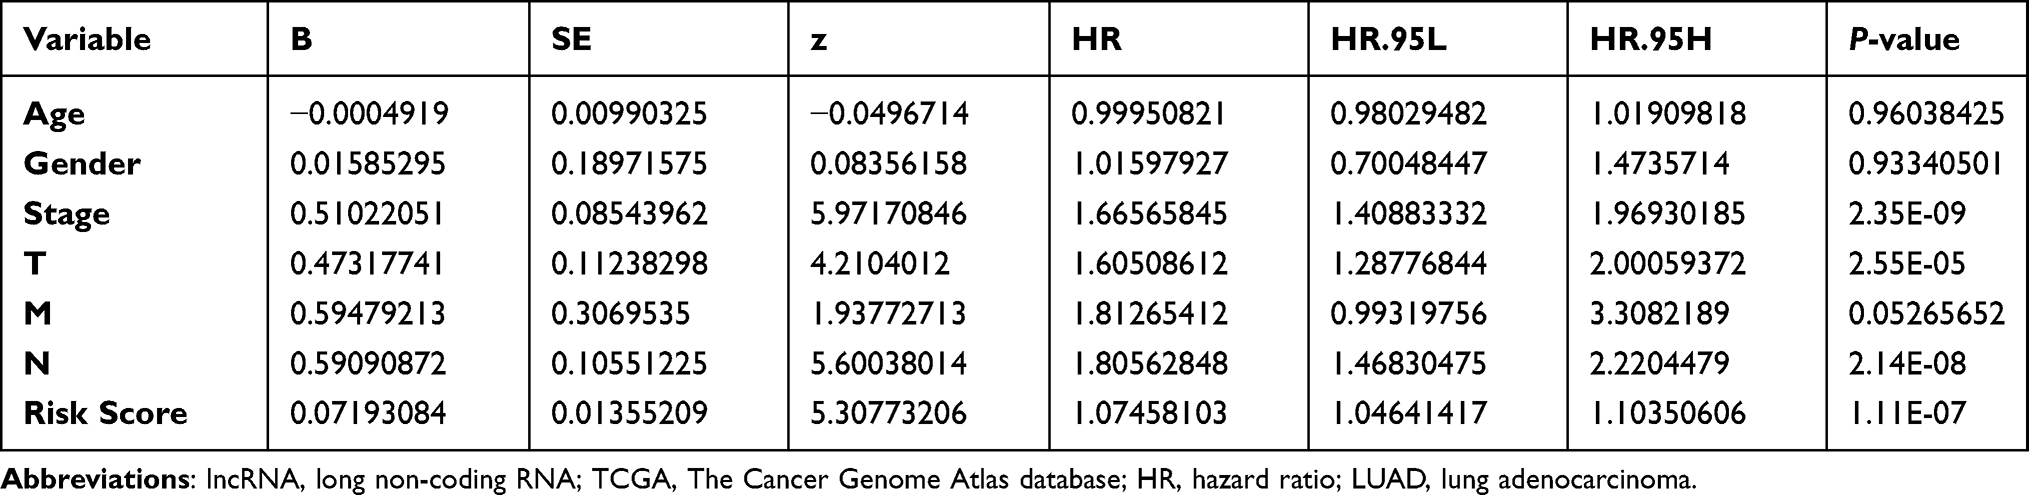 |
Table 2 Clinicopathological Characteristics and Risk Scores Under Univariate Cox Regression |
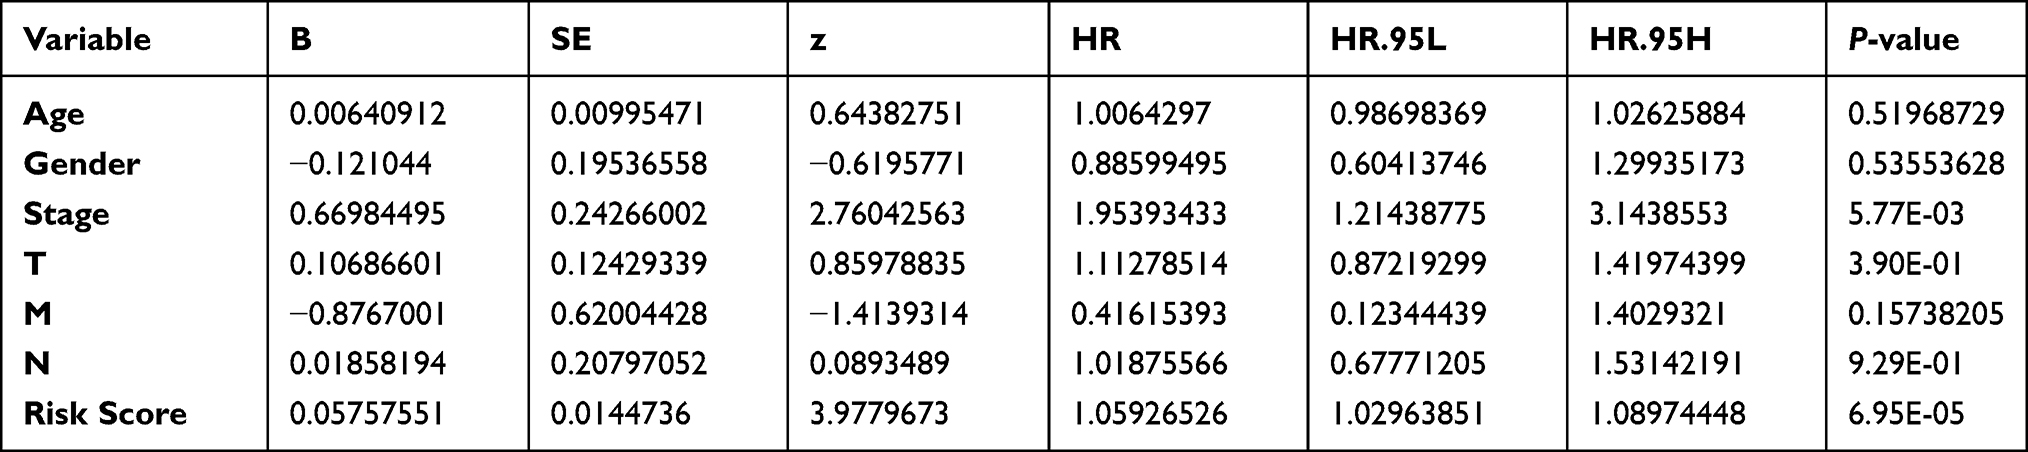 |
Table 3 Clinicopathological Characteristics and Risk Scores Under Multivariate Cox Regression |
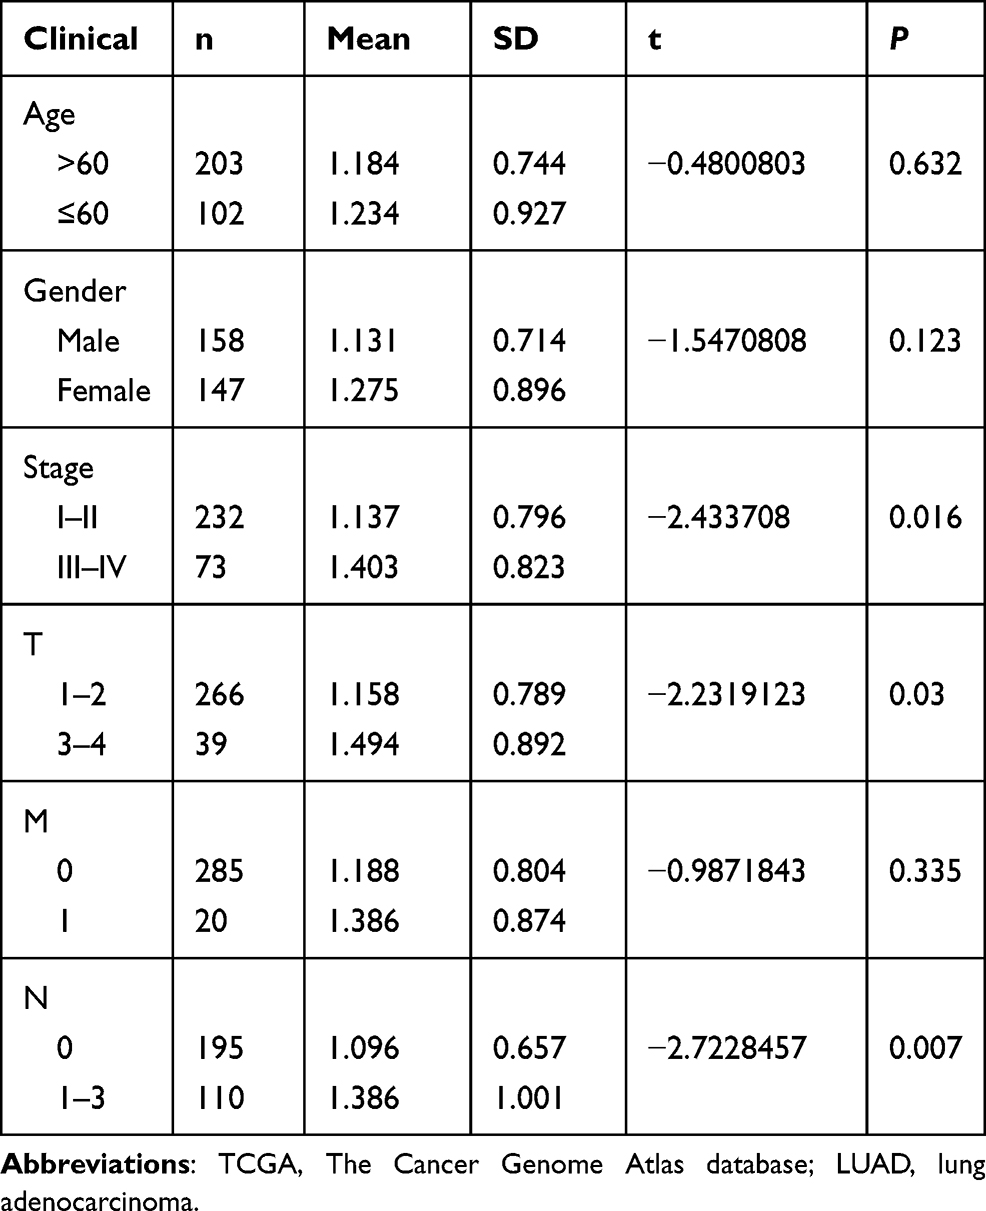 |
Table 4 The Relationship of Clinicopathological Characteristics and Risk Score |
 |
Figure 6 The evaluation of the constructed signature’s prognostic credibility in LUAD patients. (A and B) The univariate and multivariate Cox regression analysis of risk score and clinicopathological characteristics. (D) The integrated ROC curves of risk score and clinical features; (C) The nomogram of 1-year, 3-year or 5-year survival predictability based on risk score, age, and TNM stage. |
Drug Sensitivity Analysis of ARlncRNAs
To further explore the usage of our signature in the clinical setting, we applied drug sensitivity analysis using “pRRophetic” package in software R to predict the IC50 of the conventional chemotherapy agent as well as targeted therapy between high-risk and low-risk groups. We found that low-risk group patients are more sensitive to Gemcitabine, Gefitinib, and Erlotinib (Figure 10B, D and E), indicating a better drug response in the low-risk group. High-risk group patients had a better response in treating with Paclitaxel (Figure 10C). For Cisplatin, there was no significant difference between the two group (Figure 10A).
Functional Analysis
GSEA was then applied to find the relevant gene ontology terms and KEGG pathways involved between the high and low risk groups. For GO analysis, a total of 147 GO terms were significantly upregulated in the high risk group and 324 downregulated in the high risk group (P<0.001). The most concentrated biological processes included cell metabolism, cell division, as well as T-cell selection (Figure 7A and B, Supplementary Table S3). For KEGG analysis, a total of 20 pathways were significantly enriched, among which 14 were upregulated in the high risk group. The enriched pathways were mostly related with the p53 signaling pathway, sugar metabolism, protein export, DNA replication, and JAK-STAT signaling pathway (Figure 7C and D, Supplementary Table S3). Moreover, most of the GO terms and KEGG pathways enriched in our analysis were found to be closely related to the occurrence and development of lung adenocarcinoma, indicating that the five lncRNA may play a role in lung cancer development.
 |
Figure 7 The functional enrichment analysis based on autophagy-related lncRNAs. (A) Upregulated gene ontology terms in high risk group; (B) Upregulated gene ontology terms in low risk group; (C) Upregulated KEGG pathways in high risk group; (D) Upregulated KEGG pathways in low risk group. |
Multi-Omics Validation of the lncRNA Signature and the Correlated Genes
In correlation analysis, we found BIRC6 (AL606489.1), TSC2 (AL691432.2), CFLAR (HLA-DQB1-AS1), GAPDH (LINC01116), and MLST8 (LINC01137) to have the highest correlation coefficient with each of our included lncRNA (Supplementary Table S2). When searching the expression data of the included five lncRNA in GEPIA, only HLA-DQB1-AS1, LINC01116, and LINC01137 were available. Thus, we applied GEPIA and HPA databases to explore the expression level (mRNA and protein) as well as the clinical significance of three pairs (CFLAR-HLA-DQB1-AS1, GAPDH-LINC01116, and MLST8-LINC01137). The mRNA expression level from GEPIA showed that CFLAR (Figure 8C) and HLA-DQB1-AS1 (Figure 8A) had a significantly lower expression level in LUAD patients, while GADPH (Figure 8G) had a higher expression in tumor samples. As for the other three, a slightly higher expression in tumor samples was observed (Figure 8E, I and K). Survival analysis showed patients with low expression of LINC01116 (Figure 8F), GADPH (Figure 8H), and LINC01137 (Figure 8J) were associated with a favorable outcome, which was consistent with our previous results. As for HLA-DQB1-AS1 (Figure 8B), CFLAR (Figure 8D), and MLST8 (Figure 8L), there was no significant difference in survival outcome. Furthermore, we used Spearman correlation analysis to re-test this correlation between lncRNA and its correlated genes. The results showed all three pairs were significantly associated only in the tumor sample but not in normal tissues (Figure 9A–F). Finally, the HPA database was used to determine the protein expression level of CFLAR, GADPH, and MLST8. The result indicated that GADPH and MLST8 have positive expression in the tumor sample, which is consistent with mRNA expression, while CFLAR has a higher protein expression level than that of its mRNA in the tumor sample (Figure 9G–L).
 |
Figure 8 Validation of CFLAR-HLA-DQB1-AS1, GAPDH-LINC01116 and MLST8-LINC01137 in GEPIA database. (A) The mRNA expression levels of HLA-DQB1-AS1; (B) Kaplan–Meier survival analysis of HLA-DQB1-AS1; (C) The mRNA expression levels of CFLAR; (D) Kaplan–Meier survival analysis of CFLAR; (E) The mRNA expression levels of LINC01116; (F) Kaplan–Meier survival analysis of LINC01116; (G) The mRNA expression levels of GADPH; (H) Kaplan-Meier survival analysis of GADPH; (I) The mRNA expression levels of LINC01137; (J) Kaplan–Meier survival analysis of LINC01137; (K) The mRNA expression levels of MLST8; (L) Kaplan–Meier survival analysis of MLST8. *P<0.05. |
 |
Figure 9 Correlation test in GEPIA and protein expression in HPA. (A) Spearman correlation tests for CFLAR-HLA-DQB1-AS1 in normal lung sample; (B) Spearman correlation tests for CFLAR-HLA-DQB1-AS1 in tumor sample; (C) Spearman correlation tests for GAPDH-LINC01116 in normal lung sample; (D) Spearman correlation tests for GAPDH-LINC01116 in tumor sample; (E) Spearman correlation tests for MLST8-LINC01137 in normal lung sample; (F) Spearman correlation tests for MLST8-LINC01137 in tumor sample; (G) the expression level of CFLAR in normal lung sample; (H) the expression level of CFLAR in tumor sample; (I) the expression level of GAPDH in normal lung sample; (J) the expression level of GAPDH in tumor sample; (K) the expression level of MLST8 in normal lung sample; (L) the expression level of MLST8 in tumor sample. |
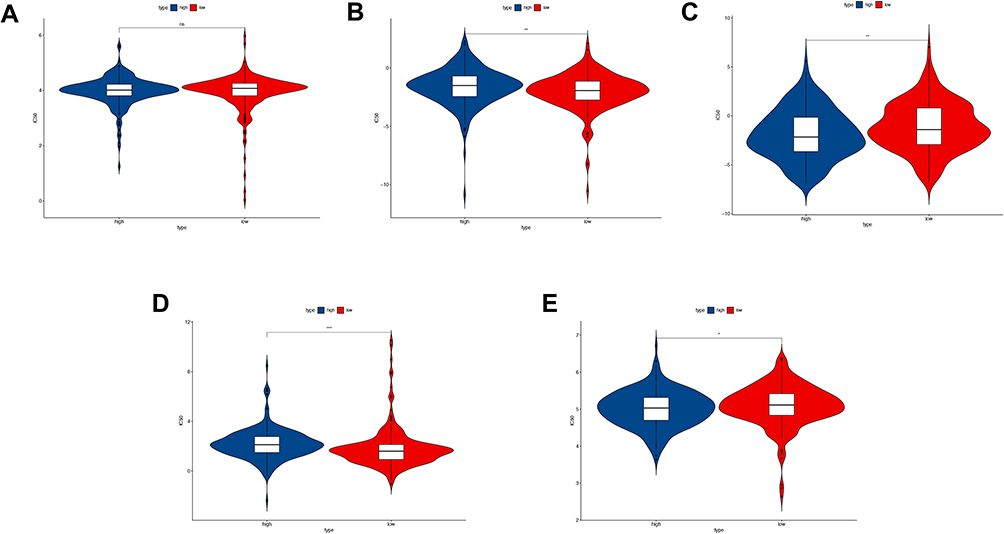 |
Figure 10 Drug sensitivity analysis between high-risk and low-risk group. (A) The IC50 of Cisplatin between the two groups; (B) The IC50 of Gemcitabine between the two groups; (C) The IC50 of Paclitaxel between the two groups; (D) The IC50 of Gefitinib between the two groups; (E) The IC50 of Erlotinib between the two groups. ns: no significance, *P<0.05, **P<0.01; ***P<0.001. |
Discussion
With the development of novel treatment options in recent years, the overall survival time of lung cancer patients improves greatly. However, recurrence and metastasis remain the major cause of patients’ mortality. Autophagy, a process that degrades and recycles cellular components to maintain homeostasis, has been extensively studied in cancer research owing to its role in cancer development.13,14 Similarly, researchers also put a lot of emphasis on lncRNA for it played a crucial role in tumorigenesis in various cancers and may serve as biomarkers in cancer diagnosis and prognosis.15 For example, a prognostic model based on lncRNA was established for lung adenocarcinoma with the potential for future clinical practice.16 Thus, this led us to find if there were potential specific ARlncRNAs signatures that can be used to predict patients’ prognosis.
In our study, we established a risk model of five autophagy‐related lncRNAs as an independent tool to predict a patients’ survival using Lasso and multivariate Cox regression (LINC01137, AL691432.2, LINC01116, AL606489.1, and HLA-DQB1-AS1). So far, among the five ARlncRNA in our risk model, only LINC01116 and HLA-DQB1-AS1 had been found to be related with cancer. HLA-DQB1-AS1 has been found to be a protective immune-related lncRNA in LUAD patients which is consistent with our study that it has a low expression in the high risk group.17 The correlated gene with HLA-DQB1-AS1 is CFLAR (CASP8 and FADD-like apoptosis regulator), which is an inhibitor of CASP8. Studies showed CFLAR had a higher expression in lung adenocarcinoma and this upregulation may result in an inhibition of CASP8-induced apoptosis.18,19 In the present study, we found HLA-DQB1-AS1-CFLAR was positively correlated and HLA-DQB1-AS1 served as a protective molecule for patients with LUAD.
For LINC01116, numerous studies have identified its vital role in tumorigenesis, proliferation, and drug resistance in various cancers such as glioma, breast cancer, gastric cancer, ovarian cancer, and lung cancer.20–26 Zeng et al26 found LINC01116 was overexpressed in LUAD patients and this contributes to tumor proliferation and metastasis. In another study, LINC01116 was found to be involved in the miR-744-5p/SCN1B axis which resulted in the progression of lung squamous carcinoma.27 Additionally, LINC01116 contributes to gefitinib resistance by regulating the IFI44 expression.24 Moreover, LINC01116 has also been found in cisplatin resistance via the EMT process28 in lung adenocarcinoma, which is consistent with our result that it serves as a risk factor in patients’ prognosis. GAPDH (glyceraldehyde-3-phosphate dehydrogenase) functions in a multiple biological process such as glycolysis, RNA transport, nuclear transcription, and apoptosis. Studies found that the upregulation of GAPDH is significantly related to the proliferation and invasion of lung cancer29 and it can also be used as a biomarker for early diagnosis of cervical cancer.30 Taken together, we believe that the GADPH-LINC01116 axis plays a positive role in lung cancer and more biochemistry experiments are needed to test this idea.
LINC01137 was previously found to be an immune-related biomarker in the diagnosis of psoriasis and also an indicator for chemical stress response31,32 and the upregulation of it may result in poor overall survival. MLST8 (MTOR Associated Protein, LST8 Homolog) is an essential part of the mTORC1 pathway and has the ability to enhance the mTOR kinase activity.33 A previous study has identified that overexpression of MLST8 is associated with tumor progression in colon and prostate cancer via the mTORC1 complex.34 Moreover, clinical data showed that rs26865 and rs3160 polymorphic variants of MLST8 in lung cancer patients indicated a more likely brain metastasis.35 Thus, the two molecules may serve as potential biomarkers to predict a patient’s brain metastasis, which will have a huge impact on clinical practice.
With respect to clinical significance, the AUC value for 1-year, 3-years, and 5-years was 0.735, 0.672, and 0.662 respectively, which indicates a certain reliability in predicting patients’ survival. Multivariate Cox analyses also reveal that the risk score generated from our model can be used as an independent prognostic indicator. Taken together, we believe this signature has the potential to predict a patients’ survival.
Functional enrichment analysis showed that the most significantly enriched biological proceses (BP) were autophagy-related metabolism and immune related T-cell selection. For KEGG pathway analysis, p53 and JAK/STAT signaling pathways were significantly enriched and both known to be involved in various cancers. The P53 signaling pathway has been widely studied in cancer research and it plays an important role in regulating autophagy. Studies showed that either blocking p53 expression with molecule agents or applying a p53-knockout cell line will result in enhanced autophagy.36 Further, inhibition of p53 degradation may prevent autophagy, suggesting an apoptotic role of autophagy.37 JAK/STAT is another signaling pathway that has been well studied in tumorigenesis. In lung cancer, nearly 55% of patients and most lung cancer cell lines were found to have a much higher expression of STAT3 and this overexpression of STAT3 had a close relationship with the occurrence of lung cancer.38 Further, a study conducted by Sun et al39 suggested that the activation of JAK1/STAT1 had a positive correlation with a patients’ TNM stage, especially with nodal metastasis. Even if there are no relevant studies which indicate a potential relationship between the lncRNAs and the signaling pathways, we will continue to study this potential mechanism in our future work.
Several limitations still remain in our work. First of all, the small number of patients included in our study indicates that the results may not be extrapolatable to a larger population. Second, a prospective study is needed to test the availability of the established prognostic model in our study. Third, we did not run an experiment to quantify the expression of lncRNA or test the potential signaling pathways, indicating the need for solid verification measures.
Conclusion
In conclusion, our study provided a comprehensive analysis of ARlncRNA in lung adenocarcinoma and constructed a co-expression network which indicates a potential mechanism underlying the autophagy-related lncRNA. The ARlncRNAs based prognostic signature significantly correlated with a patient’s survival and the subsequent risk score was an independent prognostic factor for lung adenocarcinoma patients. Besides, the associated genes with the included lncRNA were also found to be potential therapeutic targets for LUAD patients. In summary, the prognostic model generated from five autophagy-related lncRNAs was an independent factor to predict a patients’ prognosis and the related genes might be potential biomarkers and therapeutic targets for the patients with lung adenocarcinoma.
Acknowledgment
We appreciate Yun Zhao for her kind help of drug sensitivity analysis and language editing in the manuscript.
Disclosure
The authors declare that they have no conflicts of interest for this work.
References
1. Jemal A, Bray F, Center MM, Ferlay J, Ward E, Forman D. Global cancer statistics. CA Cancer J Clin. 2011;61(2):69–90. doi:10.3322/caac.20107
2. Sholl LM. The molecular pathology of lung cancer. Surg Pathol Clin. 2016;9(3):353–378. doi:10.1016/j.path.2016.04.003
3. Hsu HC, Li SJ, Chen CY, Chen MF. Eicosapentaenoic acid protects cardiomyoblasts from lipotoxicity in an autophagy-dependent manner. Cell Biol Toxicol. 2018;34(3):177–189. doi:10.1007/s10565-017-9406-9
4. Levine B, Kroemer G. Biological functions of autophagy genes: a disease perspective. Cell. 2019;176(1–2):11–42. doi:10.1016/j.cell.2018.09.048
5. Tsai WT, Lo YC, Wu MS, et al. Mycotoxin patulin suppresses innate immune responses by mitochondrial dysfunction and p62/Sequestosome-1-dependent mitophagy. J Biol Chem. 2016;291(37):19299–19311. doi:10.1074/jbc.M115.686683
6. Mah LY, Ryan KM. Autophagy and cancer. Cold Spring Harb Perspect Biol. 2012;4(1):a008821. doi:10.1101/cshperspect.a008821
7. Goldberg SB, Supko JG, Neal JW, et al. A Phase I study of erlotinib and hydroxychloroquine in advanced non-small-cell lung cancer. J Thorac Oncol. 2012;7(10):1602–1608. doi:10.1097/JTO.0b013e318262de4a
8. Bhan A, Soleimani M, Mandal SS. Long noncoding RNA and cancer: a new paradigm. Cancer Res. 2017;77(15):3965–3981. doi:10.1158/0008-5472.CAN-16-2634
9. Liu Y, Sharma S, Watabe K. Roles of lncRNA in breast cancer. Front Biosci. 2015;7(1):94–108. doi:10.2741/s427
10. Thin KZ, Liu X, Feng X, Raveendran S, Tu JC. LncRNA-DANCR: a valuable cancer related long non-coding RNA for human cancers. Pathol Res Pract. 2018;214(6):801–805. doi:10.1016/j.prp.2018.04.003
11. Gibb EA, Brown CJ, Lam WL. The functional role of long non-coding RNA in human carcinomas. Mol Cancer. 2011;10(1):38. doi:10.1186/1476-4598-10-38
12. Tang Z, Li C, Kang B, Gao G, Li C, Zhang Z. GEPIA: a web server for cancer and normal gene expression profiling and interactive analyses. Nucleic Acids Res. 2017;45(W1):W98–W102. doi:10.1093/nar/gkx247
13. Shintani T, Klionsky DJ. Autophagy in health and disease: a double-edged sword. Science. 2004;306(5698):990–995. doi:10.1126/science.1099993
14. White E, DiPaola RS. The double-edged sword of autophagy modulation in cancer. Clin Cancer Res. 2009;15(17):5308–5316. doi:10.1158/1078-0432.CCR-07-5023
15. Jin KT, Lu ZB, Lv JQ, Zhang JG. The role of long non-coding RNAs in mediating chemoresistance by modulating autophagy in cancer. RNA Biol. 2020;17(12):1727–1740. doi:10.1080/15476286.2020.1737787
16. Zeng L, Wang W, Chen Y, et al. A five-long non-coding RNA signature with the ability to predict overall survival of patients with lung adenocarcinoma. Exp Ther Med. 2019;18(6):4852–4864. doi:10.3892/etm.2019.8138
17. Jin D, Song Y, Chen Y, Zhang P. Identification of a seven-lncRNA immune risk signature and construction of a predictive nomogram for lung adenocarcinoma. Biomed Res Int. 2020;2020:7929132. doi:10.1155/2020/7929132
18. Wilson TR, Redmond KM, McLaughlin KM, et al. Procaspase 8 overexpression in non-small-cell lung cancer promotes apoptosis induced by FLIP silencing. Cell Death Differ. 2009;16(10):1352–1361. doi:10.1038/cdd.2009.76
19. Kaminskyy VO, Surova OV, Piskunova T, et al. Upregulation of c-FLIP-short in response to TRAIL promotes survival of NSCLC cells, which could be suppressed by inhibition of Ca2+/calmodulin signaling. Cell Death Dis. 2013;4(3):e522. doi:10.1038/cddis.2013.51
20. Chen J, Yuan ZH, Hou XH, Shi MH, Jiang R. LINC01116 promotes the proliferation and inhibits the apoptosis of gastric cancer cells. Eur Rev Med Pharmacol Sci. 2020;24(4):1807–1814. doi:10.26355/eurrev_202002_20358
21. Fang YN, Huang ZL, Li H, et al. LINC01116 promotes the progression of epithelial ovarian cancer via regulating cell apoptosis. Eur Rev Med Pharmacol Sci. 2018;22(16):5127–5133. doi:10.26355/eurrev_201808_15707
22. Su X, Zhang J, Luo X, et al. LncRNA LINC01116 promotes cancer cell proliferation, migration and invasion in gastric cancer by positively interacting with lncRNA CASC11. Onco Targets Ther. 2019;12:8117–8123. doi:10.2147/OTT.S208133
23. Wang T, Cao L, Dong X, et al. LINC01116 promotes tumor proliferation and neutrophil recruitment via DDX5-mediated regulation of IL-1beta in glioma cell. Cell Death Dis. 2020;11(5):302. doi:10.1038/s41419-020-2506-0
24. Wang H, Lu B, Ren S, et al. Long noncoding RNA LINC01116 contributes to gefitinib resistance in non-small cell lung cancer through regulating IFI44. Mol Ther Nucleic Acids. 2020;19:218–227. doi:10.1016/j.omtn.2019.10.039
25. Ye J, Zhu J, Chen H, et al. A novel lncRNA-LINC01116 regulates tumorigenesis of glioma by targeting VEGFA. Int J Cancer. 2020;146(1):248–261. doi:10.1002/ijc.32483
26. Zeng L, Lyu X, Yuan J, et al. Long non-coding RNA LINC01116 is overexpressed in lung adenocarcinoma and promotes tumor proliferation and metastasis. Am J Transl Res. 2020;12(8):4302–4313.
27. Fan X, Sun Y, Guo X, He C, Han B, Sun X. Long non-coding RNA LINC01116 regulated miR-744-5p/SCN1B axis to exacerbate lung squamous cell carcinoma. Cancer Biomark. 2020;28(4):473–482. doi:10.3233/CBM-190945
28. Wang J, Gao J, Chen Q, et al. LncRNA LINC01116 contributes to cisplatin resistance in lung adenocarcinoma. Onco Targets Ther. 2020;13:9333–9348. doi:10.2147/OTT.S244879
29. Hao L, Zhou X, Liu S, et al. Elevated GAPDH expression is associated with the proliferation and invasion of lung and esophageal squamous cell carcinomas. Proteomics. 2015;15(17):3087–3100. doi:10.1002/pmic.201400577
30. Xu ML, Kim HJ, Kim SC, et al. Serum anti-GAPDH autoantibody levels reflect the severity of cervical lesions: a potential serum biomarker for cervical cancer screening. Oncol Lett. 2019;18(1):255–264. doi:10.3892/ol.2019.10326
31. Fan F, Huang Z, Chen Y. Integrated analysis of immune-related long noncoding RNAs as diagnostic biomarkers in psoriasis. PeerJ. 2021;9:e11018. doi:10.7717/peerj.11018
32. Tani H, Numajiri A, Aoki M, Umemura T, Nakazato T. Short-lived long noncoding RNAs as surrogate indicators for chemical stress in HepG2 cells and their degradation by nuclear RNases. Sci Rep. 2019;9(1):20299. doi:10.1038/s41598-019-56869-y
33. Kakumoto K, Ikeda J, Okada M, Morii E, Oneyama C. mLST8 promotes mTOR-mediated tumor progression. PLoS One. 2015;10(4):e0119015. doi:10.1371/journal.pone.0119015
34. Sapam TD, Velmurugan Ilavarasi A, Palaka BK, Elumalai E, Kanika ND, Ampasala DR. Identifying novel small molecule antagonists for mLST8 protein using computational approaches. J Recept Signal Transduct Res. 2018;38(1):1–11. doi:10.1080/10799893.2017.1387920
35. Xu Y, Huang Y, Weng L, et al. Effects of single-nucleotide polymorphisms in the mTORC1 pathway on the risk of brain metastasis in patients with non-small cell lung cancer. J Cancer Res Clin Oncol. 2020;146(1):273–285. doi:10.1007/s00432-019-03059-y
36. Komarov PG, Komarova EA, Kondratov RV, et al. A chemical inhibitor of p53 that protects mice from the side effects of cancer therapy. Science. 1999;285(5434):1733–1737. doi:10.1126/science.285.5434.1733
37. Nikoletopoulou V, Markaki M, Palikaras K, Tavernarakis N. Crosstalk between apoptosis, necrosis and autophagy. Biochim Biophys Acta. 2013;1833(12):3448–3459. doi:10.1016/j.bbamcr.2013.06.001
38. Yu H, Jove R. The STATs of cancer–new molecular targets come of age. Nat Rev Cancer. 2004;4(2):97–105. doi:10.1038/nrc1275
39. Sun Y, Han Y, Wang X, et al. Correlation of EGFR Del 19 with Fn14/JAK/STAT signaling molecules in non-small cell lung cancer. Oncol Rep. 2016;36(2):1030–1040. doi:10.3892/or.2016.4905
 © 2021 The Author(s). This work is published and licensed by Dove Medical Press Limited. The
full terms of this license are available at https://www.dovepress.com/terms
and incorporate the Creative Commons Attribution
- Non Commercial (unported, 3.0) License.
By accessing the work you hereby accept the Terms. Non-commercial uses of the work are permitted
without any further permission from Dove Medical Press Limited, provided the work is properly
attributed. For permission for commercial use of this work, please see paragraphs 4.2 and 5 of our Terms.
© 2021 The Author(s). This work is published and licensed by Dove Medical Press Limited. The
full terms of this license are available at https://www.dovepress.com/terms
and incorporate the Creative Commons Attribution
- Non Commercial (unported, 3.0) License.
By accessing the work you hereby accept the Terms. Non-commercial uses of the work are permitted
without any further permission from Dove Medical Press Limited, provided the work is properly
attributed. For permission for commercial use of this work, please see paragraphs 4.2 and 5 of our Terms.