Back to Journals » International Journal of Nanomedicine » Volume 14
A Dual-Modality MR/PA Imaging Contrast Agent Based on Ultrasmall Biopolymer Nanoparticles for Orthotopic Hepatocellular Carcinoma Imaging
Authors Sun J, Li X ![]() , Chen A, Cai W, Peng X, Li L, Fan B, Wang L, Zhang H, Zhang R
, Chen A, Cai W, Peng X, Li L, Fan B, Wang L, Zhang H, Zhang R
Received 17 June 2019
Accepted for publication 13 November 2019
Published 16 December 2019 Volume 2019:14 Pages 9893—9904
DOI https://doi.org/10.2147/IJN.S219794
Checked for plagiarism Yes
Review by Single anonymous peer review
Peer reviewer comments 2
Editor who approved publication: Dr Linlin Sun
Jinghua Sun,1,2,* Xiaoyan Li,2,* Anqi Chen,2,* Wenwen Cai,2 Xiaoyang Peng,1 Liping Li,3 Bo Fan,3 Lingjie Wang,2 Huanhu Zhang,4 Ruiping Zhang2
1Center for Translational Medicine Research, Shanxi Medical University, Taiyuan 030001, People’s Republic of China; 2Imaging Department, The Affiliated Da Yi Hospital of Shanxi Medical University, Taiyuan 030000, People’s Republic of China; 3Shanxi Medical University, Taiyuan 030001, People’s Republic of China; 4The Affiliated Tumor Hospital of Shanxi Medical University, Taiyuan 030000, People’s Republic of China
*These authors contributed equally to this work
Correspondence: Ruiping Zhang
The Affiliated Da Yi Hospital of Shanxi Medical University, No. 99, Longcheng Street, Taiyuan, Shanxi 030000, People’s Republic of China
Email [email protected]
Huanhu Zhang
The Affiliated Tumor Hospital of Shanxi Medical University, No. 3 ZhiGongXinCun, Taiyuan, Shanxi 030000, People’s Republic of China
Email [email protected]
Background: Hepatocellular carcinoma (HCC) is the second leading cause of cancer death and early stage diagnosis can greatly increase the survival rate of patient. However, the accurate detection of HCC remains an urgent challenge in medical diagnosis. The combination of magnetic resonance imaging (MRI) and photoacoustic imaging (PAI) are conducive for accurate locating of cancerous tissue. Therefore, it is necessary to explore a more facile and biosafe dual-modal contrast agent for orthotopic HCC detection.
Methods: In this study, a promising contrast agent had been identified based on gadolinium chelated melanin nanoparticles and evaluated its usage as a dual-modal T1 MRI and PAI contrast agent for orthotopic HCC detection.
Results: The gadolinium-based melanin nanoparticles presented ultrasmall size, high chelation stability and negligible cytotoxicity estimated by CCK-8 assay. Moreover, the nanoparticle exhibited higher r1 relaxivity (45.762 mM−1 s−1) than clinically approved Gadodiamide (4.975 mM−1 s−1) at 1.5 T MR scanning. A linear regression analysis confirmed that the nanoparticles were ideal candidates for PAI in vitro. After the nanoparticles were injected into vein in mice with orthotopic HCC, a dramatic increase in signal of the liver was observed at 0.5 hr by MRI and PAI, while the tumor exerted remarkable signal enhancement at 7 hrs, showing excellent detection sensitivity. In addition, the nanoparticles exhibited excellent biocompatibility and they can be excreted through both hepatobiliary and renal pathways after diagnosis.
Conclusion: These results indicate that the ultrasmall gadolinium chelated melanin nanoparticles is a promising candidate as a dual-modal MRI/PAI contrast agent for the detection of orthotopic HCC.
Keywords: melanin nanoparticles, gadolinium, magnetic resonance imaging, photoacoustic imaging, orthotopic hepatocellular carcinoma
Introduction
Hepatocellular carcinoma (HCC) is the second leading cause of cancer death after lung cancer over the world.1 Early specific diagnosis accompanied by timely curative treatments can reduce liver cancer mortality and increase the median 5-year survival rate of patients from 5% to over 50%.2–4 However, currently there is no reliable and sensitive way to detect HCC at early stages, thus the accurate detection of HCC remains one of the most urgent challenges in medical diagnosis. Among all noninvasive molecular and functional imaging techniques, magnetic resonance imaging (MRI), as one of the most prominent clinical imaging techniques, can produce valuable medical images for early cancer diagnosis, providing noninvasive anatomical and physiological information with high spatial and temporal resolution.5,6 Clinically, more than 35% of MRI scans use contrast agents and gadolinium (Gd)-based contrast agents have attracting substantial attention as T1-weighted MRI contrast agents owning to the paramagnetic property induced by seven unpaired electrons of Gd3+, which shorten the longitudinal relaxation time of water protons and increase tissue contrast.7–10 Currently, all clinically approved Gd3+-containing contrast agents are based on small molecules with relaxivity r1 values around 4–6 mM−1·s−1. However, their low relaxivities, non-specificity to target, quick removal by excretion, and instability in vivo severely limit the application of MRI in clinic.11,12 Gd-based nanomaterials have been extensively developed as a new generation of MRI contrast agents exhibiting enhanced relaxivities and high accumulation in tumor for cancer diagnosis,12–14 while some issues including complexity of preparation, stability and biosafety still limit their further use in clinical research.
Although MRI is one of the most common modalities for imaging, poor sensitivity may hinder its application for accurate tumor diagnosis.15,16 Photoacoustic (PA) imaging, combing spectral selectivity of laser light and high resolution of ultrasound detection, with high sensitivity, background-free detection and high spatial resolution, can overcome this limitation.17–19 MRI can rapidly screen to locate the potential lesions, while PAI can provide high-resolution morphological structure and molecular information in high sensitivity; thus, it is undoubted that the combination of MRI and PAI would conduce to accurate locating of cancerous tissue. Currently, some Gd-based nanomaterials have been exploited for MR/PA dual-model imaging contrast agent with properties of both strong magnetization and excellent light absorption, such as Gd-integrated CuS@bovine serum albumin nanoparticles,20 gadolinium-conjugated polypyrrole nanoparticles,21 polymer-based gadolinium oxide nanocomposites,22 monodisperse Gd2O3/Bi2S3 hybrid nanodots,23 Gd3+-doped MoSe2 nanosheets,24 and so on. Despite these contrast agents present exciting potential in cancer diagnosis, the non-biodegradability and potential long-term toxicity remarkably impeded their progress for future clinical application. Besides, the diagnostic efficiency should be further investigated because these dual-modal contrast agents have been intensively studied only in ectopic and not in orthotopic tumor models, while the physiological environment of orthotopic and ectopic xenografts are different. Therefore, it is necessary to explore a Gd-based MR/PA dual-modal contrast agent with simple synthesis, high sensitivity and good biosafety for the early diagnosis of orthotopic HCC.
Compared with exogenous materials, endogenous biomaterials in organism have excellent biosafety in vivo due to their native biocompatibility and biodegradability. Melanin nanoparticles, endowing unique properties including metal ion chelation, strong optical absorption in the near-infrared region, free radical quenching, photo-protection and biocompatibility, have many potential applications in biomedicine.25–27 However, the natural melanin had poor solubility, and the reported melanin or melanin-like nanoparticles mainly displayed larger size (more than 100 nm),28,29 which largely increased the difficulty of biodegradation and metabolism in vivo. Recently, we have synthesized water-soluble and undersize melanin nanoparticles (about 10 nm) for multimodality imaging.30 While the nanoparticles were cleared by liver, not the kidney. Herein, we constructed the ultrasmall size (about 4.9 nm) and water-soluble Gd-based melanin nanoparticles (termed as MPGds) by a facile route as an MR/PA dual-modal imaging contrast agent for the early stage detection of orthotopic HCC. The synthesis scheme and application are shown in Figure 1. In vitro experimental results show that the Gd-based melanin nanoparticles had small size, excellent chemical stability, reasonable biocompatibility, strong T1-weighted MRI and PAI enhancing capacity. Cellular uptake was confirmed with bio-transmission electron microscopy (Bio-TEM), laser scanning confocal microscope (LSCM) and flow cytometric analysis. The small animal experiments in orthotopic HCC mouse model demonstrate that the as-prepared MPGds exhibit excellent imaging ability and low toxicity, which also can be excreted through hepatobiliary and renal pathways. These experimental results indicate good prospects of MPGds as a dual-modal contrast agent for clinical transformation.
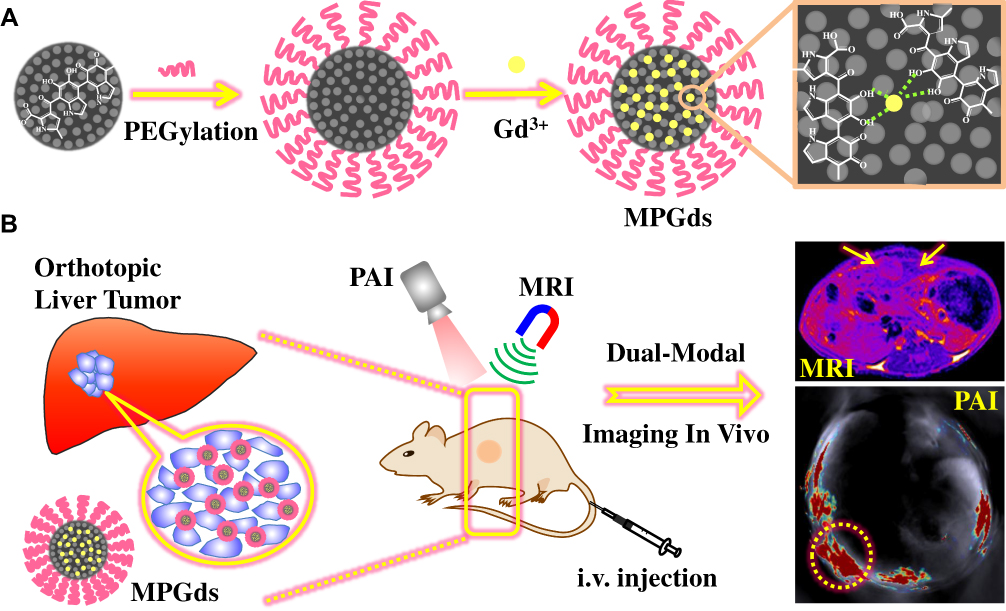 |
Figure 1 Synthesis scheme of MPGds contrast agent (A) and application in MRI/PAI dual-modal imaging for orthotopic HCC (B). |
Materials and Methods
Materials
The following materials were acquired: melanin was purchased from Sigma-Aldrich. Gadolinium(III)chloride hexahydrate (GdCl3·6H2O), sodium hydroxide (NaOH) and hydrochloric acid (37 wt% HCl) were acquired from Sinopharm Chemical Reagent Beijing Co., Ltd. Amine-PEG5000-amine (NH2-PEG5000-NH2, 5 kDa) was obtained from Shanghai Zzbio Co., Ltd. Phosphate-buffered saline (PBS) and 4,6-diamidino-2-phenylindole (DAPI) was purchased from Boster biological Technology Co., Ltd. Fluorescein isothiocyanate were acquired from ACROS (90%, FITC). All agents were of analytical grade and used directly without further purification. Deionized (DI) water was used for all experimental procedures.
Preparation and Characterization of MPGds
Melanin nanoparticles (MNP) were obtained according to the previously published method with some modification.30 In a typical reaction, the 2 mg melanin was dissolved in an aqueous solution of NaOH (0.1 M), and then the pH was adjusted to a neutral partial alkali by dropwise addition of an aqueous HCl solution (0.1 M), followed by sonication with the high amplitude about 60%. The mixed solution was centrifuged and washed several times using 10 kDa (molecular weight cut off) MWCO filters, and finally lyophilized to obtain a powdery MNP. In order to improve the biocompatibility and physiological stability of MNP, an aqueous solution of MNP (1 mg/mL) having a pH of 9.5 was added dropwise to an aqueous solution of NH2-PEG5000-NH2. After magnetic stirring overnight, the mixed solution was centrifuged and washed several times to obtain PEGylated MNP.
0.5 mL of GdCl3 solution (10 mg/mL) was added to 1 mL the PEGylated MNP (2 mg/mL in solution) and stirred at room temperature for 2 hrs. The final Gd3+-loaded PEGylated MNP (MPGds) were centrifuged and washed with DI water 3 times to remove the free Gd3+ ions.
Transmission electron microscopy (TEM) of MPGds was measured using a JEM-2100F microscope. Dynamic light scattering (DLS) (Zetasizer-90, Malvern Instruments) was applied to analyze the hydrodynamic diameter and zeta potential of the MPGds. The molecular weight of melanin nanoparticles was measured by a Bruker Ultraflextreme matrix-assisted laser desorption/ionization–time of flight (MALDI-TOF)/TOF mass spectrometer (Bruker Daltonics, Inc., Billerica, MA). Absorbance measurements were acquired by a UV-Vis-NIR spectrometer (lambda-950, Perkin Elmer). The metal ions chelated stability was investigated by the dialysis experiment. The MPGds were placed in dialysis tube (MWCO 3500D) with PBS (pH = 7.4) at 37°C for 48 hrs followed magnetic stirring, dialysis against 10 mL PBS. At a certain time, dialysate was taken out for the analysis of metal ions content and replaced with fresh PBS solution. The Gd3+ concentration was quantified by inductively coupled plasma-atomic emission spectrometry (ICP-AES) using a Shimadzu ICPE 9000 instrument.
Cytotoxicity and Cellular Internalization of MPGds
HepG2 cells were originally purchased from Type Culture Collection of the Chinese Academy of Sciences, Shanghai, China, and they were grown in normal DMEM culture medium with 10% fetal bovine serum (FBS) and 1% penicillin–streptomycin at 37°C under 5% CO2. The cell morphology was monitored and cell passaging was done timely.
In vitro Cytotoxicity Assay
HepG2 cells suspensions were seeded into 96 well plates at the density of 1ⅹ104 cells per well under standard conditions (37°C, 5% CO2) and incubated overnight. Then, these cells were administered with different concentrations of MPGds and incubated for an additional 24 hrs. After that, the HepG2 cells were washed three times with PBS to remove residual nanoparticles and 10 µL of CCK-8 solution was added into each well to evaluate cell viability. After incubated with cells for another 2 hrs, the absorbance at 405 nm was measured using a microplate reader (Bio Tek, Epoch). Wells were analyzed in replicates (n=8).
Cell Uptake Behavior
Biological transmission electron microscopy (Bio-TEM), confocal laser scanning microscopy (CLSM) and flow cytometry were used to investigate the cell uptake behavior. HepG2 cells with the density of 2 × 10⁵/mL were incubated on a plate for 24 hrs. Then, 200 μg/mL of MPGds were added to the cells that were incubated for another 6 hrs. After being washed with PBS for several times, the cells were collected by centrifugation and fixed with 2% glutaraldehyde for 2 hrs. Bio-TEM specimens were prepared according to standard procedures and then observed using a TEM (JEM-1011) at 80 kV.
For CLSM imaging, 20 µL FITC solution (5 mg/mL) was added to 1 mL of 1 mg/mL PEGylated melanin aqueous solution and the mixture was stirred for 2 hrs at room temperature. After washed and centrifuged several times, the FITC-labeled MPGds were acquired and incubated with HepG2 cells for 6 hrs, and then the cells were washed with PBS for several times and fixed with 4% paraformaldehyde solution. Finally, the nuclei were stained with 300 μL of 400 nM DAPI and the cells were imaged with CLSM (FV1200, Olympus, Japan) using laser lines of 405 and 543 nm.
For fluorescent quantitative analysis, HepG2 cells were seeded into 6-well plates and incubated for 24 hrs. After rinsed with PBS for several times, the cells incubated with FITC-labeled MPGds for another 6 hrs. All cells were collected by centrifugation and analyzed by FACS Calibur flow cytometry.
In vitro Assessment of MR and PA Imaging
To evaluate MR contrast enhancement effect in vitro, Gd-content was measured with ICP-AES, prior to MR scanning and 300 μL of MPGds with various concentrations of gadolinium ions (0, 0.025, 0.05, 0.1, 0.2 and 0.4 mM) in aqueous solutions were imaged by a clinical 1.5 T MR clinical scanner (Magnetom Trio with Tim, Siemens) with a wrist surface coil (diameter 11 cm). T1-weight images (T1WI) were obtained using a sequence with the following parameters: field of view (FOV), 90 × 60 mm2; slice thickness, 1.5 mm; spacing, 0.5 mm; base matrix resolution, 256 × 256; repetition time (TR), 500 ms; and effective echo time (TE), 20 ms. The r1 relaxivity values were determined through the curve fitting of 1/T1 (s−1) versus the Gd component concentration (mM).
For PA imaging in vitro, it was performed with an MSOT inVision 128 small animal imaging system (iThera Medical GmbH, Munich, Germany). Briefly, phantoms were filled with the various concentration from 0.2 to 0.8 mM of MPGds nanoparticles. Then, phantoms were suspended inside a water tank and imaged at the 680–980 nm laser. Finally, the PA signals were measured in regions of interest (ROIs) for each sample and the correlation between the PA signal and concentration response curve was calculated.
Animal Tumor Model
This study was performed in strict accordance with the NIH guidelines for the care and use of laboratory animals (NIH Publication No. 85-23 Rev. 1985) and was approved by the Institutional Animal Use and Care Committee of Shan Xi Medical University (Approval No. 2016LL141, Taiyuan, China). Female nude mice (6–8 weeks) were purchased from Beijing Vital River Laboratory Animal Technology Co., Ltd. and housed in an isolated animal room with water and rodent food supplements to acclimate for one week before use. All animal experiments were conducted in accordance with the relevant laws and institutional guidelines following the approval of the Ethics Committee of Chinese Academy of Sciences.
In order to obtain a tumor entity, 3 × 106 KB HepG2 cells were suspended in 100 μL of PBS solution and injected subcutaneously into the axilla region of the nude mice (n=4). The tumor size was measured periodically using a slide caliper. When the tumor size is close to 1*1 cm, and the color is pink and white, the tissue has no necrosis and ulceration, the nude mice will take 0.3*0.3 cm tumor tissue as donors and provide tumor entities for nude mouse receptors. A 0.7 cm incision was made under the right costal margin of the recipient nude mouse, and then the peritoneal 0.9 cm incision was opened. The liver was pulled outward, and a slit was made in the thick part of the liver, and a 0.3 cm tumor body was placed in the slit. Surgical glue is applied to fix the tumor to the liver. When the surgical glue is dry, the peritoneum is sutured and the suture is closed. Observe any behavioral abnormalities of the animals daily and check the tumor size weekly. Nude mice were used for MRI and PAI studies when tumor size was greater than 0.5*0.5 cm.
In vivo Assessment of MR and PA Imaging
The distribution of MPGds in HCC regions and kidney was investigated with MRI and PAI. MR measurements were performed with a 3.0 T MRI equipment (Achieva, Philips) with a wrist surface coil (diameter 11 cm) and T1-weighted images were collected to confirm the distribution of MPGds. Mice were anesthetized via intraperitoneal injection of 1% pentobarbital sodium (40 mg/kg) maintaining a physiologic temperature of 37°C during imaging, followed by collecting the MR images as the data of pre-injection. Afterward, the mice (n=4) were intravenously injected with MPGds (4 mg/mL, 200 μL). The images of tumor location and kidney were collected at special time intervals 0.5 hr, 1 hr, 4 hrs, 7 hrs, 24 hrs, 72 hrs and 168 hrs. MR scans were performed in transversal orientations with following parameters: FOV, 90 × 60 mm2; slice thickness, 5 mm; spacing, 0.5 mm; base resolution matrix, 256 × 256; TR, 500 ms; and TE, 20 ms.
In vivo PAwas performed by a real-time MSOT imaging system (inVision 128, iThera Medical GmbH, Neuherberg, Germany). Mice bearing orthotopic HCC were anesthetized with isoflurane (mixture of 5% isoflurane and oxygen at 2 L/min) and collected PA signals as the data of pre-injection. After injection, the equal dose of MPGds, the images of tumor location and kidney were collected at the time interval 0.5 hr, 2 hrs, 4 hrs, 7 hrs, 24 hrs, 72 hrs and 168 hrs. In PAI tests in vivo, a volume ROI consisting of transverse slices with a step size of 0.3 mm spanning through the tumor region was selected by manual inspection of live MSOT images. The error bars in quantitative analysis represent the standard deviation of the measurements. Imaging analysis was performed using the Image J software.
In vivo Toxicity Analysis
Mice bearing orthotopic HCC were administrated intravenously with MPGds (4.0 mg/mL, 200 µL) by tail vein and sacrificed at 24 hrs post-injection (n=3). Subsequently, the main tissues (heart, liver, spleen, lung, kidney and tumor) were collected, weighted and decomposed in heat nitric acid to colorless solution. After diluted with diluted nitric acid solution (1%), the Gd concentration was measured by inductively coupled plasma-mass spectrometry (ICP-MS, Agilent 7900).
For histology analysis, mice were sacrificed after injection of MPGds for 5 days. Then, the main organs (heart, liver, spleen, lung and kidney) and tumor tissue were harvested and fixed in 4% formalin solution. After embedded in paraffin blocks and sectioned into slices at 8 μm thickness, the histological slices were stained with hematoxylin and eosin (H&E) and observed by an optical microscope (CX-31, Olympus, Japan).
Statistical Analysis
All results are reported as means ± SD and P<0.05 was viewed as statistically significant. All statistical analyses were performed using SPSS 22.0 for Windows (IBM Corporation, Armonk, NY, USA).
Results and Discussion
Preparation and Characterization of MPGds
Melanin nanoparticles were successfully prepared according the previous method with some modification.30 To further improve the biosafety and prolong the circulation time in the blood, NH2-PEG5000-NH2 was grafted the surface of melanin nanoparticles via Michael addition reaction.30,31 After chelated Gd3+ ions, the nano-contrast agent MPGds was obtained and the correlative characterizations of structure and property are shown in Figure 2. TEM image shows the particles were monodisperse and the size of synthesized MPGds was about 4.9 nm. In order to measure the actual-dispersed size in the PBS solution, the hydrodynamic size of MPGds was measured by DLS, which had the consistent result with TEM (Figure 2B). The zeta potential was also determined to −8.5±4.2 mV. Besides, the molecular weight of melanin nanoparticles was about 34 KDa according to the MALDI-TOF result (Figure S1), and the concentration of Gd3+ was obtained by the ICP results; thus, the number of chelated Gd3+ per MNP can be calculated to 58. To confirm the stability of metal ion chelation, the dialysis experiment was carried out shown in Figure 2C. The Gd3+ ions content was still up to 98% compared with the original value after 48 hrs exposed to the neutral solution, even under acidic condition, more than 97% of Gd3+ ions remained with MPGds, indicating the high chelation stability. The decrease of the first 2 hours results from the absorbed metal ions through weak electrostatic interaction. UV-Vis-NIR spectra of the MPGds in Figure 2D exhibited broad good absorbance performance from 680 nm to 980 nm, and the absorbance intensity enhanced with increasing the concentration of MPGds, which could be used a potential contrast agent for PAI.
 |
Figure 2 Characterization of MPGds. (A) TEM images of MPGds. (B) DLS results of MPGds dispersed in PBS. (C) The stability curves of MPGds in neutral and weak acidic pH values. (D) UV-Vis-NIR absorbance spectra of MPGds with various concentrations. |
Cellular Viability and Uptake Behavior
The biocompatibility of MPGds on HepG2 and NIH3T3 cells was evaluated by performing in vitro cell viability assay (CCK-8) shown in Figure 3A. The MPGds across the concentrations ranging from 0 to 800 μg/mL were incubated with HepG2 and NIH3T3 cells for 24 hrs. The CCK8 assay revealed no significant difference showing up to 90% cell viability at 800 μg/mL in two kinds of cells, demonstrating negligible toxicity for application in vivo.
The cellular uptake behavior was confirmed by bio-TEM, CLSM and flow cytometry analysis. Firstly, bio-TEM was used to observe the subcellular location of MPGds. As shown in Figure 3B, MPGds were effectively phagocytized by HepG2 cells, and mainly trapped into the cytosolic vesicles, such as the endosomes and lysosomes. Meanwhile, the cells were well-visualized with green fluorescence in merged CLSM image after 4 hrs of incubation with FITC-labeled MPGds, suggesting highly efficient intracellular accumulation of MPGds (Figure 3C). The successful FITC-labeling of MPGds has been confirmed by fluorescence spectra (Figure S2). Furthermore, the flow cytometry was used to quantify cellular uptake of MPGds (Figure 3D). The median fluorescence intensity was 15.5-fold stronger than that PBS group, which may be attributed to the enhanced cellular uptake efficiency.
 |
Figure 3 In vitro cell experiments. (A) Relative cell viability by CCK-8 assay of HepG2 and NIH3T3 cells incubated with different concentrations of MPGds for 24 hrs. (B) Bio-TEM image of HepG2 cells incubated with MPGds at 200 μg/mL for 6 hrs (scale bar =1 μm) and the nanoparticles can be seen in the organelle from magnified image in dotted box (yellow arrows). (C) CLSM images of MPGds in vitro. FITC-labeled MPGds (green) in the cytoplasm, cell nuclei (stained by DAPI, blue) and merged image. Scale bar: 50 μm. (D) Representative flow cytometric analysis of HepG2 cells before and after incubation with FITC-labelled MPGds at 200 μg/mL for 6 hrs. The mean fluorescence intensity (MFI) values was listed: 11.62 for control and 180.71 for FITC-labeled MPGds. |
In vitro MRI and PAI
MRI properties of the MPGds in vitro were evaluated on a clinical 1.5T MRI scanner. The spin-lattice MRI T1 contrast effect of MPGds was evaluated by comparing the r1 relaxivity with Gadodiamide, a commercial Gd based T1 contrast agents. The T1-weight images indicated that the positive contrast signal of MPGds was stronger than Gadodiamide at the same concentration (Figure 4A). The relaxivities r1, calculated from the slope of curves in Figure 4B, were measured to be 45.762 and 4.975 mM−1 s−1 in MPGds and Gadodiamide, respectively. Noticeably, it was about 10 times as high as commercial Gadodiamide, suggesting the potential of sensitive detection. The enhanced T1 contrast effects in MPGds were attributed to the increasing number of Gd3+ ions.
Melanin naturally absorbs light throughout spectral energy due to electric effect of heterogeneous macromolecules in its structures.32,33 This property becomes a powerful tool in PA imaging. The PA signals of MPGds solution with various concentration were collected and showed in Figure 4C. The signal intensity is mainly dependent on the concentration melanin and exhibited a linear increase (R2 = 0.96) with increasing MPGds concentration (Figure 4D), which could be an ideal candidate for PA imaging.
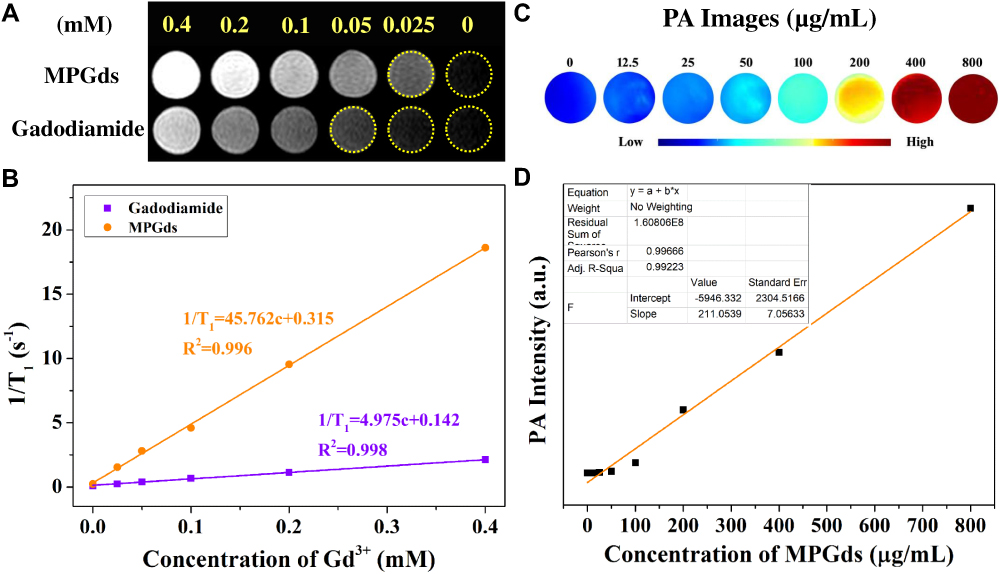 |
Figure 4 In vitro MR and PA imaging studies of MPGds. T1-weighted MR images (A) and relaxivity measurements (B) of MPGds and Gadodiamide with different Gd3+ concentrations (0.0125, 0.025, 0.05, 0.1, 0.2, 0.4 and 0.8 mM). The T1 relaxation rate as a function of Gd3+ concentrations. The measurements were performed on a 3.0 T MRI scanner at 35°C. (C) PA images of MPGds at various concentrations (12.5, 25, 50, 100, 200, 400 and 800 µg/mL). (D) PA signal intensity as a function of MPGds concentration using an MSOT imaging system. Inset: linear fitting data of PA signal intensity with various MNP concentrations. |
In vivo MRI and PAI
The diagnostic efficacy in vivo of the MPGds was demonstrated by enhanced signal difference between the normal liver and the tumor region using MR and PA scanning. MR/PA dual-modal imaging can combine MRI having high spatial resolution and PAI having excellent sensitivity for a precise clinical diagnosis. The orthotopic tumor models were established in this work because they have the advantage over xenograft (ectopic) tumor models in that tumor grows in a microenvironment similarly to the clinical condition. The MPGds (4 mg/mL, 200 µL) in PBS were intravenously injected into the mice in vein and subsequently, the tissue was observed by MR and PA imaging to evaluate the diagnostic ability. The axial T1-weighted MR images of mice preinjection and at various time points were recorded in Figure 5A. Before injection of MPGds, there was an insignificant signal difference between normal and tumor regions. After injection of MPGds, the normal liver tissue immediately brightened at 0.5 hrs, and the T1 intensity value obtained from the quantitative MR data was up to 150, which exhibited about a 1.4-fold enhanced MRI signal intensity relative to that of pre-injection due to the abundance of macrophages–Kupffer cells in liver.10,34 Then, the brightness decreased with extending the time and recovered the normal lever at 24 hrs. However, the brightness of the tumor tissue had little significant change until 7 hrs after injection of MPGds. The signal intensity in tumor has about 1.3-fold times enhancement compared to normal level. It was reported that the uptake of nanoparticles into normal hepatocytes mostly through organic anion-transporting polypeptide transporters (OATPs). However, OATPs are considerably reduced in HCC cells and the hepatic tumors contain fewer active macrophages and Kupffer cells compared to the surrounding normal liver tissues. Therefore, HCC cells had less uptake and appear hypointense to the normal liver at 0.5 hr.9,35 As time goes on, the tumor site showed gradually increased cumulation resulted from the existence of enhanced permeability and retention effect in solid tumor.36,37 This obvious difference of MR signal results in easily distinguishing the tumor from normal liver tissues, suggesting the as-prepared MPGds have excellent sensitivity and tumor-diagnostic ability. Besides, MR signals in liver and tumor are almost recovered to preinjection levels at 24 hrs and 72 hrs post-intravenous injection, respectively. The result also suggested efficient clearance of MPGds from the body and eliminable long-term toxicity.
The PA imaging at different time points (Pre, 0.5 hr, 2 hrs, 4 hrs, 7 hrs, 24 hrs, 72 hrs and 168 hrs) in an orthotopic liver tumor model was also shown in Figure 5B. The liver displayed a “ring-like” pattern in PA imaging and no signal can be seen in pre-injection. After administration, the normal live tissue exhibited maximum PA signal at 0.5 hr while the tumor tissues had a very weak signal, which can be distinguished from PA images. With time prolonging, the tumor had a gradual signal enhancement at 2 hrs and 4 hrs, which had not been observed in MR imaging, because PA imaging had high sensitivity. After 0.5 hr, the signal in normal liver decreased while the signal of tumor continued to increase. The signal intensity was up to the maximum value at 7 hrs, and then the signal weakened until it was gone, which was consistent with the MR results. As expected, the quantitative PA data further supported these results.
The results of MR and PA imaging all demonstrated that there was a marked signal difference between the normal liver and the tumor region due to the different uptake ability for MPGds, we could easily identify the tumors from normal liver tissues. Therefore, the MPGds demonstrated remarkable clinical potential used as the dual-modal contrast agent for the accurate detection of orthotopic HCC.
 |
Figure 5 In vivo MR and PA imaging studies of MPGds. (A) T1-weighted MR axial images and the corresponding data analysis of MR measurements of tumor-bearing mice before (pre) and at various time points (0.5 hr, 1 hr, 4.5 hrs, 7 hrs, 24 hrs, 72 hrs and 168 hrs) after injection of MPGds using 3.0 T clinical MRI equipment. The purple arrows point the tumor sites and the orange arrows point the liver. (B) PA images and the corresponding PA signal intensities in the tumor region collected by the MOST imaging system before (pre) and at various time points (0.5 hr, 2 hrs, 4 hrs, 7 hrs, 24 hrs, 72 hrs, and 168 hrs) after injection of MPGds. The green arrows point the liver and the yellow circles point the orthotopic tumor sites. Error bars mean standard deviations (n = 4). |
 |
Figure 6 Biosafety of MPGds. (A) Bio-distribution of MPGds in mouse organs at 24 hrs after intravenous injection (4 mg/mL, n = 3). (B) H&E stained liver and orthotropic liver tumor tissue. (C) H&E stained tissue sections from mice 24 hrs after injection with PBS and MPGds. Scale bar: 40 μm for all images. |
To explore the in vivo biosafety of MPGds, some indexes of mice were monitored. The nanoparticles were injected into mice via tail vein, after 24 hrs, the quantitative in vivo biodistribution of MPGds was evaluated by ICP-MS (Figure 6A). The main organs including heart, liver, spleen, lung, kidney and tumor were collected. The amounts of Gd in liver, spleen and kidney all exhibited high accumulation at 24 hrs. The clearance of MPGds in vivo can be further confirmed by MR/PA results at different time points after injection (Figure S3). Notably enhanced signal also can be found in kidney at 0.5 hr and the signal reached the maximum value at 1 hr. Then, the signal of kidney became weak with increasing the time and seemed to return to a similar contrast to that before administration at 24 hrs, suggesting the MPGds can be excreted through hepatobiliary and renal pathways with negligible toxicity to body tissues. It is reported that the nanoparticles smaller than 5.5 nm in diameter can undergo renal clearance,38,39 which also be confirmed in my results. Besides, the tumor also exhibited comparatively high Gd content. The in vivo biodistribution data revealed that MPGds owned good tumor accumulation and distinguished biosafety.
The in vivo toxicity of MPGds was tested with histology analysis. H&E strained image of liver and orthotropic liver tumor tissue is shown in Figure 6B, which can be seen clear boundary between normal liver tissue and hepatic tumor. The major organs (e.g., heart, liver, spleen, lung and kidney) of the mice after injected with PBS and MPGds were harvested at 24 hrs postinjection for a histochemical analysis. As shown in Figure 6C, comparing with the control group, the organs of the MPGds-treated mice show negligible lesions or abnormalities, indicating good biosafety. These results indicate the good biosafety of MPGds, which is important for clinical translation.
Conclusions
In conclusion, we designed and synthesized a dual-modal contrast agent based on Gd-chelated melanin nanoparticles for the detection of orthotopic HCC. It showed uniform size, good dispersibility and excellent stability. The experiment in vitro verified high uptake and negligible toxicity of the nanoparticles. Moreover, the nanoparticles not only exhibited high relaxivity and significant PA signal, but also demonstrated obviously enhanced dual-modal imaging performance in tumor detection and characterization. Besides, the MPGds had ultrasmall size, which can be cleared through hepatobiliary and renal pathways. These results all suggested that this metal ions-chelate endogenous biopolymer may be a prominent dual-modal MRI/PAI contrast agent for orthotopic cancer.
Acknowledgments
This work has been financially supported by the National Natural Science Foundation of China (Grant Nos. 81801767, 81771907 and 81571747), Shanxi Province Science Foundation for Youths (Nos. 201701D221257 and 201801D221394), Science and Technology Innovation Team Project of Shanxi Province (No. 201705D131026), Engineering Technology Research Center Engineering Technology Research Center of Shanxi Province (No. 201805D121008), Scientific and Technological Achievements Transformation Project of Shanxi Province (No. 201704D131006), Laboratory Construction Project of Shanxi Province, the Projects for Local Science and Technology Development Guided by the Central Committee (YDZX20191400002537) and Startup Foundation for Doctors of Shanxi Medical University (No. 03201549).
Disclosure
The authors report no conflicts of interest in this work.
References
1. Waghray A, Murali AR, Menon KVN. Hepatocellular carcinoma: from diagnosis to treatment. World J Hepatol. 2015;7(8):1020–1029. doi:10.4254/wjh.v7.i8.1020
2. Lu C, Ji J, Zhu X, et al. T2-weighted magnetic resonance imaging of hepatic tumor guided by SPIO-loaded nanostructured lipid carriers and ferritin reporter genes. ACS Appl Mater Interfaces. 2017;9(41):35548–35561. doi:10.1021/acsami.7b09879
3. Lu J, Sun J, Li F, et al. Highly sensitive diagnosis of small hepatocellular carcinoma using pH-responsive iron oxide nanocluster assemblies. J Am Chem Soc. 2018;140(32):10071–10074. doi:10.1021/jacs.8b04169
4. Lee YJ, Lee JM, Lee JS, et al. Hepatocellular carcinoma: diagnostic performance of multidetector CT and MR imaging – a systematic review and meta-analysis. Radiology. 2015;275(1):97–109. doi:10.1148/radiol.14140690
5. Chen R, Ling D, Zhao L, et al. Parallel comparative studies on mouse toxicity of oxide nanoparticle- and gadolinium-based T1 MRI contrast agents. ACS Nano. 2015;9(12):12425–12435. doi:10.1021/acsnano.5b05783
6. Xu W, Sun J, Li L, Peng X, Zhang R, Wang B. Melanin-manganese nanoparticles with ultrahigh efficient clearance in vivo for tumor-targeting T1 magnetic resonance imaging contrast agent. Biomater Sci. 2018;6(1):207–215. doi:10.1039/C7BM00635G
7. Xue S, Yang H, Qiao J, et al. Protein MRI contrast agent with unprecedented metal selectivity and sensitivity for liver cancer imaging. Proc Natl Acad Sci. 2015;112(21):6607–6612. doi:10.1073/pnas.1423021112
8. Cao Y, Liu M, Zhang K, et al. Poly(glycerol) used for constructing mixed polymeric micelles as T1 MRI contrast agent for tumor-targeted imaging. Biomacromolecules. 2017;18(1):150−158. doi:10.1021/acs.biomac.6b01437
9. Baek AR, Kim HK, Park S, et al. Gadolinium complex of 1,4,7,10-tetraazacyclododecane-1,4,7-trisacetic acid (DO3A)–ethoxybenzyl (EOB) conjugate as a new macrocyclic hepatobiliary MRI contrast agent. J Med Chem. 2017;60(12):4861−4868. doi:10.1021/acs.jmedchem.7b00060
10. Wang L, Lin H, Ma L, et al. Albumin-based nanoparticles loaded with hydrophobic gadolinium chelates as T1–T2 dual-mode contrast agents for accurate liver tumor imaging. Nanoscale. 2017;9(13):4516–4523. doi:10.1039/C7NR01134B
11. Guo C, Sun L, She W, et al. A dendronized heparin–gadolinium polymer self-assembled into a nanoscale system as a potential magnetic resonance imaging contrast agent. Polym Chem. 2016;7(14):2531–2541. doi:10.1039/C6PY00059B
12. Cao Y, Xu L, Kuang Y, Xiong D, Pei R. Gadolinium-based nanoscale MRI contrast agents for tumor imaging. J Mater Chem B. 2017;5(19):3431–3461. doi:10.1039/C7TB00382J
13. Santelli J, Lechevallier S, Baaziz H, et al. Multimodal gadolinium oxysulfide nanoparticles: a versatile contrast agent for mesenchymal stem cell labeling. Nanoscale. 2018;10(35):16775–16786. doi:10.1039/C8NR03263G
14. Chen H, Li X, Liu F, Zhang H, Wang Z. Renal clearable peptide functionalized NaGdF4 nanodots for high-efficiency tracking orthotopic colorectal tumor in mouse. Mol Pharmaceutics. 2017;14(9):3134–3141. doi:10.1021/acs.molpharmaceut.7b00361
15. Judenhofer MS, Wehrl HF, Newport DF, et al. Simultaneous PET–MRI: a new approach for functional and morphological imaging. Nat Med. 2008;14(4):459–465. doi:10.1038/nm1700
16. Lemaster JE, Wang Z, Hariri A, et al. Gadolinium doping enhances the photoacoustic signal of synthetic melanin nanoparticles: a dual modality contrast agent for stem cell imaging. Chem Mater. 2019;31(1):251–259. doi:10.1021/acs.chemmater.8b04333
17. Nie L, Wang S, Wang X, et al. In vivo volumetric photoacoustic molecular angiography and therapeutic monitoring with targeted plasmonic nanostars. Small. 2014;10(8):1585–1593. doi:10.1002/smll.201302924
18. Liu Y, Nie L, Chen X. Photoacoustic molecular imaging: from multiscale biomedical applications towards early-stage theranostics. Trends Biotechnol. 2016;34(5):420–433. doi:10.1016/j.tibtech.2016.02.001
19. Jiang X, Zhang S, Ren F, et al. Ultrasmall magnetic CuFeSe2 ternary nanocrystals for multimodal imaging guided photothermal therapy of cancer. ACS Nano. 2017;11(6):5633–5645. doi:10.1021/acsnano.7b01032
20. Yang W, Guo W, Le W, et al. Albumin-bioinspired Gd:CuS nanotheranostic agent for in vivo photoacoustic/magnetic resonance imaging-guided tumor-targeted photothermal therapy. ACS Nano. 2016;10(11):10245–10257. doi:10.1021/acsnano.6b05760
21. Liang X, Li Y, Li X, et al. PEGylated polypyrrole nanoparticles conjugating gadolinium chelates for dual-modal MRI/photoacoustic imaging guided photothermal therapy of cancer. Adv Funct Mater. 2015;25(9):1451–1462. doi:10.1002/adfm.v25.9
22. Cheng Y, Tan X, Wang J, et al. Polymer-based gadolinium oxide nanocomposites for FL/MR/PA imaging guided and photothermal/photodynamic combined anti-tumor therapy. J Control Release. 2018;277:77–88. doi:10.1016/j.jconrel.2018.03.009
23. Lv X, Wang X, Li T, et al. Rationally designed monodisperse Gd2O3/Bi2S3 hybrid nanodots for efficient cancer theranostics. Small. 2018;14(49):1802904. doi:10.1002/smll.v14.49
24. Pan J, Zhu X, Chen X, Zhao Y, Liu J. Gd3+-doped MoSe2 nanosheets used as a theranostic agent for bimodal imaging and highly efficient photothermal cancer therapy. Biomater Sci. 2018;6(2):372–387. doi:10.1039/C7BM00894E
25. Liu Y, Ai K, Ji X, et al. Comprehensive insights into the multi-antioxidative mechanisms of melanin nanoparticles and their application to protect brain from injury in ischemic stroke. J Am Chem Soc. 2017;139(2):856–862. doi:10.1021/jacs.6b11013
26. Zhang R, Fan Q, Yang M, et al. Engineering melanin nanoparticles as an efficient drug-delivery system for imaging-guided chemotherapy. Adv Mater. 2015;27(34):5063–5069. doi:10.1002/adma.201502201
27. Qi C, Fu L, Xu H, Wang T, Lin J, Huang P. Melanin/polydopamine-based nanomaterials for biomedical applications. Sci China Chem. 2019;62(2):162–188. doi:10.1007/s11426-018-9392-6
28. Ju KY, Lee JW, Im GH, et al. Bio-inspired, melanin-like nanoparticles as a highly efficient contrast agent for T1-weighted magnetic resonance imaging. Biomacromolecules. 2013;14(10):3491−3497. doi:10.1021/bm4008138
29. Wang Y, Huang Q, He X, et al. Multifunctional melanin-like nanoparticles for bone-targeted chemo-photothermal therapy of malignant bone tumors and osteolysis. Biomaterials. 2018;183:10–19. doi:10.1016/j.biomaterials.2018.08.033
30. Fan Q, Cheng K, Hu X, et al. Transferring biomarker into molecular probe: melanin nanoparticle as a naturally active platform for multimodality imaging. J Am Chem Soc. 2014;136(43):15185−15194. doi:10.1021/ja505412p
31. Zhang L, Su H, Cai J, et al. A multifunctional platform for tumor angiogenesis-targeted chemo-thermal therapy using polydopamine-coated gold nanorods. ACS Nano. 2016;10(11):10404−10417. doi:10.1021/acsnano.6b06267
32. Meredith P, Powell BJ, Riesz J, Nighswander-Rempel SP, Pederson MR, Moore EG. Towards structure–property–function relationships for eumelanin. Soft Matter. 2006;2(1):37−44. doi:10.1039/B511922G
33. Cho S, Park W, Kim D. Silica-coated metal chelating-melanin nanoparticles as a dual-modal contrast enhancement imaging and therapeutic agent. ACS Appl Mater Interfaces. 2017;9(1):101−111.
34. Zhou Z, Wu C, Liu H, et al. Surface and interfacial engineering of iron oxide nanoplates for highly efficient magnetic resonance angiography. ACS Nano. 2015;9(3):3012–3022. doi:10.1021/nn507193f
35. Vilgrain V, Beers BEV, Pastor CM. Insights into the diagnosis of hepatocellular carcinomas with hepatobiliary MRI. J Hepatol. 2016;64(3):708−716. doi:10.1016/j.jhep.2015.11.016
36. Danhier F, Feron O, Préat V. To exploit the tumor microenvironment: passive and active tumor targeting of nanocarriers for anti-cancer drug delivery. J Controlled Release. 2010;148(2):135–146. doi:10.1016/j.jconrel.2010.08.027
37. Fang J, Nakamura H, Maeda H. The EPR effect: unique features of tumor blood vessels for drug delivery, factors involved, and limitations and augmentation of the effect. Adv Drug Deliv Rev. 2011;63(3):136–151. doi:10.1016/j.addr.2010.04.009
38. Zhang S, Chu Z, Yin C, Zhang C, Lin G, Li Q. Controllable drug release and simultaneously carrier decomposition of SiO2-drug composite nanoparticles. J Am Chem Soc. 2013;135(15):5709–5716. doi:10.1021/ja3123015
39. Longmire M, Choyke PL, Kobayashi H. Clearance properties of nano-sized particles and molecules as imaging agents: considerations and caveats. Nanomedicine. 2008;3(5):703–717. doi:10.2217/17435889.3.5.703
 © 2019 The Author(s). This work is published and licensed by Dove Medical Press Limited. The
full terms of this license are available at https://www.dovepress.com/terms
and incorporate the Creative Commons Attribution
- Non Commercial (unported, 3.0) License.
By accessing the work you hereby accept the Terms. Non-commercial uses of the work are permitted
without any further permission from Dove Medical Press Limited, provided the work is properly
attributed. For permission for commercial use of this work, please see paragraphs 4.2 and 5 of our Terms.
© 2019 The Author(s). This work is published and licensed by Dove Medical Press Limited. The
full terms of this license are available at https://www.dovepress.com/terms
and incorporate the Creative Commons Attribution
- Non Commercial (unported, 3.0) License.
By accessing the work you hereby accept the Terms. Non-commercial uses of the work are permitted
without any further permission from Dove Medical Press Limited, provided the work is properly
attributed. For permission for commercial use of this work, please see paragraphs 4.2 and 5 of our Terms.