Back to Journals » Clinical Ophthalmology » Volume 16
A Cross-Sectional Study of Various Imaging and Biochemical Biomarkers in Patients with Diabetic Macular Edema in Different Stages of Diabetic Retinopathy
Authors Naveen P, Sahu V ![]() , Pathak M
, Pathak M
Received 27 June 2022
Accepted for publication 1 September 2022
Published 23 September 2022 Volume 2022:16 Pages 3129—3134
DOI https://doi.org/10.2147/OPTH.S377956
Checked for plagiarism Yes
Review by Single anonymous peer review
Peer reviewer comments 2
Editor who approved publication: Dr Scott Fraser
Prithvi Naveen, Vijaya Sahu, Madhumallika Pathak
Department of Ophthalmology, AIIMS Raipur, Raipur, Chhattisgarh, India
Correspondence: Vijaya Sahu, 2D, Block 5, Singapore City, Kota, Raipur, 492099, India, Tel +91 9752679556, Email [email protected]
Purpose: To compare which imaging and biochemical biomarkers are associated with different stages of diabetic retinopathy (DR) in type 2 diabetes mellitus patients with diabetic macular edema (DME).
Patients and Methods: It was a cross-sectional, observational study that included 100 patients of DME with different stages of DR. Patients were divided into two groups: Group A – DME with non-proliferative diabetic retinopathy (NPDR) and Group B - DME with proliferative diabetic retinopathy (PDR). Group A was further subdivided into three subgroups: A (1) – DME with mild NPDR, A (2) – DME with moderate NPDR, and A (3) – DME with severe NPDR. The primary outcome measure was the association of imaging and biochemical biomarkers with different stages of DR in patients with DME.
Results: Out of 100 patients, Group A (1) had 1, Group A (2) 44, Group A (3) 29, and group: B had 29 patients. As Group A (1) had only one patient, we did not include it in the calculation. The overall mean age of the study population was 54.84+9.87 years, with a male preponderance (76%). The HbA1c levels, serum triglyceride level, serum cholesterol level, and microalbuminuria level showed no significant association with different stages of DR (P> 0.05). Still, we found high serum urea levels (p=0.027) in Group B patients. The optical coherence tomography (OCT)-based imaging biomarkers – central subfield thickness (CST), cystoid macular edema (CME), subretinal fluid (SRF), and hyperreflective foci (HRF) – showed no significant association with various stages of DR. The presence of diffuse retinal thickness (DRT) (p=0.04) and the epiretinal membrane (ERM) (p=0.04) showed significant association with Group B patients.
Conclusion: The essential biochemical biomarkers such as serum urea levels and DRT and ERM may be considered an important imaging biomarker for the advanced stage of DR.
Keywords: imaging biomarkers, biochemical biomarkers, central subfield thickness, diffuse retinal thickness, serum urea level
Introduction
Diabetes is a metabolic disorder affecting 463 million people globally and 77 million people in India. When ophthalmic manifestations are considered, DR is taking center stage today. DR is one of the leading causes of blindness worldwide in working adult age groups.1
DR naturally progresses from non-proliferative abnormalities to proliferative diabetic retinopathy (PDR), characterized by neovascularization involving disc (NVD) or neovascularization elsewhere (NVE). The leading cause of vision loss in DR patients is Diabetic Macular Edema (DME). DME is characterized by retinal thickening and edema, which can develop in all stages of retinopathy.2
Many studies and clinical trials have confirmed significant risk factors for DME, such as hyperglycemia, dyslipidemia, hypertension, smoking, and nephropathy.2 There are many biomarkers to assess these risk factors for DR and DME. It can be clinical (general and ocular), imaging, biochemical, and molecular.3
One of the imaging modalities used to assess DR and DME is OCT. It is a non-invasive, non-contact method for assessment of macular edema and each feature observed in OCT acts as an imaging biomarker. The biochemical biomarkers considered are glycosylated hemoglobin (HbA1c), total cholesterol, serum low-density lipoprotein (LDL), serum high-density lipoprotein (HDL), total triglycerides, serum creatinine, serum urea and microalbuminuria.4
The relationship between different biomarkers and stages of DR and DME will be necessary for optimal clinical management and new clinical strategies to prevent vision loss. However, no studies have established a strong association between these biomarkers in different stages of DR. In our study, we compared these biomarkers for DME in various stages of DR and their association with each stage of DR.
Materials and Methods
It is a cross-sectional observational study conducted at the Department of Ophthalmology of AIIMS, Raipur, between 1 May 2020 and 31 October 2021. The study was approved by the Institutional Ethics Committee of All-India Institute of Medical Sciences (AIIMS) Raipur, India, and the study was carried out as per the tenets of the Declaration of Helsinki (IEC Approval Number: 1026). Written informed consent was taken from all the patients to use the data for research purposes. All patients of type 2 DM with DME with ages ranging from 30 to 70 years with Central Subfield Thickness (CST) on CIRRUS 500 SD-OCT [Carl Zeiss Meditec, Jena, Germany] >250µm were included in the study. We included one eye for each patient. In cases of bilateral DME, we included the eye with higher CST on OCT. Patients with a history of having undergone scattered retinal photocoagulation (PRP)/focal laser, history of intravitreal injections of anti-vascular endothelial growth factor (anti-VEGF) or steroids, YAG capsulotomy within 3 months in the same eye, present or past evidence of uveitis, cataract surgery within 6 months, eye trauma and patients with media opacity like cataract causing hindrance for fundus/OCT examination were excluded from the study. Complete ophthalmic examination was done under slit-lamp biomicroscopy and indirect ophthalmoscope, and patients were graded according to the International Clinical Disease Severity Scale for DR and DME.5 We divided the patients into two major study groups: Group A – DME with NPDR and Group B – DME with PDR. Group A was further subdivided into three categories based on different stages of NPDR: Group A (1) – DME with mild NPDR, Group A (2) – DME with moderate NPDR, and Group A (3) – DME with severe NPDR. OCT was done to quantify DME, and a horizontal raster scan of 12×12mm length was taken through the foveal centre. OCT morphological patterns were assessed by a single vitreoretinal specialist, including central subfield thickness (CST), cystoid macular edema (CME), diffuse retinal thickening (DRT), hyperreflective retinal foci, subretinal fluid (SRF), and epiretinal membrane (ERM). Blood and urine investigations were done on the same day. Those being HbA1c, serum LDL, serum HDL, serum triglycerides, total cholesterol, serum creatinine, serum urea, and microalbuminuria. The primary outcome measure was to compare imaging and biochemical biomarkers in type 2 diabetic patients with DME in different stages of diabetic retinopathy.
Statistical Analysis
Statistical analysis was carried out using statistical packages for IBM SPSS vs 22 for Windows. Continuous and categorical variables were expressed as mean ± SD and percentages, respectively. Two-sided p values were considered statistically significant at p<0.05. Chi-square test was applied for comparison of categorical variables and one-way ANOVA test for continuous variables.
Results
We included 100 eyes of 100 patients with type 2 DM with DR and DME in the study. The overall mean age of the study population was 54.84±9.87 years. The mean age of patients in Group A was 55.45 ± 9.88 years, while the mean age of those in Group B was 53.34 ± 9.88 years. The two groups did not show a significant difference in age distribution (P=0.336). Male preponderance was observed amongst the study population (76%). The mean duration of diabetes in Group A was 10.59 ± 5.21 years, and that in Group B was 9.82 ± 5.72 years, found to be very similar among the two study groups (p=0.52).
Out of 100 patients, 1 (1%) was diagnosed with DME with mild NPDR, 44 (44%) with DME with moderate NPDR, 29 (29%) with DME with severe NPDR, and 29 (29%) with DME with PDR. As Group A (1) had only one patient, we did not include it in the calculation. Mean CST was high in all groups, and the analysis of CST in the study groups was done by one-way ANOVA test, but we did not find any significant difference between the study groups (p= 0.494; p>0.05). The commonest OCT biomarker was CME amongst all patients of both groups, which was 69%, followed by SRF (64%), HRF (60%), DRT (50%), and less common was ERM (18%). We used the Chi-square test to compare these biomarkers between various groups. There was no significant difference found (p>0.05) for CME, HRF, and SRF, but the presence of DRT and ERM was more in Group B and found to be significant (p=0.04) (Table 1).
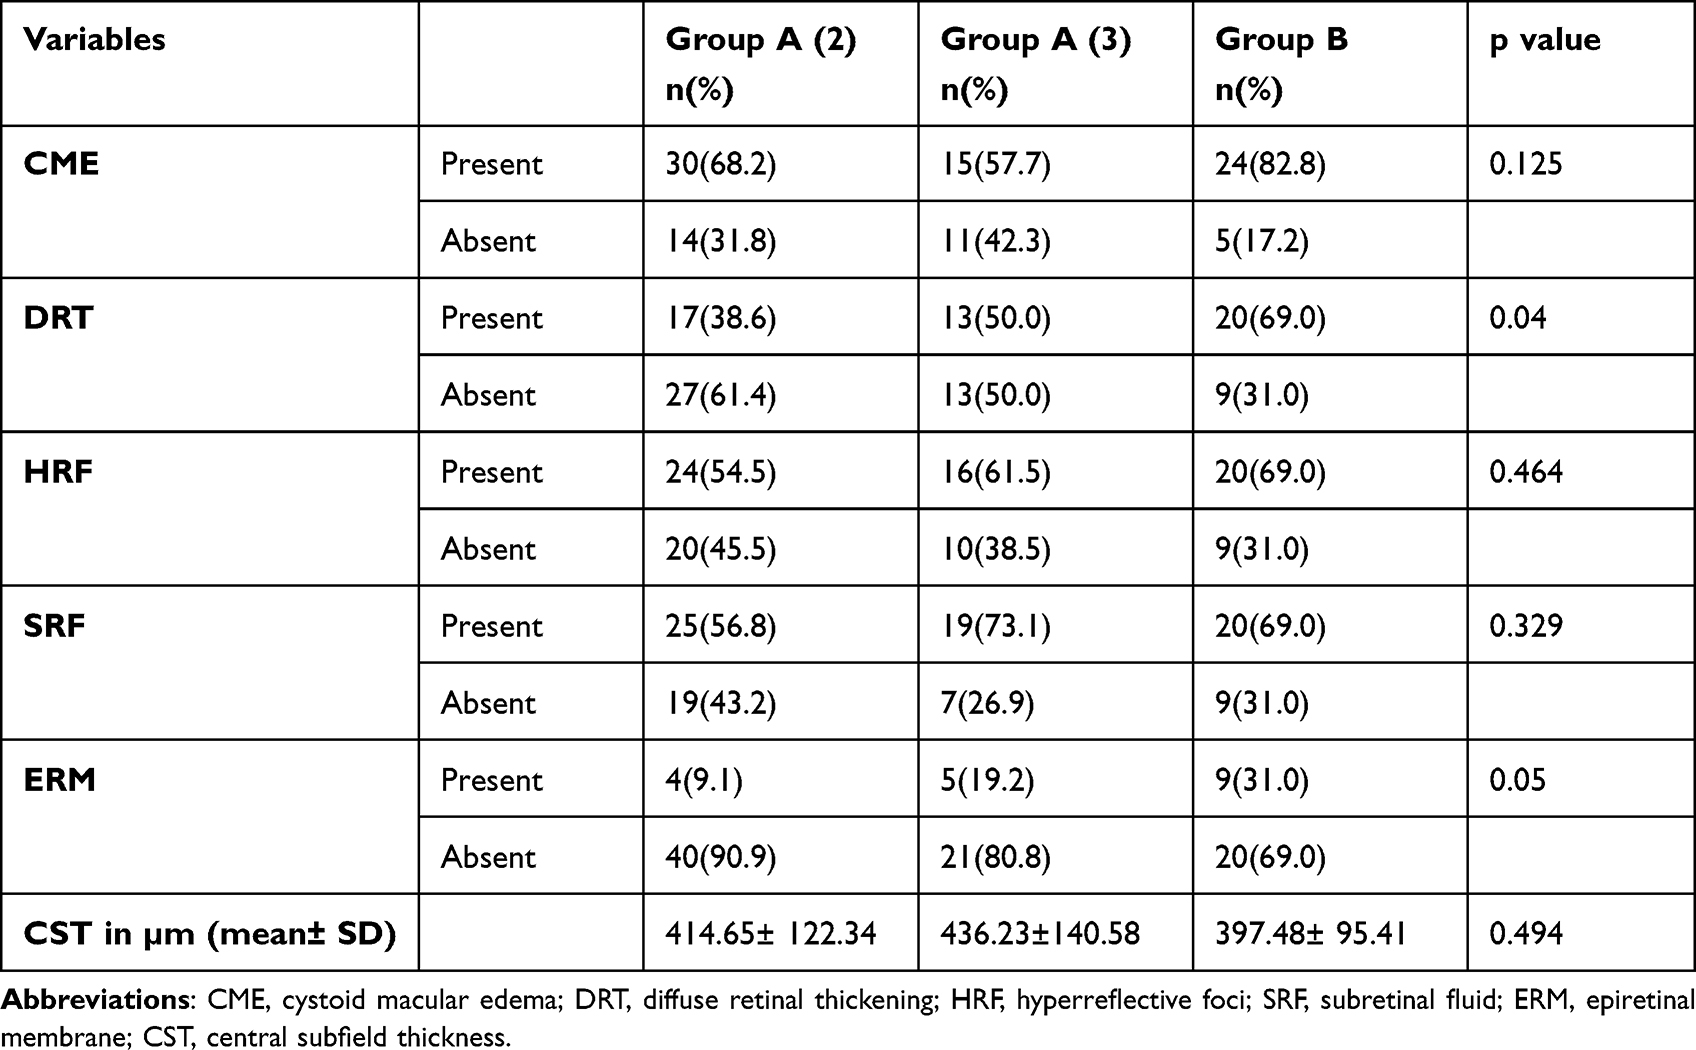 |
Table 1 Comparison of Various OCT Biomarkers |
One-way ANOVA test was applied for analysis of all continuous variables. The mean fasting and post-prandial blood sugar levels were high in both groups, but the difference was not statistically significant (FBS, p=0.727; PPBS, p=0.444).
The mean HbA1c was more than 7% for all groups and slightly high for Group B, but the difference was insignificant (p=0.090). The mean serum LDL level, mean serum triglyceride level, mean microalbuminuria level, and mean serum creatinine level were compared between groups, but we did not find any significant association between these factors and DR. We found that only mean serum urea level was high in Group B and a significant difference was found amongst the groups (p=0.027; p<0.05) (Table 2).
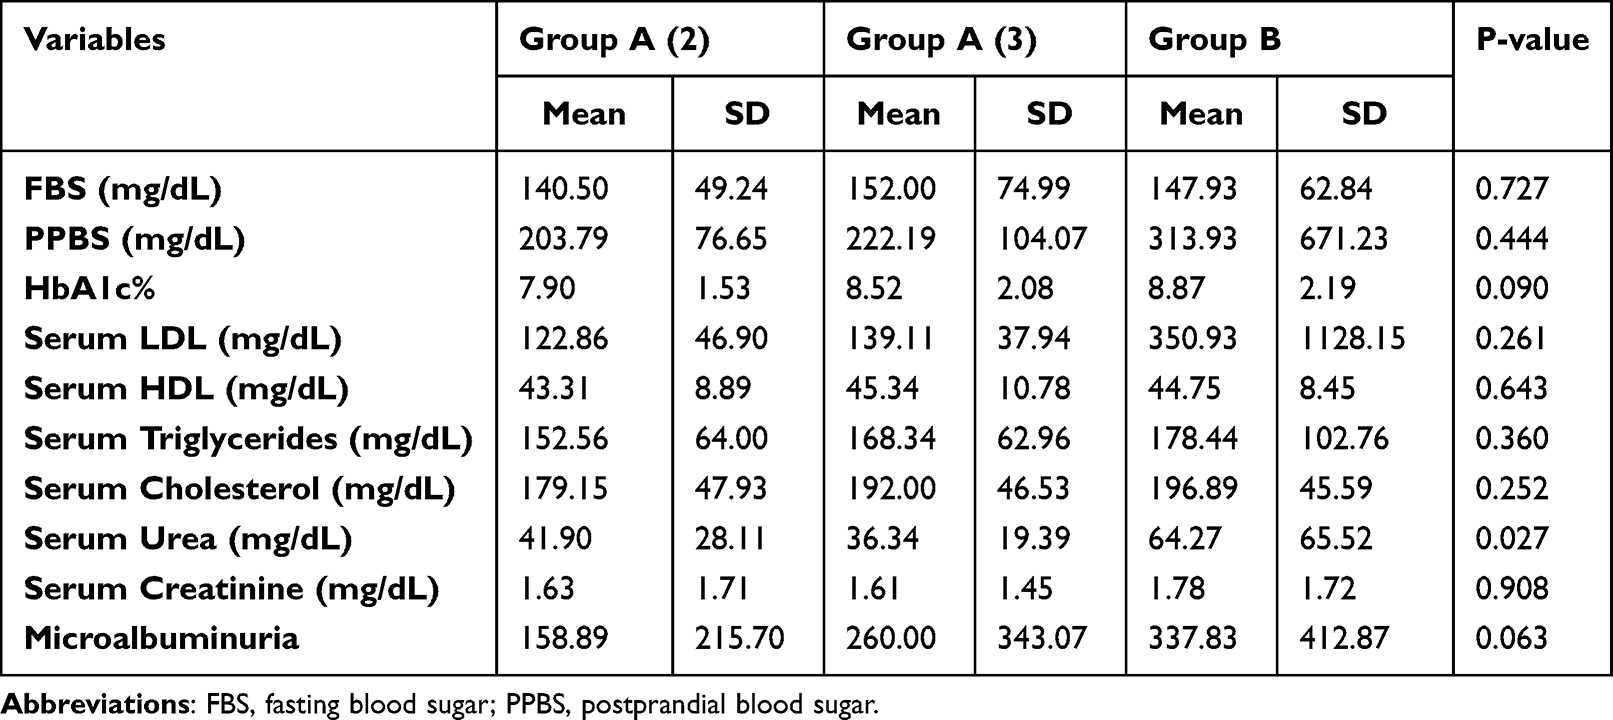 |
Table 2 Comparison of Biochemical Biomarkers |
Discussion
DR can be defined as prolonged hyperglycemia leading to retinal microvascular damage. This internally leads to DME, a common cause of vision loss and visual disability worldwide.6
DME is a preventable cause of vision loss; elucidating and preventing the risk factors of DME can go a long way in reducing morbidity in diabetics. Many studies have been done to elicit the risk factors and biomarkers for DME. Still, no studies have compared these imaging and biochemical biomarkers with various stages of DR with DME and associated their relation with the severity of the disease. This study might add to the literature and bridge the gap, which will help in better management.
The mean age in both the groups of the present study signifies middle age group is usually affected by DR and DME, similar to other studies.7,8 Male preponderance was observed in our study (76%). The prolonged duration of diabetes is a known risk factor for DR and DME. We observed that both groups had an almost similar mean duration of diabetes (10 years or more), indicating that longer duration was a factor responsible for the development of DR and DME.9 Duration of disease is a significant risk factor for the development of DR but not a marker for severity of the disease.
The advent of OCT has been an essential tool in assessing the CST and also monitoring the patients with DME for progression of the disease.10
In the present study, the mean CST was high in Group A (3) (436.23±140.58 µm) and low in the Group B (397.48±95.41 µm), but there was no remarkable difference among the study groups (p=0.494). In contrast, a study done by Yassin et al concluded that CST had a positive correlation with the severity of the disease when different stages of DR were taken into consideration, with high-risk PDR (P=0.050) and severe NPDR (P=0.021) being statistically significant.11 In the present study, cystoid pattern was the most common morphological pattern, and CME was almost equally present in all the study groups, similar to Acan et al.12 DRT is the most common pattern according to many studies.11
Yassin et al also concluded that DRT is associated with significantly good visual acuity.11 However, in contrast, DRT was increasingly present (69%) in the severe stage of DR (DME with PDR) in the present study. Ghosh et al concluded that there is a correlation between serum creatinine and albuminuria with that of DME, primarily serous type strongly associated with albuminuria.13 In our study, SRF was present in more than 50% of the patients in each study group but not significantly different in each study group (p=0.329).
An infrequent OCT finding in the present study was ERM. Still, we observed it in a more significant number of patients belonging to Group B (31.0%). Knyazer et al found a significant association between ERM to age, cataract surgery, and diabetic retinopathy.14 Knyazer et al also reported a prevalence of ERM at 6.5% in type 2 diabetes mellitus, and Mitchell et al reported a prevalence of 11% in patients with DR.
While Ng et al reported a high prevalence of ERM that is 33.3% in both types of DM, there is a paucity of information in the literature regarding the correlation between the presence of ERM and stages of DR.15,16
In our study, the blood glucose levels were, in general, raised more than the normal range amongst all the study groups indicating that deranged blood glucose levels as one of the risk factors for the development of DME in DR patients.17 HbA1c levels best reflect the glycaemic control in DR patients. It is well-established now that tight blood glucose control early in the course of diabetes is beneficial in the protection against DR. This knowledge was provided by the randomized controlled intervention trial in type 1 diabetes patients by the Diabetes Control and complications Trial (DCCT) and in type 2 diabetes patients by the United Kingdom Prospective Diabetes Study (UKPDS).18,19 Asensio-Sanchez et al, in their study, reported that increased levels of HbA1c were significantly associated with CSME, with an increase of 2.4 with every 1% elevation in HbA1c.2 In the present study, HbA1c was deranged in all patients with various stages of DR with DME, although it was slightly high in Group B (mean HbA1c-8.87±2.19%); in comparison, we did not find it significant (p=0.090).20
Raman et al, in their study SN DREAM, and Benarous et al reported a significant correlation between high cholesterol levels and severity of DR and CSME.7,21 In the present study, the mean serum LDL level difference was not substantial, but serum LDL levels were observed to be more deranged in Group B patients (mean=350.93±1128.15 mg/dL). In our study, we found serum triglyceride levels and serum cholesterol levels were deranged amongst all the study groups suggesting higher levels of serum triglyceride and serum cholesterol may be involved in the development of DME, and levels were slightly elevated in Group B patients. Still, no significant association was found between these factors and DR (p<0.05). Not many studies have been done to elicit the correlation between serum urea and different stages of diabetic retinopathy in DME patients. The comparison of mean serum urea levels was made, and a significant difference was found amongst the groups (p=0.027); on further evaluation, we found high serum urea levels present amongst the patients in Group B (mean=64.27±65.52 mg/dL), indicating its relation to the severity of disease but needs more studies to establish more decisive conclusion with larger sample size. Similarly, the mean microalbuminuria level in Group B patients was found it be high (mean=337.83±412.87 µg/min), but when a comparison was made by one-way ANOVA test, it was not significant (p>0.05).
Zander et al reported microalbuminuria as one of the risk factors associated with DME and DR.22 In this study, the mean microalbuminuria was found to be at an increasing level in Group B patients stipulating that microalbuminuria can be one of the risk factors in the development of DME and severity of disease but cannot be concluded in our study due to poor sample size.
Koo et al reported that SRF in OCT was significantly associated with an increase in levels of microalbuminuria as compared to other OCT patterns.23 Acan et al reported that microalbuminuria was considerably higher in patients with DRT patterns in OCT (61.9%) compared to SRF (50.0%) and CME patterns (25.0%).12 In our study, we could not elicit any association between microalbuminuria and specific pattern of OCT, especially SRF.
Conclusion
Imaging biomarkers such as patterns of OCT findings, those being DRT and ERM have the potential to be the indicators for assessing the severity of the disease, but significant conclusions could not be drawn due to the lack of sufficient sample. Likewise, biochemical biomarkers such as serum urea and microalbuminuria were found to be deranged in severe stages of the disease, which needs further evaluation to be concluded as indicators of disease severity.
Disclosure
The authors report no financial interest or conflicts of interest in this work.
References
1. International Diabetes Federation. IDF Diabetes Atlas.
2. Asensio-Sánchez VM, Gómez-Ramírez V, Morales-Gómez I, et al. Clinically significant diabetic macular edema: systemic risk factors. Arch Soc Esp Oftalmol. 2008;83(3):173–176.
3. Fong DS, Aiello L, Gardner TW, et al. Retinopathy in diabetes. Diabetes Care. 2004;27(Suppl 1):S84–S87. doi:10.2337/diacare.27.2007.s84
4. Jenkins AJ, Joglekar MV, Hardikar AA, et al. Biomarkers in diabetic retinopathy. Rev Diabet Stud. 2015;12(1–2):159–195. doi:10.1900/RDS.2015.12.159
5. Wilkinson CP, Ferris FL 3rd, Klein RE, et al. Proposed international clinical diabetic retinopathy and diabetic macular edema disease severity scales. Ophthalmology. 2003;110(9):1677–1682. doi:10.1016/S0161-6420(03)00475-5
6. Photocoagulation for diabetic macular edema. Early Treatment Diabetic Retinopathy Study report number 1. Early Treatment Diabetic Retinopathy Study research group. Arch Ophthalmol. 1985;103(12):1796–1806.
7. Raman R, Rani PK, Kulothungan V, Rachepalle SR, Kumaramanickavel G, Sharma T. Influence of serum lipids on clinically significant versus nonclinically significant macular edema: SN-DREAMS Report number 13. Ophthalmology. 2010;117(4):766–772. doi:10.1016/j.ophtha.2009.09.005
8. Mukhtar A, Khan MS, Junejo M, Ishaq M, Akbar B. Effect of pan retinal photocoagulation on central macular thickness and visual acuity in proliferative diabetic retinopathy. Pak J Med Sci. 2016;32(1):221–224. doi:10.12669/pjms.321.8758
9. Ferris FL 3rd. A complication of diabetic retinopathy. Surv Ophthalmol. 1984;28 Suppl:452–461. doi:10.1016/0039-6257(84)90227-3
10. Peng YJ, Tsai MJ. Impact of metabolic control on macular thickness in diabetic macular oedema. Diab Vasc Dis Res. 2018;15(2):165–168. doi:10.1177/1479164117746023
11. Yassin SA, ALjohani SM, Alromaih AZ, Alrushood AA. Optical coherence tomography patterns of diabetic macular edema in a Saudi population. Clin Ophthalmol. 2019;13:707–714. doi:10.2147/OPTH.S199713
12. Acan D, Karahan E, Kocak N, Kaynak S. Evaluation of systemic risk factors in different optical coherence tomographic patterns of diabetic macular edema. Int J Ophthalmol. 2018;11(7):1204–1209. doi:10.18240/ijo.2018.07.21
13. Ghosh S, Bansal P, Shejao H, Hegde R, Roy D, Biswas S. Correlation of morphological pattern of optical coherence tomography in diabetic macular edema with systemic risk factors in middle aged males. Int Ophthalmol. 2015;35(1):3–10. doi:10.1007/s10792-014-9922-z
14. Knyazer B, Schachter O, Plakht Y, et al. Epiretinal membrane in diabetes mellitus patients screened by nonmydriatic fundus camera. Can J Ophthalmol. 2016;51(1):41–46. doi:10.1016/j.jcjo.2015.09.01
15. Mitchell P, Smith W, Chey T, Wang JJ, Chang A. Prevalence and associations of epiretinal membranes. The Blue Mountains Eye Study, Australia. Ophthalmology. 1997;104(6):1033–1040. doi:10.1016/S0161-6420(97)30190-0
16. Ng CH, Cheung N, Wang JJ, et al. Prevalence and risk factors for epiretinal membranes in a multi-ethnic United States population. Ophthalmology. 2011;118(4):694–699. doi:10.1016/j.ophtha.2010.08.009
17. Klein R, Klein BE, Moss SE. Epidemiology of proliferative diabetic retinopathy. Diabetes Care. 1992;15(12):1875–1891. doi:10.2337/diacare.15.12.1875
18. Nathan DM. DCCT/EDIC Research Group. The diabetes control and complications trial/epidemiology of diabetes interventions and complications study at 30 years: overview. Diabetes Care. 2014;37(1):9–16. doi:10.2337/dc13-2112
19. King P, Peacock I, Donnelly R. The UK prospective diabetes study (UKPDS): clinical and therapeutic implications for type 2 diabetes. Br J Clin Pharmacol. 1999;48(5):643–648. doi:10.1046/j.1365-2125.1999.00092
20. Vitale S, Maguire MG, Murphy RP, et al. Clinically significant macular edema in type I diabetes. Incidence and risk factors. Ophthalmology. 1995;102(8):1170–1176. doi:10.1016/s0161-6420(95)30894-9
21. Benarous R, Sasongko MB, Qureshi S, et al. Differential association of serum lipids with diabetic retinopathy and diabetic macular edema. Invest Ophthalmol Vis Sci. 2011;52(10):7464–7469. doi:10.1167/iovs.11-7598
22. Zander E, Herfurth S, Bohl B, et al. Maculopathy in patients with diabetes mellitus type 1 and type 2: associations with risk factors. Br J Ophthalmol. 2000;84(8):871–876. doi:10.1136/bjo.84.8.871
23. Koo NK, Jin HC, Kim KS, Kim YC. Relationship between the morphology of diabetic macular edema and renal dysfunction in diabetes. Korean J Ophthalmol. 2013;27(2):98–102. doi:10.3341/kjo.2013.27.2.98
 © 2022 The Author(s). This work is published and licensed by Dove Medical Press Limited. The
full terms of this license are available at https://www.dovepress.com/terms
and incorporate the Creative Commons Attribution
- Non Commercial (unported, 3.0) License.
By accessing the work you hereby accept the Terms. Non-commercial uses of the work are permitted
without any further permission from Dove Medical Press Limited, provided the work is properly
attributed. For permission for commercial use of this work, please see paragraphs 4.2 and 5 of our Terms.
© 2022 The Author(s). This work is published and licensed by Dove Medical Press Limited. The
full terms of this license are available at https://www.dovepress.com/terms
and incorporate the Creative Commons Attribution
- Non Commercial (unported, 3.0) License.
By accessing the work you hereby accept the Terms. Non-commercial uses of the work are permitted
without any further permission from Dove Medical Press Limited, provided the work is properly
attributed. For permission for commercial use of this work, please see paragraphs 4.2 and 5 of our Terms.
Recommended articles
Non-Linear Relationship Between Fasting C-Peptide and Retinopathy in Patients with Type 2 Diabetes Mellitus - A Retrospective Study
Ma J, Han C, Lv Y, Cai H
Diabetes, Metabolic Syndrome and Obesity 2025, 18:1035-1045
Published Date: 7 April 2025