Back to Journals » Neuropsychiatric Disease and Treatment » Volume 14
A cross-sectional study exploring useful indicators for low bone mineral density in male alcoholic patients
Authors Horai T, Hishimoto A, Otsuka I, So T, Mouri K, Shimmyo N, Boku S, Okishio N, Sora I
Received 5 October 2017
Accepted for publication 18 January 2018
Published 28 February 2018 Volume 2018:14 Pages 663—669
DOI https://doi.org/10.2147/NDT.S153360
Checked for plagiarism Yes
Review by Single anonymous peer review
Peer reviewer comments 2
Editor who approved publication: Professor Taro Kishi
Tadasu Horai,1 Akitoyo Hishimoto,1 Ikuo Otsuka,1 Tatsuhiro So,2 Kentaro Mouri,1 Naofumi Shimmyo,1 Shuken Boku,1 Noriaki Okishio,3 Ichiro Sora1
1Department of Psychiatry, Kobe University Graduate School of Medicine, Kobe, Japan; 2So Mental Clinic, Kobe, Japan; 3Hyogo Mental Health Center, Kobe, Japan
Background: Alcohol dependence induces low bone mineral density (BMD), predicting osteoporosis, while low and moderate alcohol consumption may even increase BMD. In recent years, undercarboxylated osteocalcin (ucOC) and tartrate-resistant acid phosphatase-5b (TRACP-5b), bone turnover markers, have gained special interest as useful indicators of low BMD. However, it remains unclear whether other alcohol-related variables (eg, duration of abstinence and continuous drinking) are linked to aberrant BMD. In addition, no previous study has investigated whether ucOC or TRACP-5b is clinically useful to predict low BMD not only in the general population, but also in alcohol-dependent subjects.
Patients and methods: We recruited 275 male alcohol-dependent subjects and collected information about their drinking habits, comorbid diseases, smoking history and walking exercise behavior. BMD in each subject was determined by ultrasonography. Serum liver enzymes (AST, ALT, ALP, ChE, γ-GTP and LDH), ucOC and TRACP-5b were measured in all subjects. T-scores were calculated according to BMD for all subjects.
Results: The mean T-scores of our subjects were negatively shifted compared to the general population (-0.75±1.36 SD). We divided our subjects into a normal BMD group (n=137) and a low BMD group (n=138) according to their T-scores (T-score ≥-1 SD, normal BMD; T-score <-1 SD, low BMD). Multivariate logistic regression analysis showed that body mass index (BMI) was negatively associated with low BMD (95% CI: 0.75–0.90). By contrast, long abstinence period (95% CI: 1.40–4.21), smoking (95% CI: 1.30–5.56), hypertension (95% CI: 1.04–3.76), lactate dehydrogenase (LDH) (95% CI: 1.00–1.01) and ucOC (95% CI: 1.04–1.22) were positively associated with low BMD.
Conclusion: In alcohol-dependent males, smoking habits and higher ucOC are associated with low BMD. Our study suggests that smoking cessation may prevent lower BMD, and ucOC may predict lower BMD in alcohol-dependent individuals.
Keywords: alcohol dependence, osteopenia, undercarboxylated osteocalcin, tartrate-resistant acid phosphatase-5b, smoking, hypertension
Introduction
Excessive drinking may cause alcohol dependence, physical complications and social disruption. In Japan, 8.6 million people are reported to be heavy drinkers, with “heavy drinking” defined as 60 g or more daily alcohol consumption by the Ministry of Health, Labor and Welfare of Japan.1 Alcoholic dependence accounted for the most years of life lost (YLLs) to premature mortality, followed by drug related substance abuse disorders and schizophrenia, according to data collected from 187 countries in the world.2 Osteoporosis is a physical condition that is often comorbid in alcoholic patients.3 It is characterized by low bone mineral density (BMD), and bone tissue deterioration and microarchitectural disruption, with an increased risk of fracture.4 Osteoporotic fracture often leads to other physical complications.5 While osteoporosis in postmenopausal females has already received considerable interest, an increase in male osteoporosis has become an important public health problem and research focus.6
In the general population, drinking more than 3 units/day (one unit is defined as 10 g of ethanol) or more alcohol is associated with a low BMD and an increased risk of falling accidents. In contrast, low and moderate alcohol intake are associated with increased BMD.7–9 Thus, whether ethanol plays a protective role in patients with low BMD remains unclear,10 although ethanol has been shown to inhibit osteoblast proliferation and function in vitro.11,12 Furthermore, whether other alcohol-related variables such as duration of abstinence and continuous drinking are linked to aberrant BMD is unclear.
Two new bone turnover markers used in clinical practice to predict osteopenia, undercarboxylated osteocalcin (ucOC), and tartrate-resistant acid phosphatase-5b (TRACP-5b), have gained special interest. Osteocalcin (OC) is a bone matrix protein that becomes carboxylated with vitamin K-dependent gamma-carboxyglutamic acid residues.13 The remaining residual OC that is not carboxylated is abbreviated ucOC. High serum levels of ucOC may reflect low BMD because ucOC cannot bind with calcium.14 Meanwhile, TRACP-5b is secreted from osteoclasts into circulation. Serum TRACP-5b is a useful marker of bone resorption.15 However, to our knowledge, there are no previous studies that have investigated whether ucOC or TRACP-5b can predict low BMD, not only in the general population, but also in alcohol-dependent subjects.
Here, we explored the possible risk factors associated with low BMD in male alcoholic patients. We also sought to clarify whether ucOC and TRACP-5b are useful for predicting low BMD in male alcoholic patients.
Patients and methods
Subjects
Our study was a cross-sectional study of 275 males recruited between 2009 and 2014 from Kobe University, So Mental Clinic and Hyogo Mental Health Center. All participants were diagnosed with alcohol dependence by psychiatrists according to Diagnostic and Statistical Manual of Mental Disorders, Fourth Edition, Text Revision (DSM-IV-TR) published by the American Psychiatric Association.16 All participants were not diagnosed with osteoporosis and hepatic cell carcinoma, and did not receive treatment of steroids. This study was approved by the Institutional Ethics Review Board of Kobe University. So Mental Clinic and Hyogo Mental Health Center obtained approval in the Institutional Ethics Review Board of Kobe University as the cooperative medical institutions. Written informed consent was obtained from all of the participants.
Clinical assessment
Height was measured using a wall-mounted stadiometer. Weight was measured using a digital scale. Body mass index (BMI) was calculated as weight (kg)/height (m)2. Participants completed a questionnaire that included smoking status, complications, and walking for exercise status. Smoking status was classified into current smokers and ex-smokers, and the Brinkman index (cigarette per day multiplied by smoking period) was calculated. The complications consisted of physical complications and depression. Physical complications included hypertension, diabetes mellitus and liver cirrhosis. Hypertension was defined as systolic blood pressure above 140 mmHg or diastolic blood pressure above 90 mmHg or both, according to guidelines for the management of hypertension.17 Diabetes mellitus was defined as fasting glucose above 126 mg/dL or hemoglobin A1c above 6.5% according to evidence-based practice guideline for the treatment for diabetes in Japan second edition published by the Japan Diabetes Society.45 Liver cirrhosis was diagnosed based on morphological changes by abdominal ultrasound such as surface irregularity, left lobe or caudate lobe swelling, and right lobe atrophy.18,19 All physical complications were diagnosed by attending doctors. Having a walking for exercise status was defined as a participant who had at least thirty minutes of exercise three days per week or more, as recommended by the Ministry of Health, Labour and Welfare of Japan. The questionnaire was performed by skilled doctors.
Alcohol use
The questionnaire also examined drinking habits: alcohol intake, drinking period, abstinence period, and continuous drinking. Alcohol intake was defined as the highest volume of alcohol consumed in the participant’s life and was expressed as number of drinks per day. Number of drinks was determined by the scale defined by the Ministry of Health, Labour and Welfare of Japan. For example, 350 mL of beer is 1.4 drinks, 180 mL of Japanese sake is 2.2 drinks and a glass of wine (120 mL) is 1.2 drinks. Continuous drinking is defined as almost daily alcohol drinking without binges.20
Bone mineral density
BMD of the heel was measured by ultrasonography (AOS-100NW, Hitachi Ltd, Tokyo, Japan). Two parameters were measured: speed of sound and transmission index. The T-score was calculated by these parameters and compared to the BMD of healthy young people (22–44-year-old men). The T-score represents the difference in BMD between the subjects and young people as defined by standard deviation (SD). T-score is one of the osteoporosis diagnosis criteria used by the World Health Organization (WHO).21
Blood examinations
The serum activity of liver enzymes (aspartate transaminase [AST], alanine transaminase [ALT], alkaline phosphatase [ALP], cholinesterase [ChE], gamma-glutamyltransferase [γ-GTP], lactate dehydrogenase [LDH]) and the serum level of the bone turnover markers (ucOC and TRACP-5b) were measured. AST, ALT, ALP, ChE, γ-GTP, LDH were measured by a modified Japan Society of Clinical Chemistry (JSCC) reference method. ucOC was measured by an electro-chemiluminescence immunoassay (ECLIA). TRACP-5b was measured by an enzyme immunoassay (EIA).
Statistical analysis
The subjects were divided into two groups according to their T-scores. The WHO defines individuals with a T-score of −1 SD and above as having normal BMD, a T-score between <-1 SD and −2.5 SD as having osteopenia, and a T-score of −2.5 SD or below as having osteoporosis. In the present study, individuals with a T-score of −1 SD and above were defined as the normal BMD group and individuals with a T-score of −1 SD and below were defined as the low BMD group. The normal and low BMD groups consisted of 137 (49.8%) and 138 (50.2%) males, respectively.
Variables with a normal distribution (age, height, body weight, BMI, alcohol intake, drinking period, ALP, ChE, LDH and TRACP-5b) were represented by the arithmetic mean ± SD. For variables where there was not a normal distribution, the median with interquartile range was determined (Brinkman index, AST, ALT, γ-GTP and ucOC). The numbers in parentheses were represented for percentages (abstinence period, continuous drinking, smoking, complications and exercise habit).
Analysis of variance for continuous variables and chi-square tests for categorical variables were utilized to compare patient characteristics between groups. Multivariate logistic regression analysis was used to estimate the risk of low BMD. Predictors included age, BMI, alcohol intake, drinking period, abstinence period (≥6 or <6 months), continuous drinking, smoking status, complications (hypertension, diabetes mellitus and liver cirrhosis and depression), liver enzyme serum activities and serum levels of bone turnover markers. Height and weight were used to calculate BMI, which was then used in logistic regression analysis. Variables were eliminated by the backward stepwise method. All statistical analyses were performed using JMP software (version 11; SAS institute Inc., Cary, NC, USA) and IBM SPSS version 18 (IBM, Armonk, NY, USA).
Results
A total of 275 male alcoholic patients were recruited for the study. Characteristics of the subjects are shown in Table 1 and the T-score distribution is displayed in Figure 1. There was a negative shift of variance; the mean T-score of patients was −0.75±1.36 SD. The normal and low BMD groups included 137 and 138 males, respectively. The average weight and BMI were significantly different between the normal and low BMD groups. The average abstinence period, smoking history and Brinkman index were also different between two groups (Table 1).
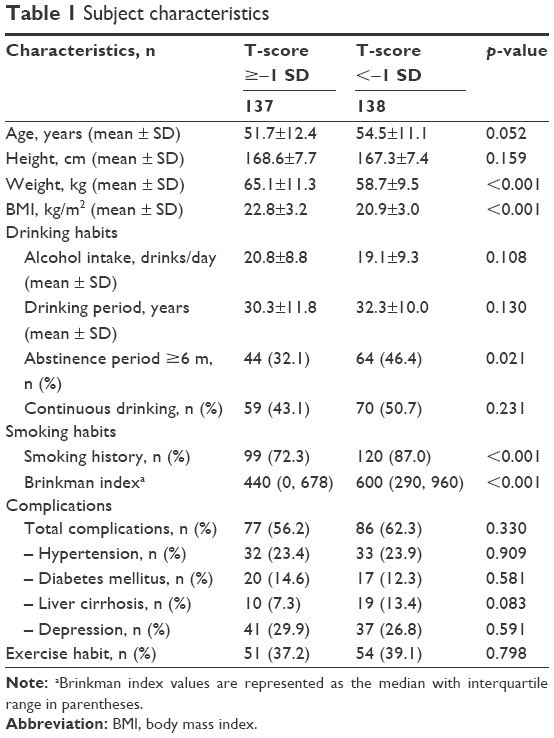 | Table 1 Subject characteristics |
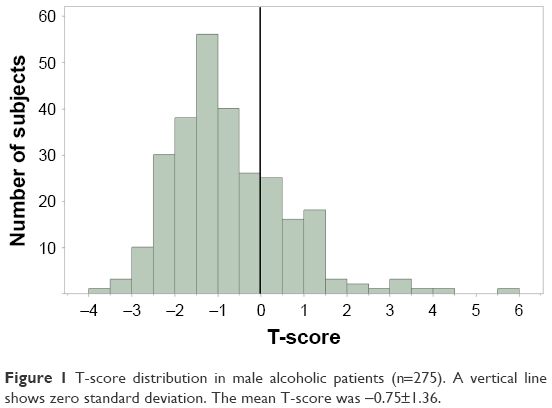 | Figure 1 T-score distribution in male alcoholic patients (n=275). A vertical line shows zero standard deviation. The mean T-score was −0.75±1.36. |
Blood examination results are shown in Table 2. The mean (±SD) of ChE was significantly lower in the low BMD group (264.8±72.8 U/L) than in the normal BMD group (295.8±90.2 U/L) (p-value =0.002). The median (interquartile range) of ucOC and the mean (±SD) of TRACP-5b were significantly higher in the low BMD group than in the normal BMD group (4.0 [2.2, 6.4] ng/mL versus 3.1 [1.5, 5.0] ng/mL, p=0.022; 471.7±210.4 mU/dL, versus 387.2±186.8 mU/dL, p<0.001, respectively).
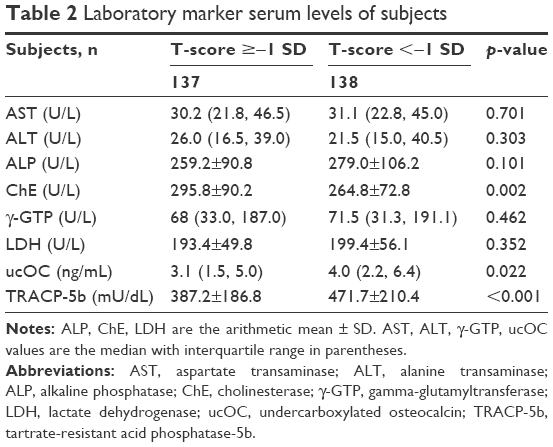 | Table 2 Laboratory marker serum levels of subjects |
The results of multivariate logistic regression analysis are displayed in Table 3. BMI was negatively associated with low BMD (95% CI: 0.75–0.90). By contrast, long abstinence period (95% CI: 1.40–4.21), smoking (95% CI: 1.38–5.56), hypertension (95% CI: 1.04–3.76), elevated LDH (95% CI: 1.00–1.01) and ucOC (95% CI: 1.04–1.22) were positively associated with low BMD. A receiver operating characteristic (ROC) curve of these variables is shown in Figure 2. The variables demonstrating a significant difference (BMI, abstinence period, smoking, hypertension, serum activity of LDH and serum level of ucOC) discriminated well between the normal and low BMD groups (area under the curve [AUC]: 0.73, p<0.001, 95% CI: 0.67–0.79). The optimal cut-off point of ucOC was 4.6 ng/mL (sensitivity =48.6%, specificity =86.9%). On the other hand, a ROC curve constructed according to only ucOC decreased the AUC value (Figure S1).
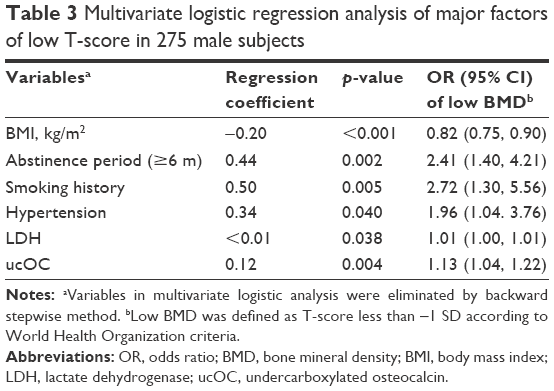 | Table 3 Multivariate logistic regression analysis of major factors of low T-score in 275 male subjects |
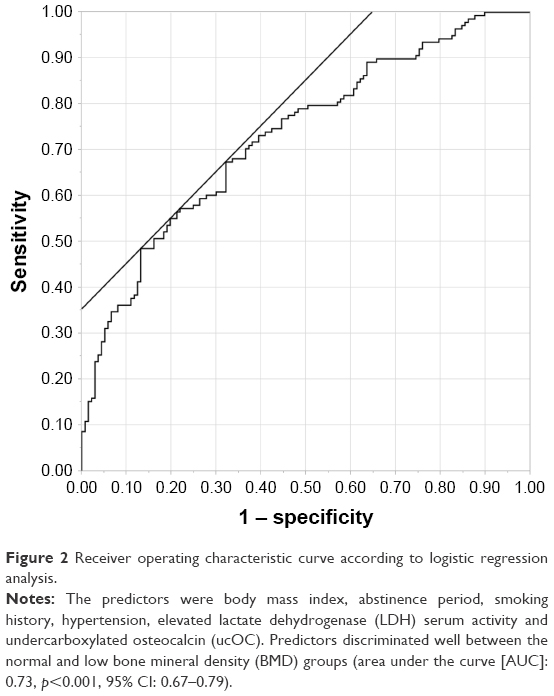 | Figure 2 Receiver operating characteristic curve according to logistic regression analysis. |
Discussion
One of our main findings was the association between smoking and low BMD in male alcoholics. The relationship between smoking and low BMD has been described in many studies.22–24 In previous studies, chronic alcoholism and heavy drinking was also associated with low BMD.10,25 Sioka et al reported that alcoholic smokers tended to be at increased risk of osteopenia than non-alcoholic smokers, although the difference was not statistically significant because of a small sample size.26 Our study is the first report to examine the risk of osteopenia in alcoholic patients with a current or past history of smoking. Our results suggest that a synergistic effect of alcohol and smoking may contribute to low BMD. Generally, smoking rates of alcoholic patients are high, reported to be from 50% to 80%.27,28 In our study, smoking rates were also very high, 72.3% in the normal BMD group and 87.0% in the low BMD group. The intake of nicotine may alter bone metabolism indirectly by changing circulating levels of gonadal, calciotropic and adrenocortical hormones. On the other hand, nicotine itself may have a direct effect on osteogenesis by altering osteoblast cell proliferation.29
Our second finding is that the level of ucOC was significantly higher in the low BMD group. Teraoka reported that the ucOC of long-term drinkers was higher than that of social drinkers, which is consistent with our results.30 A high level of ucOC is a useful indicator of low vitamin K levels.13 Vitamin K deficiency has been observed in alcoholic patients in earlier reports.31 In vivo, vitamin K is very important for not only bone metabolism but also to prevent vascular calcification.32–34 Under vitamin K deficiency, OC cannot be converted to carboxylated OC by vitamin K-dependent gamma-carboxyglutamic acid. Consequently, elevated serum levels of ucOC may be observed in alcoholic patients. In this study, TRACP-5b was not associated with low BMD, which indicates that low BMD in alcoholic patients may be due to decreased bone formation rather than increased bone resorption.
Intriguingly, apart from bone turnover markers, high serum activities of LDH were observed in the low BMD group. To our knowledge, there have been no reports about the relationship between LDH serum activity and BMD in healthy people or alcoholic patients. Garadah et al reported that a high LDH serum activity correlated with low BMD in sickle-cell disease.35 The serum activity of LDH is also influenced by liver cirrhosis, a well-known risk factor of osteopenia and osteoporosis.36,37 LDH serum activities are higher in the early phase of liver disease and decrease with the progression of liver dysfunction.38 We did not distinguish among stages of liver cirrhosis; therefore, further study is needed to verify the relationship between LDH serum activity and BMD.
Alvisa-Negrísa et al reported that six months of alcohol abstinence was associated with improved BMD.39 We found the opposite result; an abstinence period of at least six months was associated with a low BMD. There are several possible explanations for this inconsistency. First, we could not detect an improvement or aggravation of low BMD in individuals because this was a cross-sectional study. A follow-up study is needed to clarify whether long abstinence affects the BMD of alcoholic patients individually. Second, facts such as aging, changing in nutritional status, and life-changes might affect the amelioration of BMD in the abstinent participants for over six months.
Consistent with other studies, our investigation showed that BMI was negatively associated with low BMD.40,41 The protective effect of BMI on BMD may involve a skeletal loading effect and secretion of bone-active hormones from pancreatic beta cells (insulin) and adipocytes (estrogen and leptin).42
Physical complications including hypertension, diabetes mellitus and liver cirrhosis are often observed in alcoholic patients, and have already been reported to be associated with low BMD and fracture risk.37,43 In our study, hypertension was significantly associated with low BMD. This result was consistent with previous studies.44
We constructed ROC curves with six predictors (ucOC, smoking status, BMI, hypertension, abstinence period and elevated LDH) and these predictors discriminated well between the normal and low BMD groups (Figure 2). When the ROC curve was constructed using only the ucOC, the AUC value was lower than with six predictors (Figure S1). Therefore, comprehensive clinical evaluation, taking into account BMI and hypertension, ought to be considered by health care practitioners.
Limitations
There are some limitations in this study. First, we do not sufficiently collect information of drugs and physical complications; proton pump inhibitors, anti-epileptic drugs, lithium carbonate and dysfunction of thyroid or parathyroid may cause reduction of BMD. Second, we use two bone turnover markers (ucOC and TRACP-5b) but it may be useful to compare with other bone turnover markers such as osteocalcin and bone type alkaline phosphatase (these are known as bone formation markers) and parathyroid hormone and type 1 collagen cross-linked N-telopeptide (these are known as bone absorption markers). Third, we diagnosed liver cirrhosis based on morphological changes alone. We could reliably detect moderate and severe liver cirrhosis, but early stage disease may have been overlooked. Finally, we did not include a healthy control group, which might have revealed the relationship between alcohol intake and BMD in more detail.
Conclusion
In conclusion, our study suggests that BMI is a protective factor for low BMD, whereas smoking history and hypertension are associated with low BMD. The findings demonstrate that ucOC is useful to predict low BMD. In clinical practice, we should evaluate the factors of low BMD comprehensively and make efforts to reduce preventable risk (smoking cessation, treatment of hypertension) in alcoholic patients.
Acknowledgments
This research was supported by our laboratory assistant, Yasuko Nagashima, who collected participant information. We thank her for her generous assistance with this study.
Disclosure
The authors report no conflicts of interest in this work.
References
Higuchi S, Matsushita S, Maesato H, Osaki Y. Japan: alcohol today. Addiction. 2007;102:1849–1862. | ||
Whiteford HA, Degenhardt L, Rehm J, et al. Global burden of disease attributable to mental and substance use disorders: findings from the Global Burden of Disease Study 2010. Lancet. 2013;382:1575–1586. | ||
Kelepouris N, Harper KD, Gannon F, Kaplan FS, Haddad JG. Severe osteoporosis in men. Ann Intern Med. 1995;123:452–460. | ||
Cosman F, de Beur SJ, LeBoff MS, et al. Clinician’s Guide to Prevention and Treatment of Osteoporosis. Osteoporos Int. 2014;25:2359–2381. | ||
Carpintero P, Caeiro JR, Carpintero R, Morales A, Silva S, Mesa M. Complications of hip fracture: A review. World J Orthop. 2014;5:402–411. | ||
Gielen E, Vanderschueren D, Callewaert F, Boonen S. Osteoporosis in men. Best Pract Res Clin Endocrinol Metab. 2011;25:321–335. | ||
Chavassieux P, Serre CM, Vergnaud P, Delmas PD, Meunier PJ. In vitro evaluation of dose-effects of ethanol on human osteoblastic cells. Bone Miner. 1993;22:95–103. | ||
Cawthon PM, Harrison SL, Barrett-Connor E, et al. Alcohol intake and its relationship with bone mineral density, falls, and fracture risk in older men. J Am Geriatr Soc. 2006;54:1649–1657. | ||
Holbrook TL, Barrett-Connor E. A prospective study of alcohol consumption and bone mineral density. BMJ. 1993;306:1506–1509. | ||
Tucker KL, Jugdaohsingh R, Powell JJ, et al. Effects of beer, wine, and liquor intakes on bone mineral density in older men and women. Am J Clin Nutr. 2009;89:1188–1196. | ||
Friday KE, Howard GA. Ethanol inhibits human bone cell proliferation and function in vitro. Metabolism. 1991;40:562–565. | ||
Kouda K, Iki M, Fujita Y, et al. Alcoholic intake and bone status in elderly Japanese men: baseline data from the Fujiwara-kyo osteoporosis risk in men (FORMEN) study. Bone. 2011;49:275–280. | ||
Gundberg CM, Nieman SD, Abrams S, Rosen H. Vitamin K status and bone health: an analysis of methods for determination of undercarboxylated osteocalcin. J Clin Endocrinol Metab. 1998;83:3258–3266. | ||
Szulc P, Arlot M, Chapuy MC, Duboeuf F, Meunier PJ, Delmas PD. Serum undercarboxylated osteocalcin correlates with hip mineral density in elderly women. J Bone Miner Res. 1994;9:1591–1595. | ||
Halleen JM, Alatalo SL, Janckila AJ, Woitge HW, Seibel MJ, Väänänen HK. Serum tartrate-resistant acid phosphatase 5b is a specific and sensitive marker of bone resorption. Clin Chem. 2001;47:597–600. | ||
American Psychiatric Association. Diagnostic and statistical manual of mental disorders: DSM-IV-TR. Washington, DC, American Psychiatric Pub. | ||
Ogihara T, Kikuchi K, Matsuoka H, et al. The Japanese Society of Hypertension guidelines for the management of hypertension (JSH 2009). Hypertens Res. 2009;32:3–107. | ||
Di Lelio A, Cestari C, Lomazzi A, Beretta L. Cirrhosis: diagnosis with sonographic study of the liver surface. Radiology. 1989;172:389–392. | ||
Giorgio A, Amoroso P, Lettieri G, et al. Cirrhosis: value of caudate to right lobe ratio in diagnosis with US. Radiology. 1986;161:443–445. | ||
Wetterling T, Veltrup C, Driessen M, et al. Drinking pattern and alcohol-related medical disorders. Alcohol Alcohol. 1999;34:330–336. | ||
World Health Organization. WHO scientific group on the assessment of osteoporosis at primary health care level. Geneva, WHO Press 2007. | ||
Kanis JA, Johnell O, Oden A, et al. Smoking and fracture risk: a meta-analysis. Osteoporos Int. 2005;16:155–162. | ||
Law MR, Hackshaw AK. A meta-analysis of cigarette smoking, bone mineral density and risk of hip fracture: recognition of a major effect. BMJ. 1997;315:841–846. | ||
Vestergaard P, Mosekilde L. Fracture risk associated with smoking: a meta-analysis. J Intern Med. 2003;254:572–583. | ||
Malik P, Gasser RW, Kemmler G, et al. Low bone mineral density and impaired bone metabolism in young alcoholic patients without liver cirrhosis: a cross-sectional study. Alcohol Clin Exp Res. 2009;33:375–381. | ||
Sioka C, Bougias C, Al-Bokharthli J, Fotopoulos A. Smoking and alcohol use as risk factors for low bone mineral density. Rheumatol Int. 2006;27:207–208. | ||
Matsui T, Yokoyama A, Matsushita S, et al. Effect of a comprehensive lifestyle modification program on the bone density of male heavy drinkers. Alcohol Clin Exp Res. 2010;34:869–875. | ||
Degenhardt L, Hall W. Patterns of co-morbidity between alcohol use and other substance use in the Australian population. Drug Alcohol Rev. 2003;22:7–13. | ||
Yoon V, Maalouf NM, Sakhaee K. The effects of smoking on bone metabolism. Osteoporos Int. 2012;23:2081–2092. | ||
Teraoka A. Association between long-term alcohol consumption and undercarboxylated osteocalcin. Nihon Arukoru Yakubutsu Igakkai Zasshi. 2015;50:196–205. | ||
Iber FL, Shamszad M, Miller PA, Jacob R. Vitamin K deficiency in chronic alcoholic males. Alcohol Clin Exp Res. 1986;10:679–681. | ||
Cockayne S, Adamson J, Lanham-New S, Shearer MJ, Gilbody S, Torgerson DJ. Vitamin K and the prevention of fractures: systematic review and meta-analysis of randomized controlled trials. Arch Intern Med. 2006;166:1256–1261. | ||
DiNicolantonio JJ, Bhutani J, O’Keefe JH. The health benefits of vitamin K. Open Heart. 2015;2:e000300. | ||
Geleijinse JM, Vermeer C, Grobbee DE, et al. Dietary intake of menaquinone is associated with a reduced risk of coronary heart disease: the Rotterdam Study. J Nutr. 2004;134:3100–3105. | ||
Garadah TS, Hassan AB, Jaradat AA, et al. Predictors of abnormal bone mass density in adult patients with homozygous sickle-cell disease. Clin Med Insights Endocrinol Diabetes. 2015;8:35–40. | ||
Luxon BA. Bone disorders in chronic liver diseases. Curr Gastroenterol Rep. 2011;13:40–48. | ||
Gonzalez-Reimers E, Quintero-Platt G, Rodriguez-Rodriguez E, Martínez-Riera A, Alvisa-Negrín J, Santolaria-Fernández F. Bone changes in alcoholic liver disease. World J Hepatol. 2015;7:1258–1264. | ||
Kotoh K, Kato M, Kohjima M, et al. Lactate dehydrogenase production in hepatocytes is increased at an early stage of acute liver failure. Exp Ther Med. 2011;2:195–199. | ||
Alvisa-Negrín J, González-Reimers E, Santolaria-Fernández F, et al. Osteopenia in alcoholics: effect of alcohol abstinence. Alcohol Alcohol. 2009;44:468–475. | ||
Burger H, de Laet CE, van Daele PL, et al. Risk factors for increased bone loss in an elderly population: the Rotterdam Study. Am J Epidemiol. 1998;147:871–879. | ||
Emaus N, Wilsgaard T, Ahmed LA. Impacts of body mass index, physical activity, and smoking on femoral bone loss: the Tromso study. J Bone Miner Res. 2014;29:2080–2089. | ||
Reid IR. Relationships between fat and bone. Osteoporos Int. 2008;19:595–606. | ||
Oei L, Rivadeneira F, Zillikens MC, Oei EH. Diabetes, diabetic complications, and fracture risk. Curr Osteoporos Rep. 2015;13:106–115. | ||
El-Bikai R, Tahir MR, Tremblay J, et al. Association of age-dependent height and bone mineral density decline with increased arterial stiffness and rate of fractures in hypertensive individuals. J Hypertens. 2015;33:727–735. | ||
The Japan Diabetes Society. [Evidence-based practice guideline for the treatment for diabetes in Japan]. 2nd ed. Tokyo: Nankodo; 2007. Japanese. |
Supplementary material
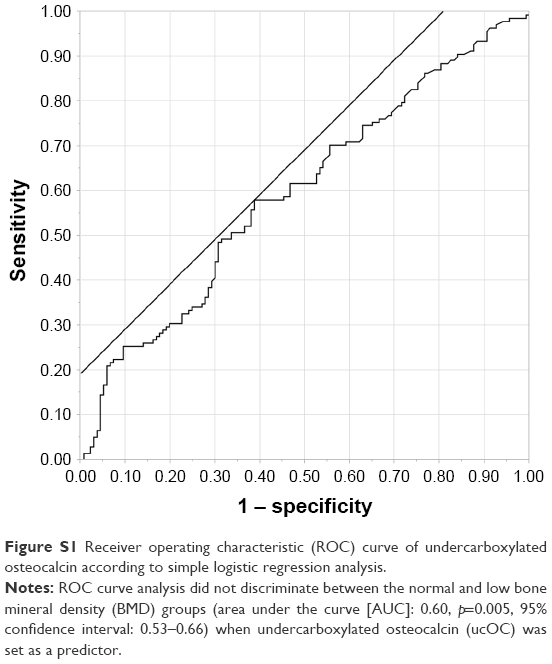 | Figure S1 Receiver operating characteristic (ROC) curve of undercarboxylated osteocalcin according to simple logistic regression analysis. |
 © 2018 The Author(s). This work is published and licensed by Dove Medical Press Limited. The
full terms of this license are available at https://www.dovepress.com/terms
and incorporate the Creative Commons Attribution
- Non Commercial (unported, 3.0) License.
By accessing the work you hereby accept the Terms. Non-commercial uses of the work are permitted
without any further permission from Dove Medical Press Limited, provided the work is properly
attributed. For permission for commercial use of this work, please see paragraphs 4.2 and 5 of our Terms.
© 2018 The Author(s). This work is published and licensed by Dove Medical Press Limited. The
full terms of this license are available at https://www.dovepress.com/terms
and incorporate the Creative Commons Attribution
- Non Commercial (unported, 3.0) License.
By accessing the work you hereby accept the Terms. Non-commercial uses of the work are permitted
without any further permission from Dove Medical Press Limited, provided the work is properly
attributed. For permission for commercial use of this work, please see paragraphs 4.2 and 5 of our Terms.