Back to Journals » ClinicoEconomics and Outcomes Research » Volume 11
A Cost-Effectiveness Analysis Of An Adenocarcinoma Risk Prediction Multi-Biomarker Assay For Patients With Barrett’s Esophagus
Authors Hao J, Critchley-Thorne R, Diehl DL, Snyder SR ![]()
Received 3 July 2019
Accepted for publication 2 October 2019
Published 25 October 2019 Volume 2019:11 Pages 623—635
DOI https://doi.org/10.2147/CEOR.S221741
Checked for plagiarism Yes
Review by Single anonymous peer review
Peer reviewer comments 2
Editor who approved publication: Dr Xing Lin Feng
Jing Hao,1 Rebecca Critchley-Thorne,2 David L Diehl,3 Susan R Snyder1
1Department of Epidemiology and Health Services Research, Geisinger, Danville, PA, USA; 2Research & Development, Cernostics Inc, Pittsburgh, PA, USA; 3Department of Gastroenterology, Geisinger, Danville, PA, USA
Correspondence: Jing Hao
Department of Epidemiology and Health Services Research, Geisinger, 100 N Academy Ave, MC44-00, Danville, PA 17822, USA
Tel +1 570 214 2543
Fax +1 570 214 9451
Email [email protected]
Purpose: This study evaluates the cost-effectiveness of a quantitative multi-biomarker assay (the Assay) that stratifies patients with Barrett’s Esophagus (BE) by risk of progression to high-grade dysplasia (HGD) or esophageal adenocarcinoma (EAC) and can be used to guide clinical decisions, versus the current guidelines (standard of care [SOC]) for surveillance and treatment of BE.
Patients and methods: Markov decision modeling and simulation were used to compare cost and quality-adjusted life-years (QALYs) from the perspective of a US health insurer with care delivered by an integrated health system. Model assumptions and disease progression probabilities were derived from the literature. Performance metrics for the Assay were from an independent clinical validation study. Cost of the Assay was based on reimbursement rates from multiple payers. Other costs were derived from Geisinger payment data.
Results: Base-case model results for a 5-year period comparing the Assay-directed care to the SOC estimated an incremental cost-effectiveness ratio (ICER) of $52,483/QALY in 2012 US dollars. Assay-directed care increased the use of endoscopic treatments by 58.4%, which reduced the progression to HGD, EAC and reduced EAC-related deaths by 51.7%, 47.1%, and 37.6%, respectively, over the 5-year period. Sensitivity analysis indicated that the probability of the Assay being cost-effective compared to the SOC was 57.3% at the $100,000/QALY acceptability threshold.
Conclusion: Given the model assumptions, the new Assay would be cost-effective after 5 years and improves patient outcomes due to improvement in the effectiveness of surveillance and treatment protocols resulting in fewer patients progressing to HGD and EAC and fewer EAC-related deaths.
Keywords: Barrett’s esophagus, esophageal adenocarcinoma, risk prediction multi-biomarker assay, cost effectiveness
Introduction
An estimated 3–17 million people in the US have Barrett’s esophagus (BE),1 a precursor to esophageal adenocarcinoma (EAC). EAC develops in a sequence of changes from non-dysplastic intestinal metaplasia (NDBE), to low-grade dysplasia (LGD), high-grade dysplasia (HGD) and invasive EAC. Patients with BE are surveilled by endoscopies with biopsy with the goal of early detection of dysplasia and EAC. Current guidelines recommend surveillance at intervals based on the Barrett’s histology.2 However, this approach is limited by the random nature of endoscopic biopsies and observer variation, and is inadequate to predict progression.3,4 The annual rate of progression to HGD/EAC ranges from 0.12% to 9.1% depending on the baseline diagnosis, clinical setting and the number and specialty of pathologists providing the diagnosis.5–9 However, EAC continues to be the fastest growing cancer by incidence in the US with a 5-year survival rate of only 18%.10,11 Extensive surveillance programs have not yet been successful in reducing the incidence of EAC, and surveillance of patients with NDBE according to current practice guidelines is unlikely to be cost-effective, even when compared with no surveillance.12–14
Endoscopic treatment, such as radiofrequency ablation (RFA) and endoscopic mucosal resection (EMR), are highly effective in eradicating dysplasia and preventing progression to EAC.15–17 Accurate risk-stratification tools are needed to enable early endoscopic treatment to be targeted to patients at high risk for progression, including patients with pathologic diagnosis of NDBE and indefinite for dysplasia (IND). Such tools will also enable the reduction of endoscopic surveillance in patients at low risk for progression. Previous economic studies have indicated that hypothetical biomarker-based risk prediction tools that guide management decisions for BE would be cost-effective compared to the current standard of care.13,14
A newly developed risk prediction multi-biomarker assay (TissueCypher® Barrett’s Esophagus Assay, Cernostics, Inc., Pittsburgh, PA, USA, more details of the Assay in Appendix 1), has been shown to predict the risk of progression of NDBE, IND or LGD to HGD/EAC within 5 years.18 The Assay has been validated in a multi-institutional study, which demonstrated that the Assay provides independent predictive information that outperforms predictions based on current clinical variables, including pathologic diagnosis.18 The Assay has also been shown to detect abnormalities associated with prevalent HGD/EAC.19 The Assay is based on an imaging platform that quantifies multiple biomarkers in tissue specimens20 and produces a risk score assigning patients to low-, intermediate- or high-risk categories for progression to HGD/EAC. Providers can use the risk score adjunctively to help guide management decisions for BE patients. The objective of this study is to evaluate the cost-effectiveness of the Assay versus the current standard of care (SOC) for surveillance and treatment of BE.
Materials And Methods
Patient Population
A hypothetical cohort of 10,000 patients with diagnosis of BE (NDBE, IND, and LGD) was used. The initial distribution of diagnostic states was based on pathology data from Geisinger Health System (GHS), a large integrated health delivery system based in Danville, PA, USA. With an extensive BE surveillance program. The mean age of patients was 61.9 years old, 81.1% were male, 93.1% were Caucasian, and 54.3% had long segment BE (34.3% had short segment and 11.4% did not have segment length recorded) based on a cohort of 175 BE patients in surveillance at GHS.
Model
A cost-effectiveness Markov decision model was constructed in Excel using Palisade DecisionTools Suite (Palisade Corporation, Ithaca, New York) for the disease progression of patients with BE and their surveillance and treatment protocol over a 5-year time frame. This was used to examine the costs and outcomes related to management of BE when the Assay is implemented in comparison to the SOC. The Markov decision model is a hybrid of a decision tree (Figure 1A) and Markov process (Figure 1B). The Markov cycle length was defined as 1 year with a half-cycle correction.
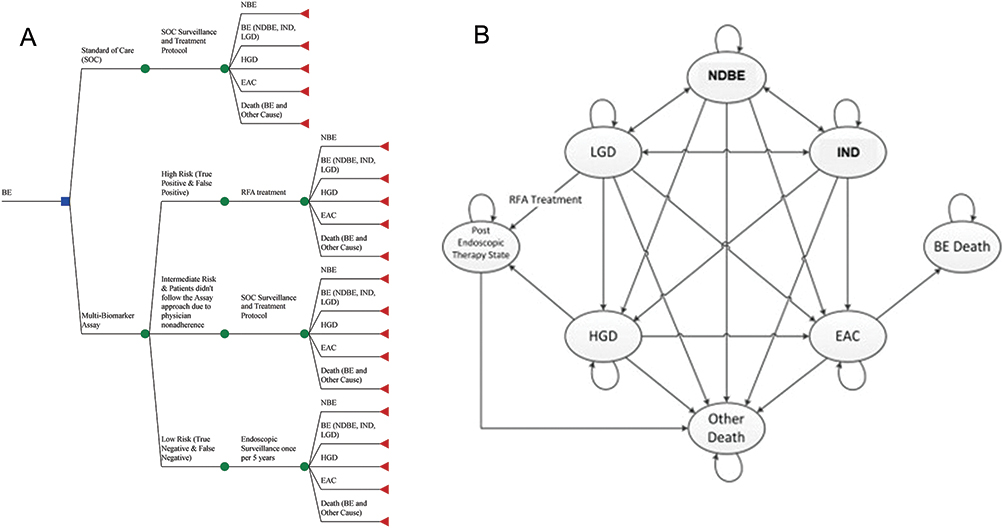 |
Figure 1 Decision tree and Markov model for patients with Barrett’s esophagus: (A) Decision tree: patient options at decision node include standard of care (SOC) surveillance and treatment and Assay-guided surveillance and treatment. Parameters used in decision tree are detailed in Table 1. A summary of the Assay guided surveillance and treatment protocol for BE is provided in Table 2. (B) Markov model: Patients can be in one of the 8 health states. Patients start from the health state of BE (NDBE, IND and LGD) and the arrows indicate the possible transitions from one state to another. Note: Post Endoscopic State = BE and no BE. Abbreviations: LGD, low-grade dysplasia; IND, indefinite for dysplasia; NDBE, nondysplastic Barrett’s esophagus. |
A no surveillance and treatment approach was not modeled and compared in this study, however, to provide a better understanding of the natural history of BE, this information is provided in Appendix 2.
Parameter Estimates
The full parameter table that presents values, ranges, probability distributions and references for all parameters is presented in Table 1.
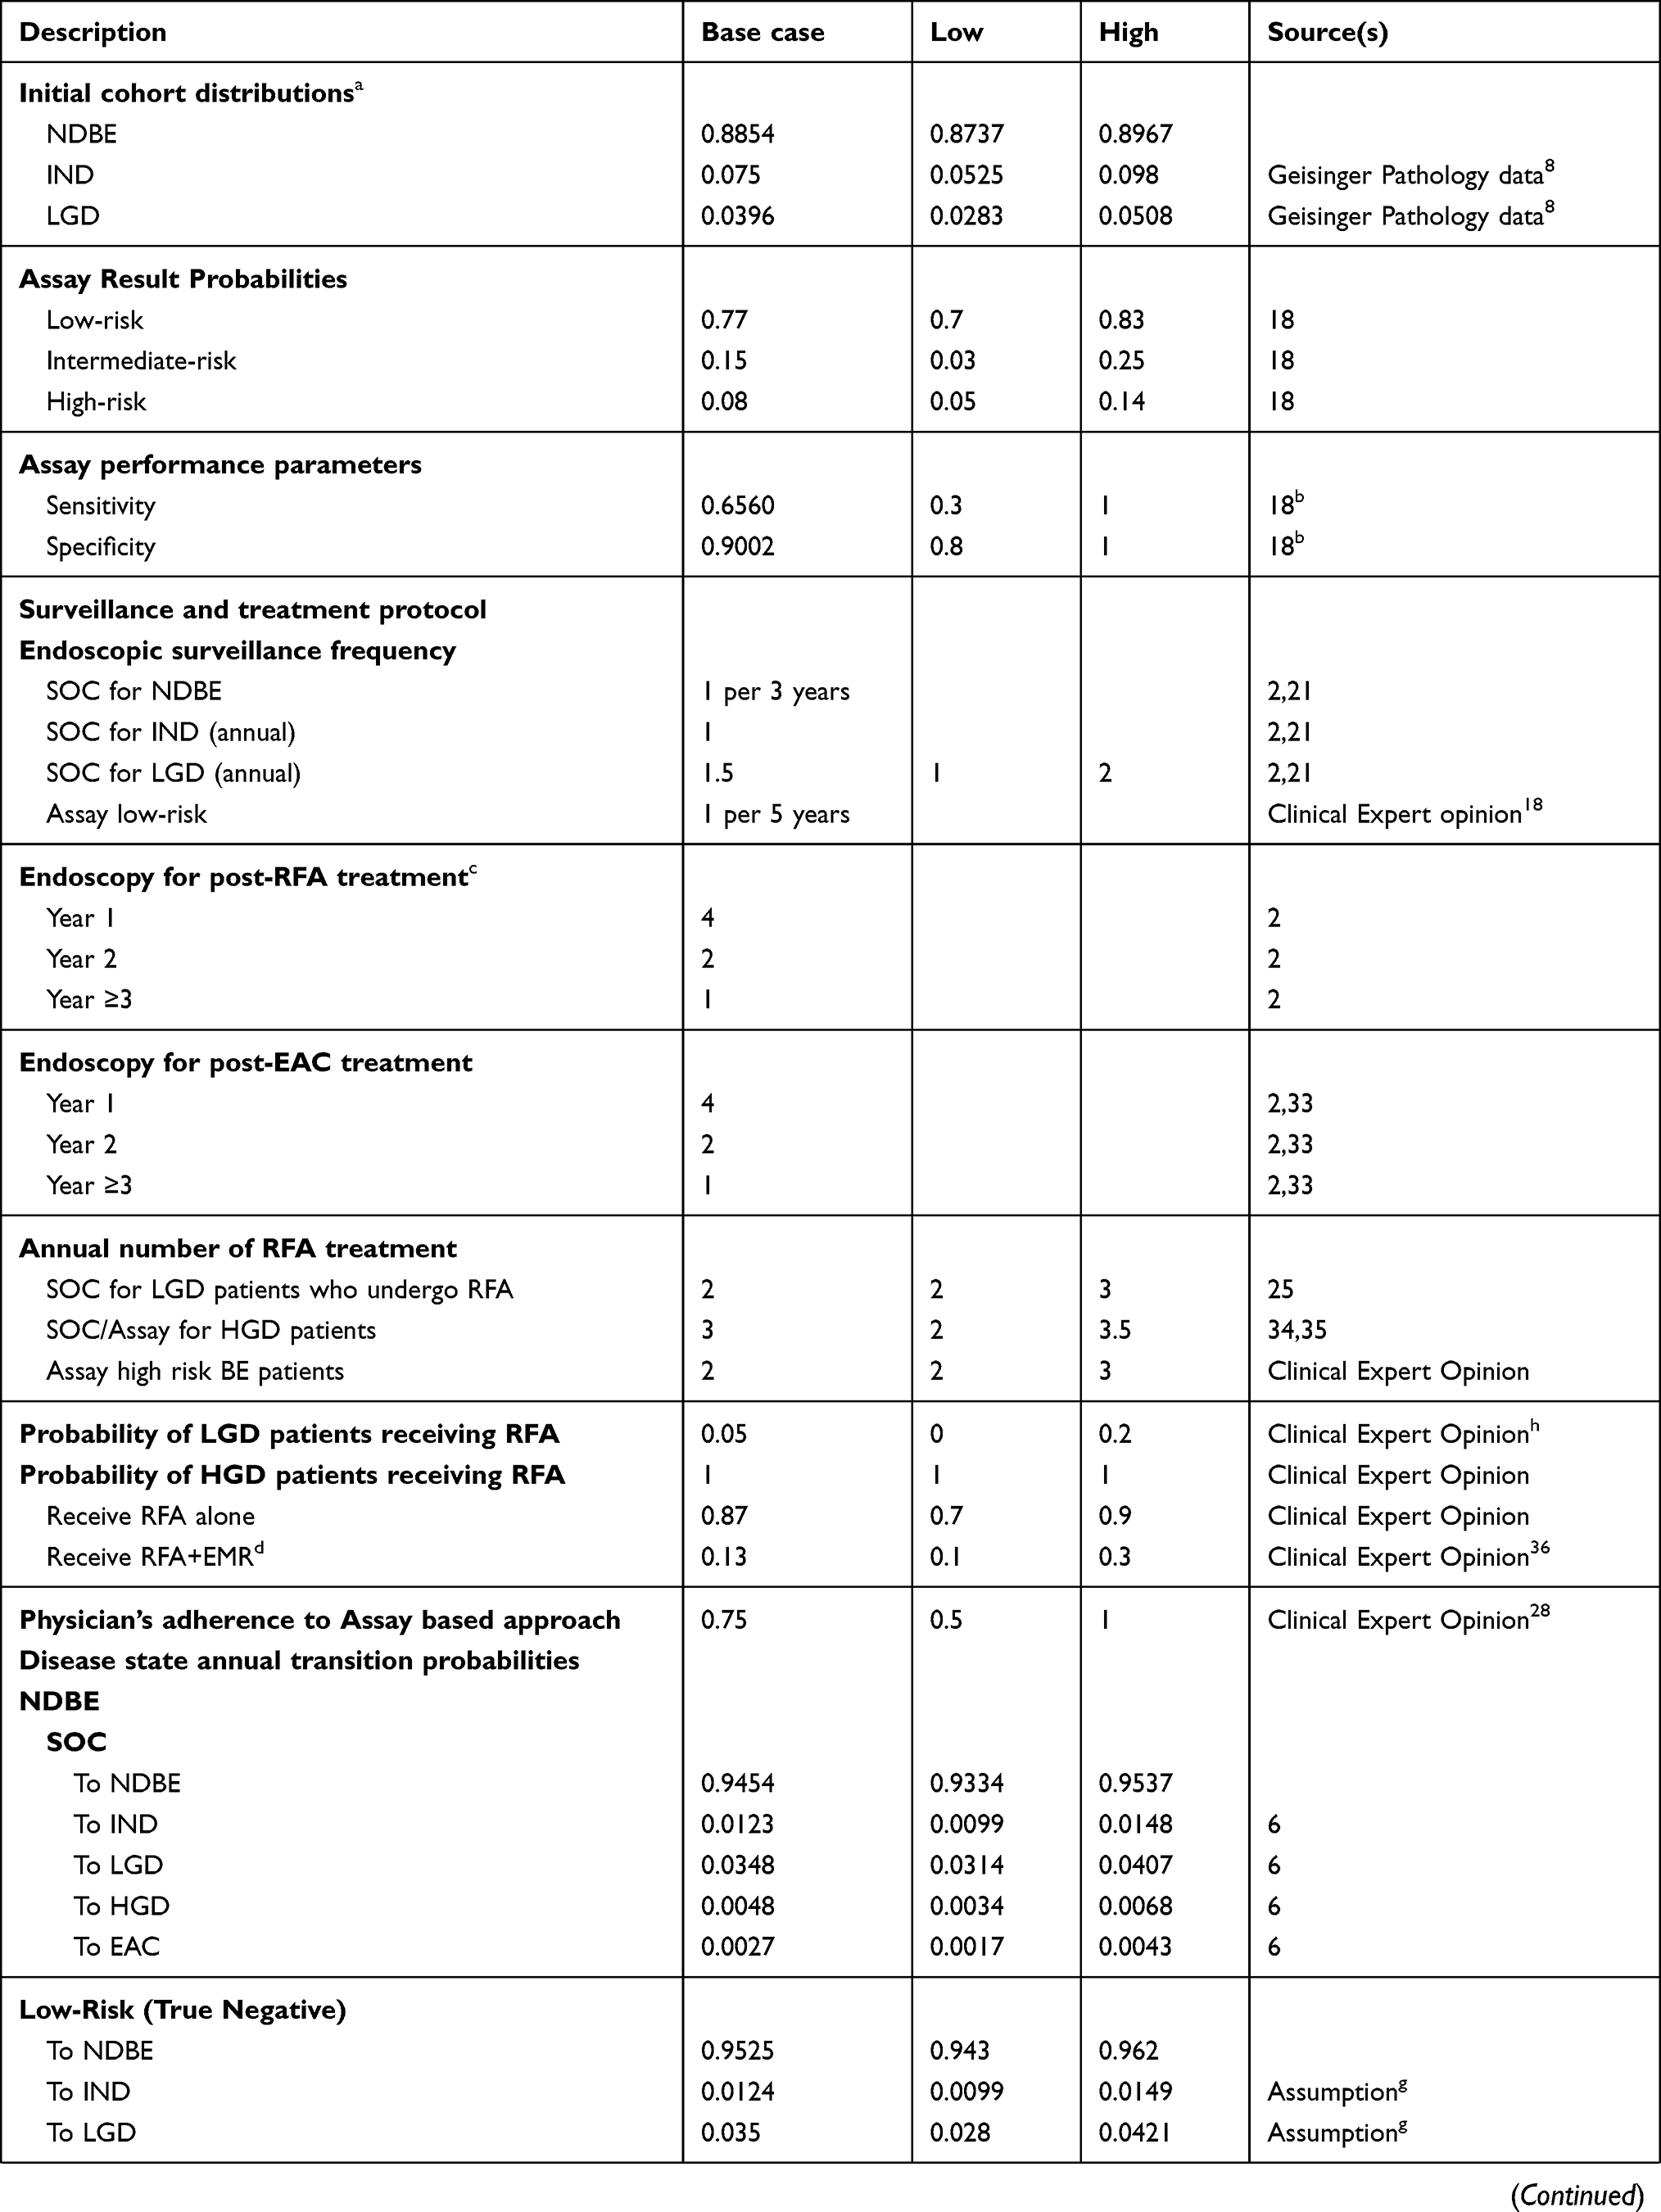 | 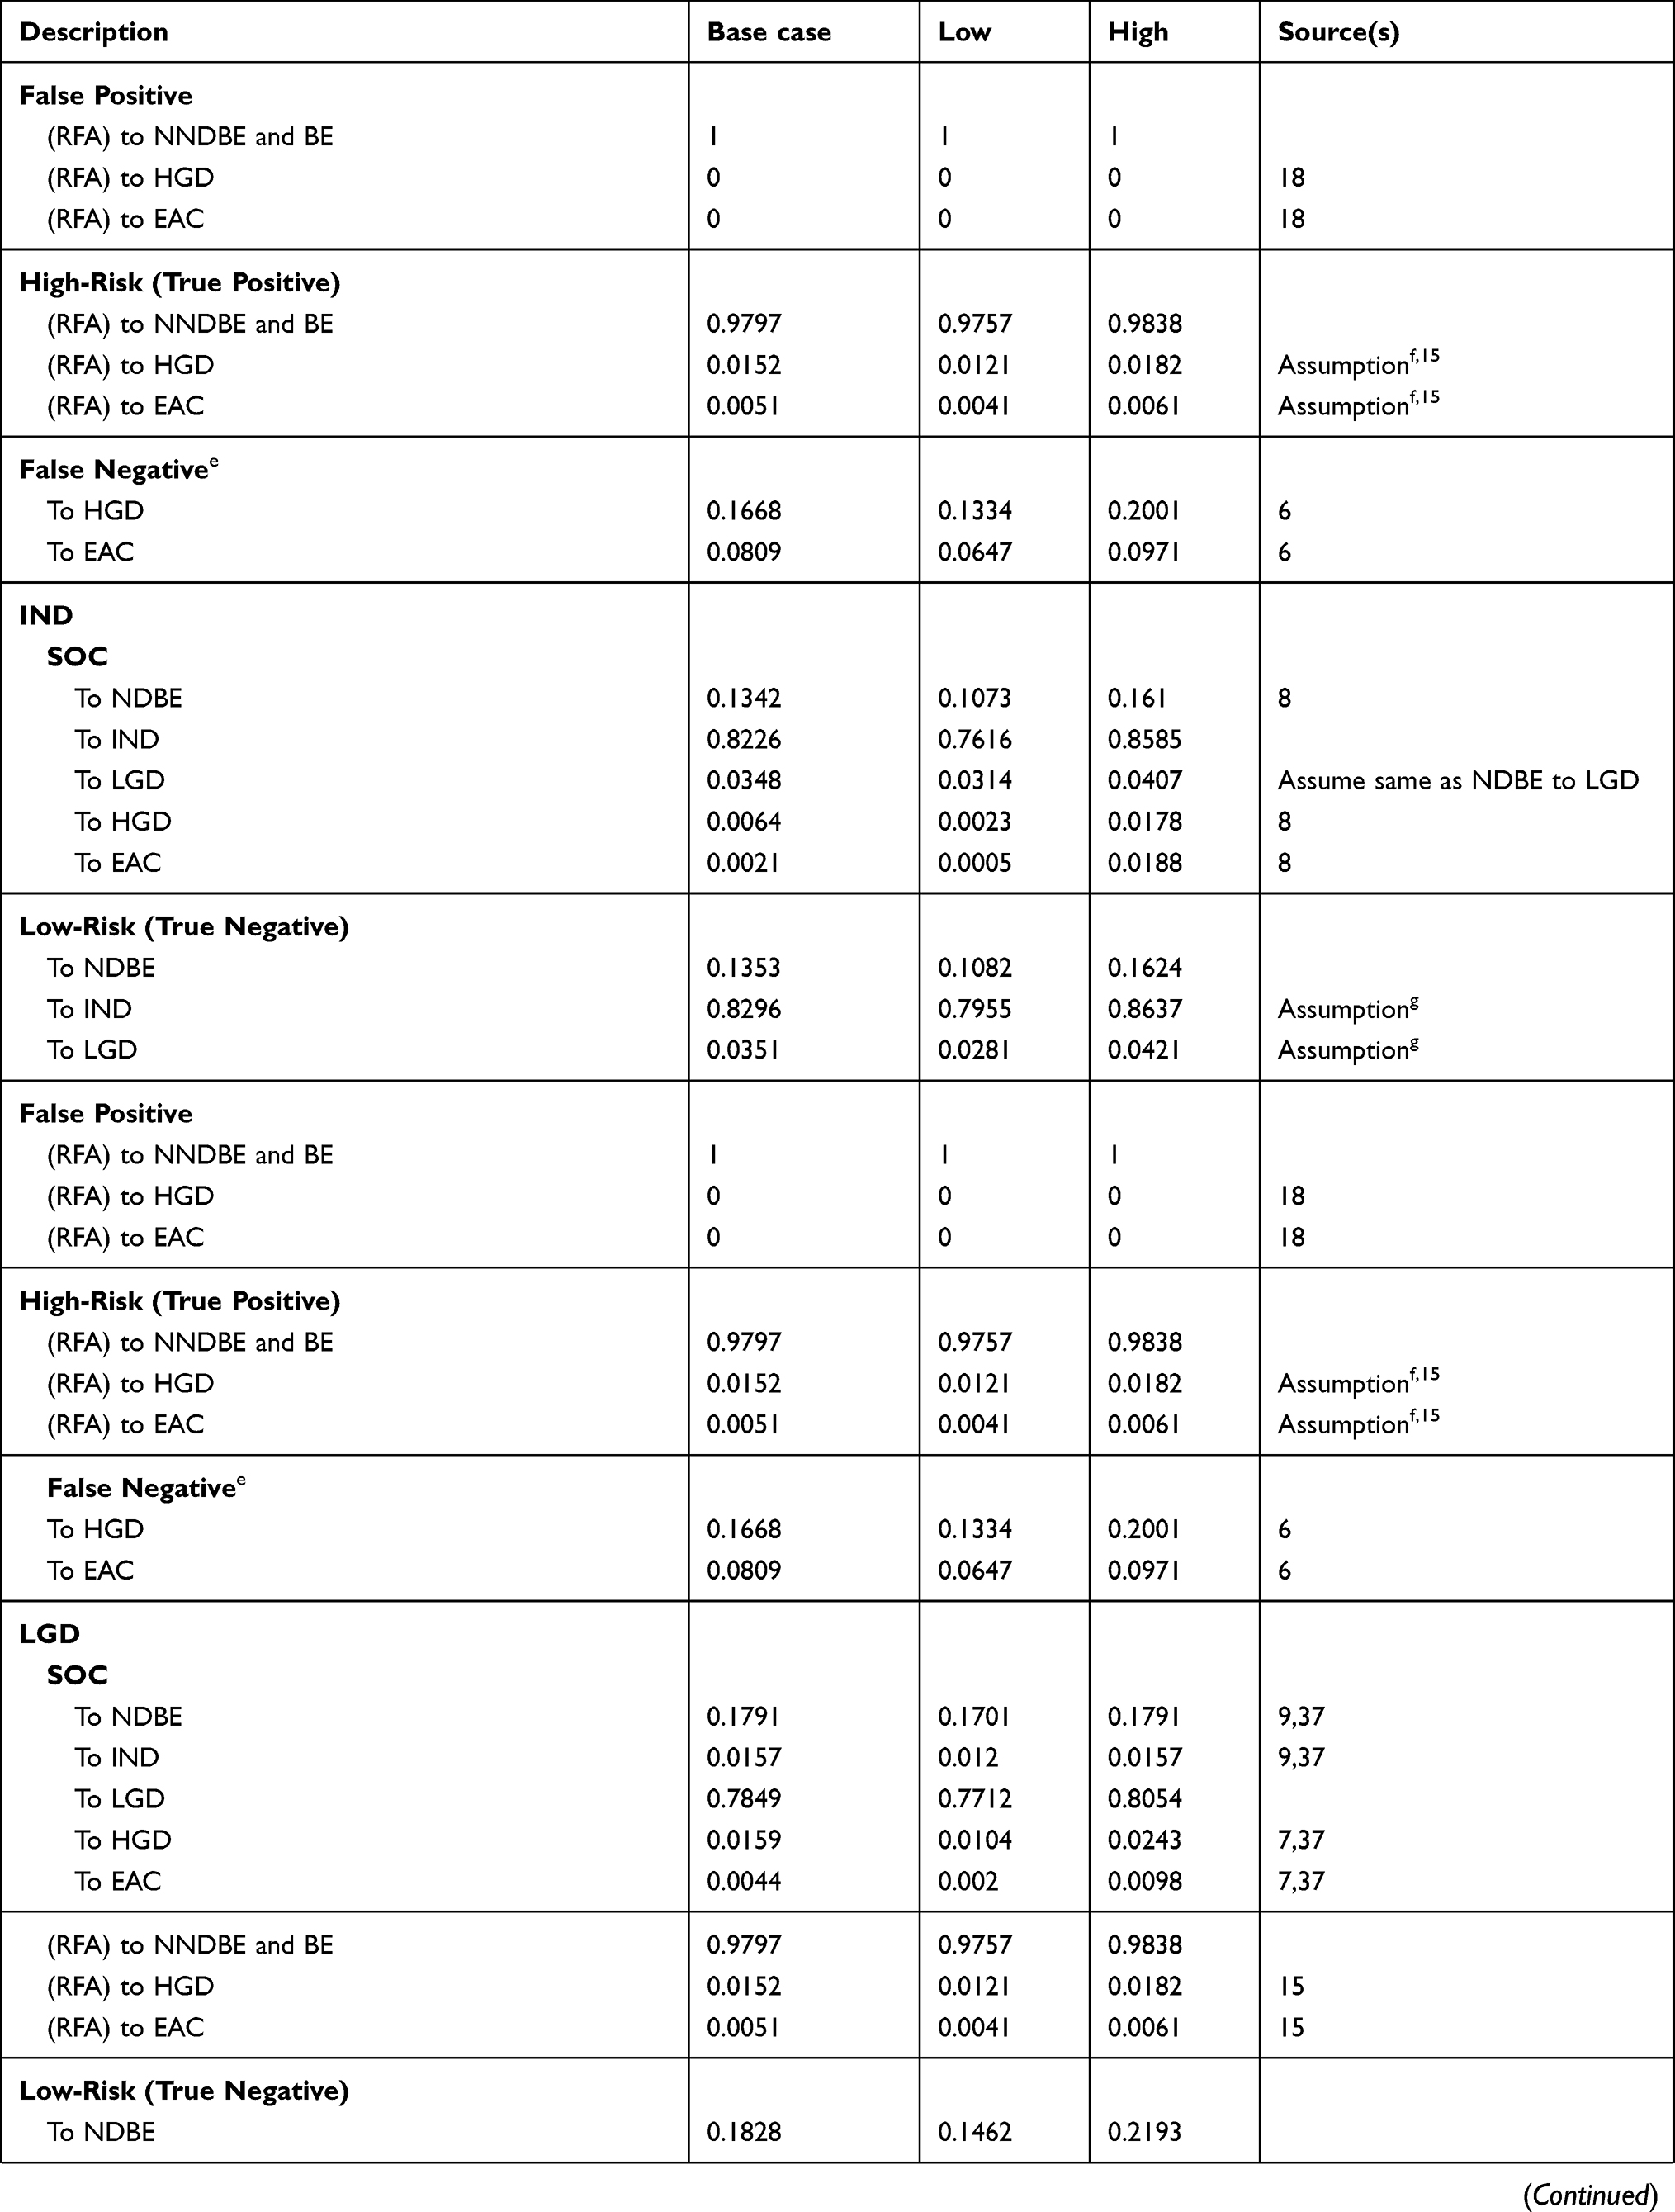 | 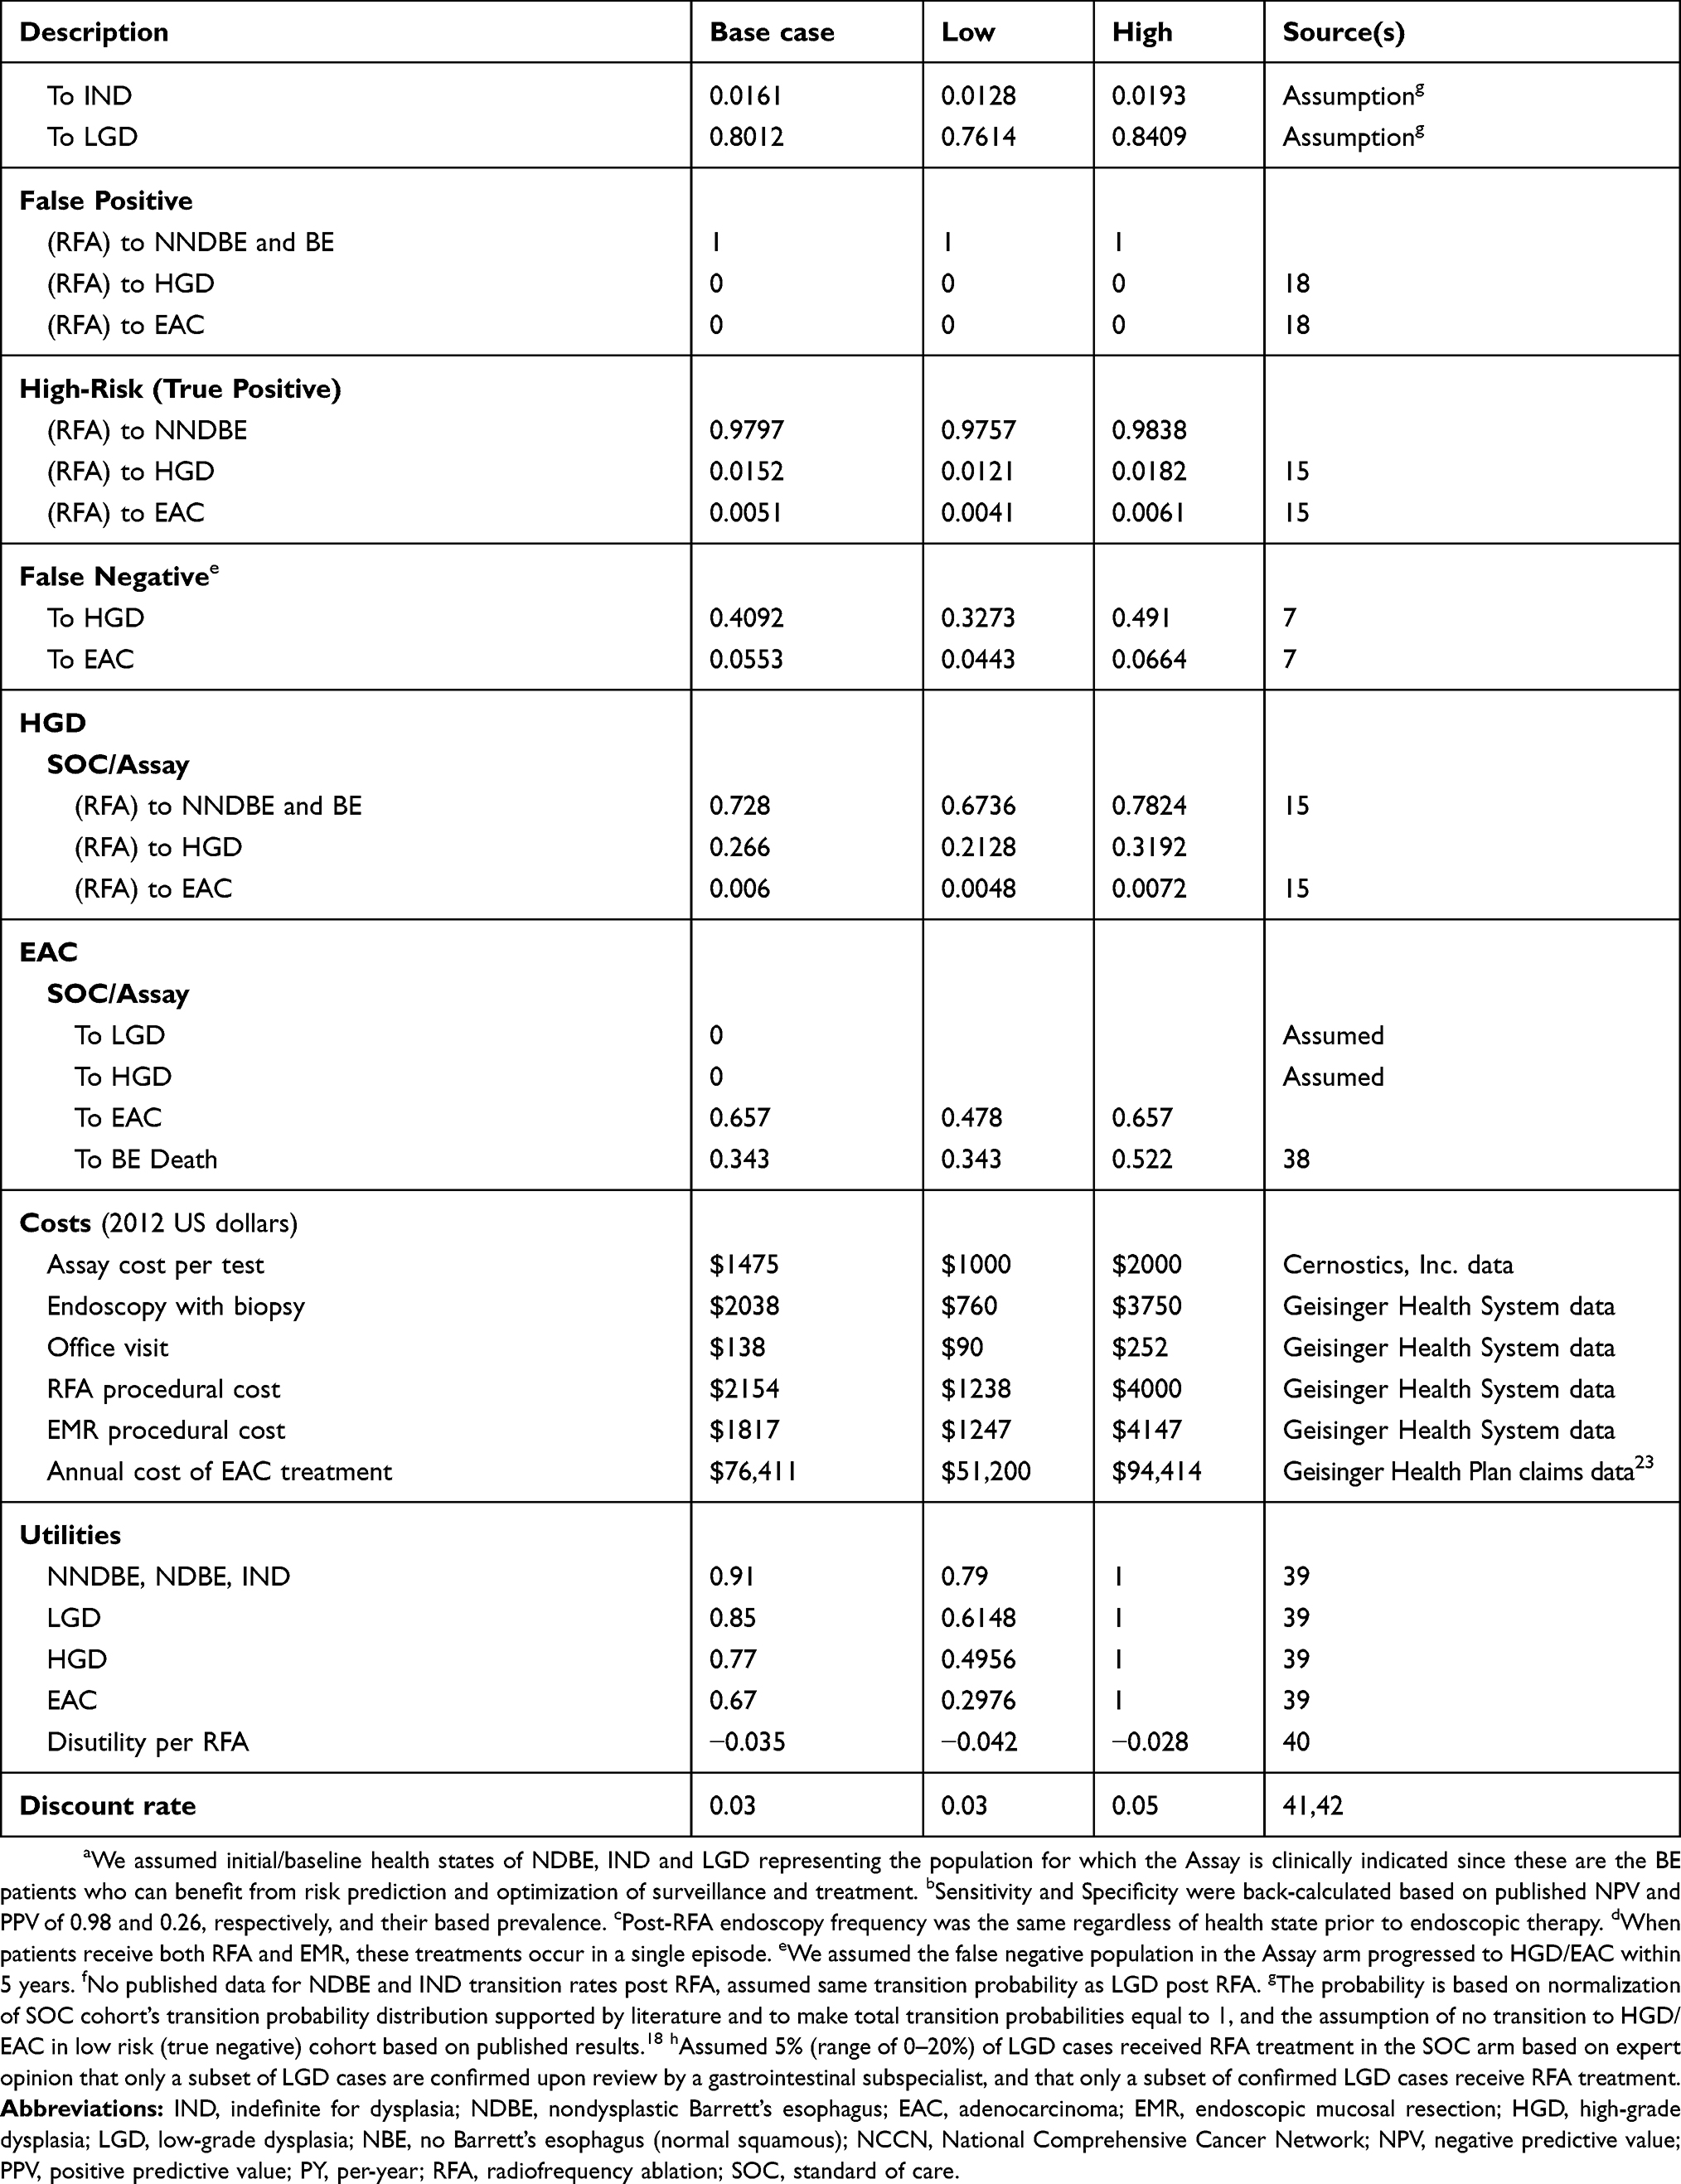 |
Table 1 Model Inputs |
Performance Of The Assay
The Assay effectiveness was based on reported prevalence-adjusted positive predictive value (PPV) and negative predictive value (NPV) from a published study.18 The sensitivity and specificity of the Assay were then back-calculated based on this published PPV and NPV and the prevalence base to allow sensitivity analysis on the test characteristic of the Assay.
Surveillance And Treatment Protocol
The SOC surveillance and treatment protocol was based on clinical guidelines2,21 and represents the clinical practice at GHS (Table 1). The practice is generalizable to other large healthcare systems and medical centers. The Assay stratifies patients into low-, intermediate- and high-risk categories and was applied at the start of year 1 in the model. Recommendations of surveillance and treatment for each risk category were based on clinical expert opinion from GHS and co-authors on the study describing the Assay.18 All patients who tested high-risk (true and false positive) received RFA alone (87%) or RFA with EMR (13%) and then followed the post-RFA endoscopic surveillance protocol. Patients who tested low-risk (true and false negative) received endoscopic surveillance every 5 years but no endoscopic treatments. Patients who tested intermediate-risk followed the SOC (detailed description of management of BE guided by the Assay in Table 2).
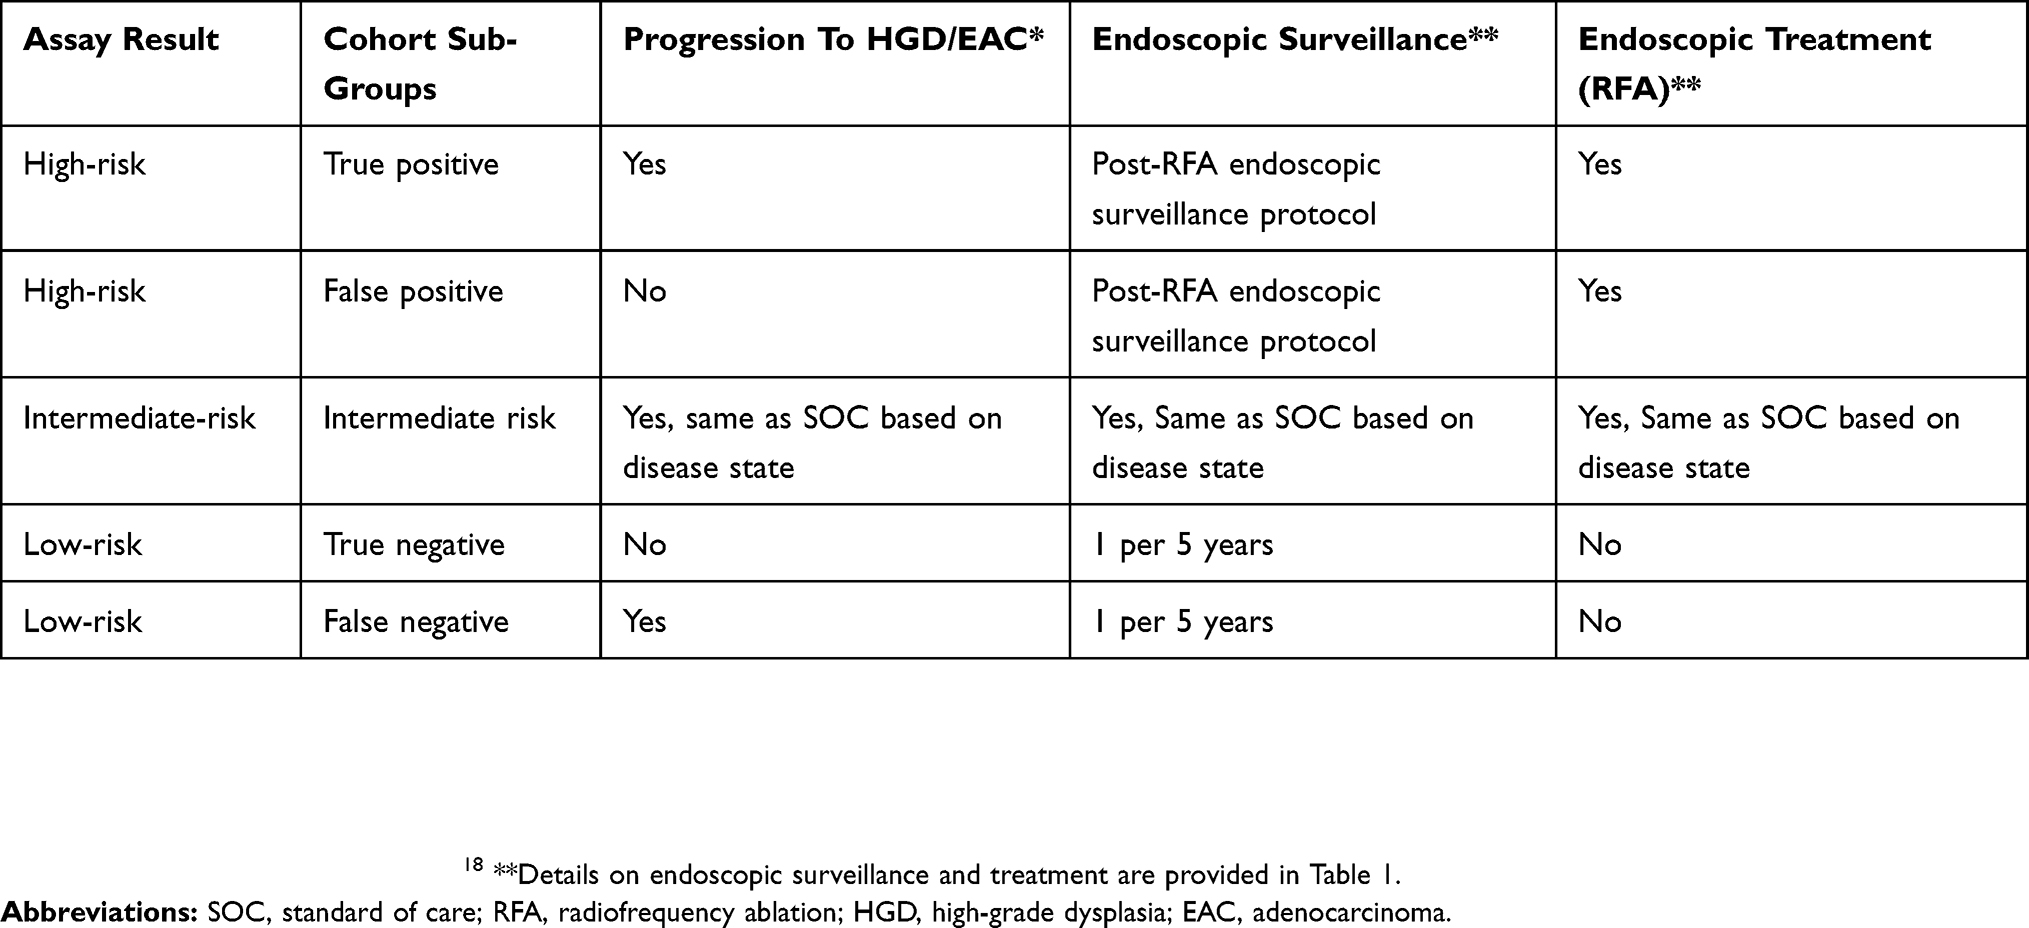 |
Table 2 Summary Of Assay Guided Surveillance And Treatment Protocol For BE |
Transition Probabilities
A comprehensive literature search was performed to determine recent and relevant estimates for model parameters (Table 1). Disease transition probabilities were derived from large multi-center studies published after 2010. The transition rates of BE sub-states to EAC have wide reported ranges and have a substantial impact on the cost-effectiveness of the Assay strategy. We incorporated the most current knowledge on transition rates based on literature searches, and compared these with ranges used in published economic decision models.14,22,23 External validation was completed by comparing the EAC incidence in the BE population after 5 years under the SOC approach generated by our model to the overall transition rate from BE to EAC based on published literature. We also completed one-way sensitivity analyses to show how changes in the annual transition rate to EAC would affect the ICER. The probability of death from causes other than EAC was represented in an age-dependent fashion based on 2008 US population life tables.24
Costs And Utilities
The study is from the perspective of a US health insurance payer with care delivered by an integrated health system. Direct medical costs for BE surveillance and treatment were estimated from GHS electronic medical records of health insurance payments. The information obtained on healthcare resource use for surveillance and treatment was used to develop cost parameter definitions including specific healthcare services, procedures and their respective quantities for: endoscopy, RFA, EMR and physician office visit. The annual cost of EAC treatment was based on data analysis of Geisinger Health Plan (GHP) 2012 claims data for 129 patients with EAC treated at GHS; Medicare reimbursement estimate was also used as lower bound estimate in sensitivity analysis.23 The cost of the Assay is a one-time cost based on average reimbursement rates from payors for codes used to bill for the Assay (provided by Cernostics, Inc). All costs were adjusted to 2012 US dollars (Table 1).
We used quality-adjusted life-years (QALYs) for the measurement of patient utility for preference-based health outcomes derived from published literature (Table 1). Costs and QALYs were discounted at an annual rate of 3% (3–5% in sensitivity analysis).
Model Assumptions
We assumed 8 health states for patients with BE (Figure 1B). Patients who received RFA treatment(s) either had complete eradication of intestinal metaplasia and transitioned permanently to no BE, or had persistent BE, or progressed to HGD/EAC (recurrent disease).15,25 We took consideration of imperfect physician adherence to new technology/strategy, and assumed 50–100% adherence (75% as base-case) to surveillance and treatment guided by the Assay. Additional model assumptions are indicated in Table 1.
Outcomes
The main outcomes of the Assay and SOC evaluated are direct medical care costs, QALYs, and the incremental cost-effectiveness ratio (ICER). The study also compared Assay versus SOC surveillance and treatment protocol-guided health state outcomes, endoscopic surveillance and RFA frequencies.
Analyses Performed
A base-case analysis was performed using the best estimates for all model parameters and inputs. One-way sensitivity analyses were performed to capture the effects of changes in individual parameters on the estimated model outcomes. In addition, probabilistic sensitivity analysis was performed with 10,000 iterations based on assigned probability distributions for each parameter to further evaluate the two strategies under the uncertainty in the data.
The protocol of this study (research protocol # 2012-0289) was reviewed by Geisinger IRB and was determined that this research protocol meets the criteria for exemption.
Results
Decision Analytic Model External Validation Results
The results generated from our decision analysis model indicated that the EAC annual incidence in the BE population under the SOC base-case analysis was 0.26%. Based on sensitivity analysis, the minimum value of EAC annual incidence was 0.18% and the maximum value was 0.45% (95% CI 0.22–0.37%). These values are within the reported range of annual transition rates from BE to EAC of 0.12%, 0.33% and 0.5%.5,26,27
Base-Case Results
Over a 5-year interval, the 10,000 patients in the Assay strategy arm received a cumulative total of 21,124 endoscopies, compared to 25,326 endoscopies in the SOC arm, representing a 16.6% reduction. Patients in the Assay arm received a cumulative total of 1822 endoscopic treatments compared to 1150 in SOC, representing a 58.4% increase. At the end of 5 years, the number of patients in the HGD, EAC and EAC-related death states were 36 vs 74, 35 vs 66 and 40 vs 64, respectively, for the Assay strategy compared to the SOC, i.e. 51.7%, 47.1%, and 37.6% decrease in the Assay strategy.
When the Assay was implemented for 1–3 years and compared to the SOC it resulted in increased costs and decreased QALYs due to a higher volume of RFA treatments in the initial year, since the model assumed all patients being tested at the outset, and intensive post-RFA endoscopic surveillance in patients scored high-risk by the Assay. At the end of 4 years, the ICER of Assay compared to SOC was US$259,974/QALY. After 5 years, the Assay was cost-effective at the $100,000/QALY willingness-to-pay threshold compared to the SOC with an ICER of $52,483/QALY (Table 3).
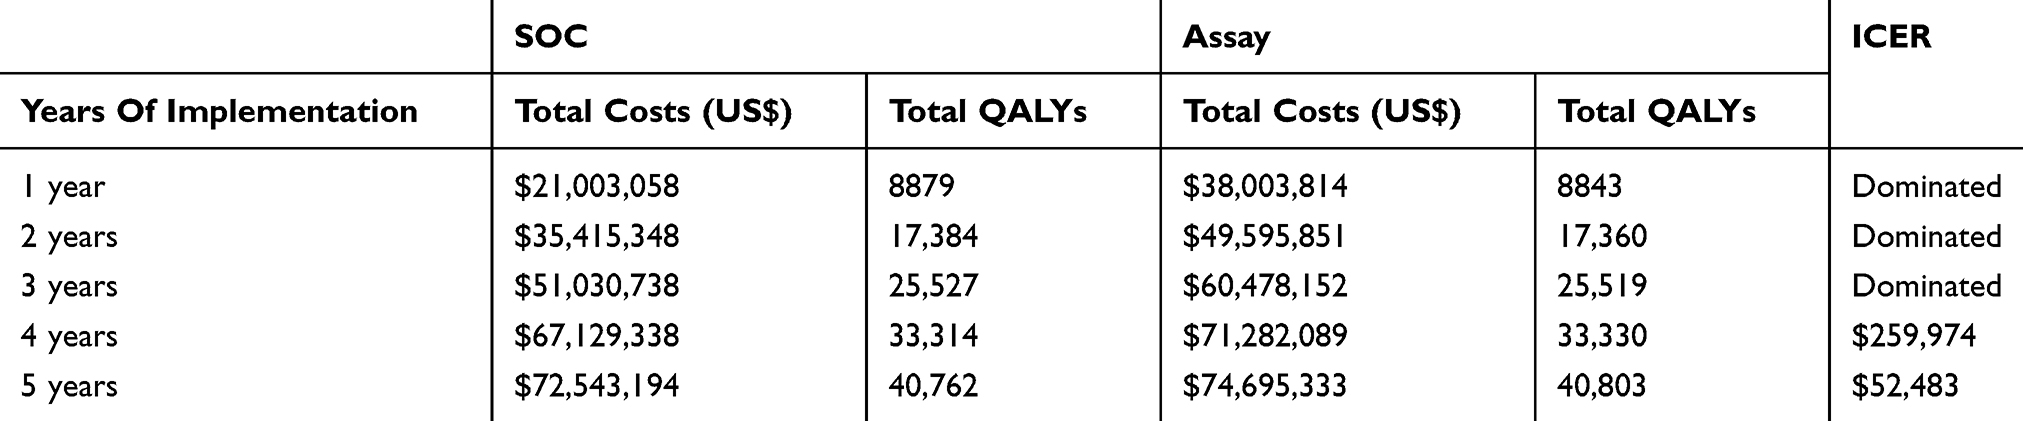 |
Table 3 Base-Case Analysis Of Assay vs SOC 1–5 Years: Total Costs, QALYs And ICER |
Sensitivity Analysis Results
Figure 2 summarizes the sensitivity analysis results of the model parameters that had largest impact on the ICER outcome. A higher annual transition rate from NDBE, IND or LGD to EAC, and lower Assay cost made the Assay strategy more cost-effective or even cost-saving (Figure 2A–D). A higher endoscopy cost resulted in the Assay strategy being more cost-effective, and cost-saving above $2800 (Figure 2E). Higher physician adherence to the Assay strategy increased the cost-effectiveness of the Assay; the threshold of adherence for the Assay being cost-effective was 67%. When adherence was as low as 55%, the ICER was $174,469/QALY and the Assay was cost-saving at 94% adherence (Figure 2F). Lower utility of EAC contributed to a more cost-effective Assay strategy as did higher utility of NDBE and IND.
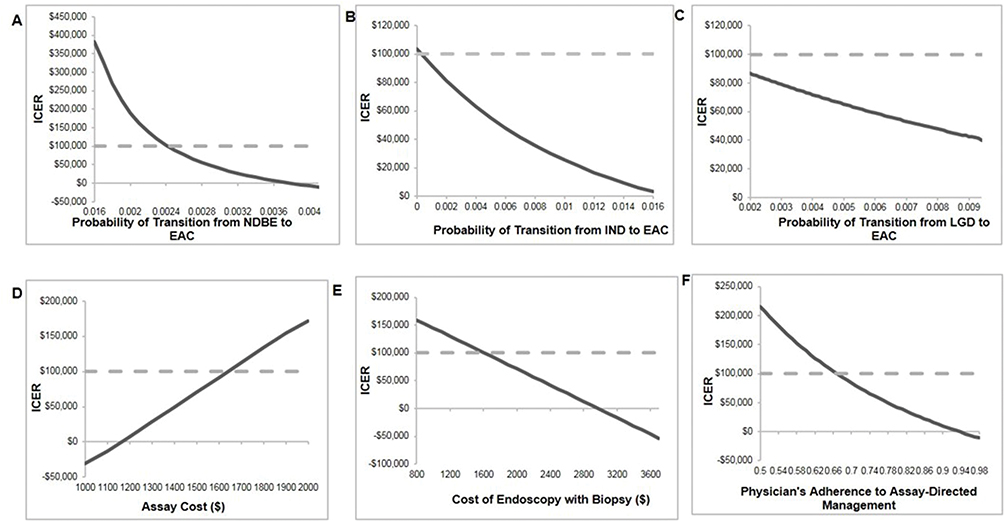 |
Figure 2 One-way sensitivity analysis: selected parameters with the largest impact on the ICER. (A–C) NDBE, IND and LGD annual progression rates to EAC in SOC, respectively; (D) assay cost; (E) cost of endoscopy with biopsy; (F) physician adherence rate to the Assay strategy (5-year surveillance interval for low risk, SOC surveillance for intermediate risk, endoscopic treatment for high risk). |
We also conducted sensitivity analysis on test performance (sensitivity and specificity). The threshold of sensitivity for cost-effectiveness at $100,000/QALY was 0.5060. Within the estimated range of specificity (0.8–1), the ICER remains below $100,000/QALY.
Probabilistic sensitivity analysis results showed that at a willingness-to-pay (WTP) threshold of $100,000 per QALY, the Assay was the preferred strategy with a 57.3% probability of being cost-effective compared to the SOC (Figure 3).
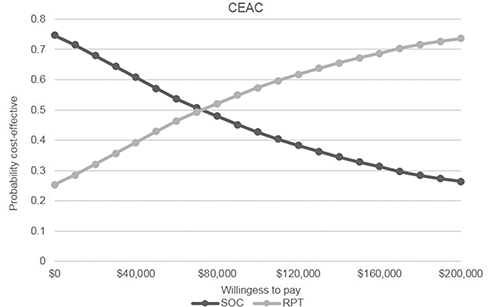 |
Figure 3 Probabilistic sensitivity analysis. Abbreviation: SOC, standard of care. |
Discussion
We evaluated the cost-effectiveness of a clinically available Assay to guide surveillance intervals and treatment decisions in a BE population from the perspective of a US health insurer with care delivered by an integrated health system. Based on our model assumptions, our findings demonstrated that the Assay would be cost-effective within 5 years of adoption. A surveillance interval of 5 years in BE patients scored low-risk by the Assay, independent of pathologic diagnosis (NDBE, IND, LGD), resulted in a 16.6% reduction in endoscopies. Targeting of endoscopic therapies to patients scored high-risk by the Assay increased the number of endoscopic treatments by 58.4%, which resulted in reducing the incidence of HGD, EAC and EAC-related deaths by 51.7%, 47.1%, and 37.6% over 5 years, respectively.
As the majority of patients with BE do not progress to HGD/EAC, there has been concern over the inefficiency of applying a uniform surveillance approach resulting in most patients unnecessarily undergoing frequent endoscopies with biopsies. Furthermore, most patients who do progress are missed by the current paradigm (i.e., not identified early and offered effective preventive treatment). Adoption of the Assay strategy evaluated in this study may simultaneously reduce unnecessary endoscopies and prevent overtreatment of low-risk patients, and target preventative therapies to high-risk patients, leading to a reduction in EAC incidence and mortality. While the Assay strategy was estimated to add cost during the initial 3 years of adoption, it was estimated to lower future costs and improve outcomes due to reduced surveillance in low-risk patients, and early treatment in high-risk patients over a 5-year period.
The transition rate from BE to EAC has a wide reported range and one-way sensitivity analysis indicated that a higher progression rate to EAC would make the Assay approach more cost-effective. The thresholds of progression rates to EAC were 0.0024, 0.0010 for NDBE and IND, respectively, to achieve cost-effectiveness at ICER WTP level of $100,000. The Assay approach remained cost-effective at 5 years even at the lower bound of the LGD to EAC progression rate (0.0020). The Assay strategy would be more cost-effective or even cost-saving at 5 years with a higher physician adherence rate, higher endoscopy cost, lower Assay cost, and lower EAC utility. In addition, based on the modeling results of years 1 to 5, the Assay strategy will likely become more cost-effective with longer follow-up, e.g. 10 years.
However, the findings of this study need to be interpreted carefully. Some of the model assumptions may generate bias favoring or against the Assay approach. We incorporated reported adherence of 51.2% to biopsy guidelines for BE surveillance and thus used 50% as lower bound of range for sensitivity analysis.28 Sensitivity analysis indicated that the threshold of adherence for the Assay being cost-effective was 67%. To our knowledge, our study is the first to apply consideration of physician adherence to modeling. The adherence rate may initially be lower due to adoption challenges, which would reduce the cost-effectiveness of the Assay approach. We conservatively assumed that all patients were tested at the beginning of the initial year, and those who tested high-risk received RFA in the initial year, which generated high upfront costs and disutility under the Assay approach. This assumption contributes to the results of Assay approach being dominated by SOC in years 1–3 until the benefits of preventing progression to HGD/EAC emerge in years 4–5. In practice, patients are more likely to be tested and receive treatments over an extended period. In addition, we conservatively assumed that the false negative population in the Assay arm progressed to HGD/EAC during the 5-year surveillance interval although it is likely that some of these patients may receive surveillance within 5 years and be identified with dysplasia and treated endoscopically.
Previous studies indicated potential cost-effectiveness of hypothetical risk-prediction biomarker tests for BE.13,14,29,30 Gordon et al reported that a biomarker test to prioritize patients for surveillance could be cost-effective at 41% sensitivity and 98% specificity, however, when used to select patients for endoscopic therapy the test resulted in increased costs and reduced QALYs compared to no surveillance.14 While the study by Gordon et al31 addressed a similar clinical problem in BE, our study utilized a different biomarker strategy of prioritizing high-risk patients for endoscopic therapy, intermediate-risk followed SOC, and low-risk patients for reduced frequency of surveillance, compared to current practice of surveillance.
One recent study concluded that the use of a biomarker assay to determine surveillance and treatment may be cost-saving compared to SOC.32 While this study reports some similar findings as this study, such as reduced transitions to HGD/EAC and reduced use of endoscopies due to the biomarker strategy, there are significant differences in study design. The study by Das et al included: i) a lifetime analysis until age 80; ii) extending surveillance intervals to 10 years in low-risk patients; iii) only NDBE patients at baseline; iv) higher transition rates to EAC based on studies published 1985–2001; and v) lower frequency of post-RFA surveillance and lack of RFA-associated short-term disutility. By contrast our study utilized a 5-year analysis with test NPV and PPV supported by a published clinical validation study, extended surveillance intervals to 5 years in low-risk patients to stay within clinical guidelines, included NDBE, IND and LGD cases at baseline based on population data, lower transition rates to EAC based on recent studies, a post-RFA surveillance frequency consistent with the latest guidelines and RFA-associated disutility, and also considered the effects of lack of physician adherence. These differences in study design and assumptions account for the differences in ICERs reported in our study compared to those reported in the cited study.32
The relatively high percentage of patients in the IND health state at baseline is specific to GHS, which is consistent with community practice settings where the majority of BE patients are surveilled. IND results in repeat endoscopies, which represents a significant clinical problem that will benefit from objective risk prediction.
This study has several limitations. The test performance was supported by a published validation study in which NPV and PPV were adjusted for disease prevalence due to the nested case-control study design. The progression of BE may vary between settings. However, a previously published study demonstrated that the Assay provided independent predictive information that outperformed predictions based on pathologic diagnosis, providing support for use of the Assay as an adjunct to the physician’s workup for BE patients. We acknowledge there is limited data/evidence to support the Assay-directed approach including the transition probabilities among disease states, and the appropriate surveillance and treatment plan under this approach.
However, we believe this study is an important contribution to the field since the test performance information is supported by a multi-center validation study involving a total of 366 patients with BE.18 This type of cost-effectiveness study with risk prediction test performance supported by a published validation study has never been available in previous literature where either theoretical biomarker models were utilized14 or a real test was modeled but without test performance supported by a published study.32 In addition, we conducted sensitivity analysis that indicated the test would be cost-effective at sensitivity of 0.506 or greater. Test specificity was less influential on cost-effectiveness outcomes which may mainly due to the availability of relatively safe and highly effective endoscopic therapies.15–17
Another potential limitation of this study is that the EAC costs were from a single source, and the true costs of treating EAC vary widely between patients. However, a range was used for sensitivity analysis incorporating a published estimate of Medicare reimbursement.23 There is uncertainty in the diagnosis of NDBE, IND and LGD due to known observer variation. The latest practice guidelines recommend endoscopic treatment for confirmed LGD or surveillance as an alternative. However, there is not yet any literature reporting the proportions of LGD patients treated versus receiving surveillance. We modeled 61.9 years as the age of patients at the start of the model based on data from GHS. There is frequently a delay between onset and diagnosis, however, there was inadequate data available on age of onset. BE mostly affects males, and in our model, we did not adjust by gender and relied on a Geisinger study population. The performance of the Assay was reported in a nested case-control study in which cases were sex- and age-matched to controls, and the majority were Caucasian. Therefore, it was not possible to evaluate whether the Assay was associated with sex, age or race, or to test the Assay cost-effectiveness in specific subsets. Future studies could involve comparing the cost-effectiveness of the Assay between specific subsets of patients, e.g. males versus females, long segment versus short segment BE, etc.
Conclusion
Given the model assumptions, this study indicates that the new Assay would be cost-effective by 5 years when implemented in a population of BE patients to guide surveillance and treatment decisions. The Assay is predicted to improve patient outcomes due to improving the effectiveness of surveillance and treatment protocols, resulting in fewer patients transitioning to HGD, EAC and death.
Acknowledgments
The study is partially funded by Cernostics, Inc. We thank Jeffrey Prichard, DO from Geisinger Health System for clinical expert opinions, James Pitcavage, MSPH, and Jonathon Bock, MBA for contributions to initial model development and analysis, and Dina Hassen, MPP for help with preparation of graphs and tables. We thank John Inadomi, MD at the University of Washington for advice on model development and analysis and clinical expert opinions. The preliminary findings of this study were presented at:
- Jing Hao, Susan Snyder, Rebecca Critchley-Thorne. Poster presentation. “A cost-effectiveness analysis of a test that predicts risk of malignant progression in Barrett’s Esophagus”. HCSRN, March 22, 2017. San Diego, CA and published in J Hao, SR Snyder, RJ Critchley-Thorne. A cost-effectiveness analysis of an adenocarcinoma risk prediction biomarker test for patients with Barrett’s esophagus. J Patient Cent Res Rev. 2017;4:149.
- Jing Hao, Susan Snyder, Rebecca Critchley-Thorne. Podium presentation: “A cost-effectiveness analysis of a test that predicts risk of malignant progression in Barrett’s Esophagus” Research Podium Presentations-Session II: Cancer Outcomes Studies. ISPOR, May 23, 2016. Washington DC and published in Hao J, Snyder SR, Pitcavage JM, Critchley-Thorne R. A Cost-Effectiveness Analysis of A Test That Predicts Risk of Malignant Progression In Barrett’s Esophagus. Value in Health. 2016;19(3):A6–A7.
- Jing Hao, Susan Snyder, Rebecca Critchley-Thorne. Poster presentation: “A Cost-Effectiveness Analysis of a Cancer Risk Prediction Test for Patients with Barrett’s Esophagus”. Digestive Disease Week (DDW) 2016, May 21, 2016, San Diego, CA and published in J Hao, SR Snyder, J Pitcavage, RJ Critchley-Thorne. Sa1261 A Cost-Effectiveness Analysis of a Cancer Risk Prediction Test for Patients With Barrett’s Esophagus. Gastroenterology. 2016;S260–S261.
Disclosure
RCT is an employee and stock holder of Cernostics, Inc. She also has patents US 10,018,631, EU 2686688, and AU 2012229102 issued. DLD holds stock options in Cernostics, Inc. JH, SRS and DLD are employees of Geisinger Health System that has a financial interest in Cernostics, Inc. The authors report no other conflicts of interest in this work.
References
1. Hayeck TJ, Kong CY, Spechler SJ, Gazelle GS, Hur C. The prevalence of Barrett’s esophagus in the US: estimates from a simulation model confirmed by SEER data. Dis Esophagus. 2010;23(6):451–457. doi:10.1111/j.1442-2050.2010.01054.x
2. Shaheen NJ, Falk GW, Iyer PG, Gerson LB. ACG clinical guideline: diagnosis and management of Barrett’s esophagus. Am J Gastroenterol. 2015;111(1):30–50. doi:10.1038/ajg.2015.322
3. Goldblum JR. Controversies in the diagnosis of Barrett esophagus and Barrett-related dysplasia: one pathologist’s perspective. Arch Pathol Lab Med. 2010;134(10):1479–1484. doi:10.1043/2010-0249-RA.1
4. Visrodia K, Singh S, Krishnamoorthi R, et al. Magnitude of missed esophageal adenocarcinoma after Barrett’s esophagus diagnosis: a systematic review and meta-analysis. Gastroenterology. 2016;150(3):599–607 e597. doi:10.1053/j.gastro.2015.11.040
5. Hvid-Jensen F, Pedersen L, Drewes AM, Sorensen HT, Funch-Jensen P. Incidence of adenocarcinoma among patients with Barrett’s esophagus. N Engl J Med. 2011;365(15):1375–1383. doi:10.1056/NEJMoa1103042
6. Wani S, Falk G, Hall M, et al. Patients with nondysplastic Barrett’s esophagus have low risks for developing dysplasia or esophageal adenocarcinoma. Clin Gastroenterol Hepatol. 2011;9(3):220–227. quiz e226. doi:10.1016/j.cgh.2010.11.008
7. Wani S, Falk GW, Post J, et al. Risk factors for progression of low-grade dysplasia in patients with Barrett’s esophagus. Gastroenterology. 2011;141(4):1179–1186, 1186 e1171. doi:10.1053/j.gastro.2011.06.055
8. Sinh P, Anaparthy R, Young PE, et al. Clinical outcomes in patients with a diagnosis of “indefinite for dysplasia” in Barrett’s esophagus: a multicenter cohort study. Endoscopy. 2015;47(8):669–674. doi:10.1055/s-0034-1391966
9. Duits LC, Phoa KN, Curvers WL, et al. Barrett’s oesophagus patients with low-grade dysplasia can be accurately risk-stratified after histological review by an expert pathology panel. Gut. 2015;64(5):700–706. doi:10.1136/gutjnl-2014-307278
10. Pohl H, Welch HG. The role of overdiagnosis and reclassification in the marked increase of esophageal adenocarcinoma incidence. J Natl Cancer Inst. 2005;97(2):142–146. doi:10.1093/jnci/dji024
11. American Cancer Society. Cancer facts & figures 2017. Available from: https://www.cancer.org/content/dam/cancer-org/research/cancer-facts-and-statistics/annual-cancer-facts-and-figures/2017/cancer-facts-and-figures-2017.pdf. Accessed October 9, 2019.
12. Inadomi JM, Sampliner R, Lagergren J, Lieberman D, Fendrick AM, Vakil N. Screening and surveillance for Barrett esophagus in high-risk groups: a cost-utility analysis. Ann Intern Med. 2003;138(3):176–186. doi:10.7326/0003-4819-138-3-200302040-00009
13. Inadomi JM. Surveillance in Barrett’s esophagus: a failed premise. Keio J Med. 2009;58(1):12–18.
14. Gordon LG, Mayne GC, Hirst NG, Bright T, Whiteman DC, Watson DI. Cost-effectiveness of endoscopic surveillance of non-dysplastic Barrett’s esophagus. Gastrointest Endosc. 2014;79(2):242–256 e246. doi:10.1016/j.gie.2013.07.046
15. Shaheen NJ, Overholt BF, Sampliner RE, et al. Durability of radiofrequency ablation in Barrett’s esophagus with dysplasia. Gastroenterology. 2011;141(2):460–468. doi:10.1053/j.gastro.2011.04.061
16. Bulsiewicz WJ, Kim HP, Dellon ES, et al. Safety and efficacy of endoscopic mucosal therapy with radiofrequency ablation for patients with neoplastic Barrett’s esophagus. Clin Gastroenterol Hepatol. 2013;11(6):636–642. doi:10.1016/j.cgh.2012.10.028
17. Phoa KN, van Vilsteren FG, Weusten BL, et al. Radiofrequency ablation vs endoscopic surveillance for patients with Barrett esophagus and low-grade dysplasia: a randomized clinical trial. JAMA. 2014;311(12):1209–1217. doi:10.1001/jama.2014.2511
18. Critchley-Thorne RJ, Duits LC, Prichard JW, et al. A tissue systems pathology assay for high-risk Barrett’s esophagus. Cancer Epidemiol Biomarkers Prev. 2016;25(6):958–968. doi:10.1158/1055-9965.EPI-15-1164
19. Critchley-Thorne RJ, Davison JM, Prichard JW, et al. A tissue systems pathology test detects abnormalities associated with prevalent high-grade dysplasia and esophageal cancer in Barrett’s esophagus. Cancer Epidemiol Biomarkers Prev. 2017;26(2):240–248. doi:10.1158/1055-9965.EPI-16-0640
20. Prichard JW, Davison JM, Campbell BB, et al. TissueCypher: a systems biology approach to anatomic pathology. J Pathol Inform. 2015;6:48. doi:10.4103/2153-3539.163987
21. Spechler SJ, Sharma P, Souza RF, Inadomi JM, Shaheen NJ. American Gastroenterological Association medical position statement on the management of Barrett’s esophagus. Gastroenterology. 2011;140(3):1084–1091. doi:10.1053/j.gastro.2011.01.030
22. Inadomi JM, Somsouk M, Madanick RD, Thomas JP, Shaheen NJ. A cost-utility analysis of ablative therapy for Barrett’s esophagus. Gastroenterology. 2009;136(7):
23. Hur C, Choi SE, Rubenstein JH, et al. The cost effectiveness of radiofrequency ablation for Barrett’s esophagus. Gastroenterology. 2012;143(3):567–575. doi:10.1053/j.gastro.2012.05.010
24. Arias E. United States life tables 2008. NVSS. 2012;61.
25. Small AJ, Araujo JL, Leggett CL, et al. Radiofrequency ablation is associated with decreased neoplastic progression in patients with Barrett’s esophagus and confirmed low-grade dysplasia. Gastroenterology. 2015;149(3):
26. Desai TK, Krishnan K, Samala N, et al. The incidence of oesophageal adenocarcinoma in non-dysplastic Barrett’s oesophagus: a meta-analysis. Gut. 2012;61(7):970–976. doi:10.1136/gutjnl-2011-300730
27. Shaheen NJ, Crosby MA, Bozymski EM, Sandler RS. Is there publication bias in the reporting of cancer risk in Barrett’s esophagus? Gastroenterology. 2000;119(2):333–338.
28. Abrams JA, Kapel RC, Lindberg GM, et al. Adherence to biopsy guidelines for Barrett’s esophagus surveillance in the community setting in the United States. Clin Gastroenterol Hepatol. 2009;7(7):736–742. quiz 710. doi:10.1016/j.cgh.2008.12.027
29. Rubenstein JH, Vakil N, Inadomi JM. The cost-effectiveness of biomarkers for predicting the development of oesophageal adenocarcinoma. Aliment Pharmacol Ther. 2005;22(2):135–146. doi:10.1111/j.1365-2036.2005.02536.x
30. Saxena N, Inadomi JM. Effectiveness and cost-effectiveness of endoscopic screening and surveillance. Gastrointest Endosc Clin N Am. 2017;27(3):397–421. doi:10.1016/j.giec.2017.02.005.
31. Rubenstein JH. Improving the efficiency of Barrett’s esophagus management: do biomarkers hit the mark? Gastrointest Endosc. 2014;79(2):257–259. doi:10.1016/j.gie.2013.09.003.
32. Das A, Callenberg KM, Styn MA, Jackson SA. Endoscopic ablation is a cost-effective cancer preventative therapy in patients with Barrett’s esophagus who have elevated genomic instability. Endosc Int Open. 2015;4(5):E549–E559.
33. National Comprehensive Cancer Network. NCCN guideline for patients–esophageal cancer. Available from: http://www.nccn.org/patients/guidelines/esophageal/files/assets/common/downloads/files/esophageal.pdf.
34. Shaheen NJ, Sharma P, Overholt BF, et al. Radiofrequency ablation in Barrett’s esophagus with dysplasia. N Engl J Med. 2009;360(22):2277–2288. doi:10.1056/NEJMoa0808145
35. Pouw RE, Wirths K, Eisendrath P, et al. Efficacy of radiofrequency ablation combined with endoscopic resection for barrett’s esophagus with early neoplasia. Clin Gastroenterol Hepatol. 2010;8(1):23–29. doi:10.1016/j.cgh.2009.07.003
36. Pasricha S, Bulsiewicz WJ, Hathorn KE, et al. Durability and predictors of successful radiofrequency ablation for Barrett’s esophagus. Clin Gastroenterol Hepatol. 2014;12(11):1840–1847 e1841. doi:10.1016/j.cgh.2014.04.034
37. Curvers WL, Ten Kate FJ, Krishnadath KK, et al. Low-grade dysplasia in Barrett’s esophagus: overdiagnosed and underestimated. Am J Gastroenterol. 2010;105(7):1523–1530. doi:10.1038/ajg.2010.171
38. American Cancer Society. Cancer facts & figures 2015. Available from: http://www.cancer.org/acs/groups/content/@editorial/documents/document/acspc-044552.pdf.
39. Gerson LB, Ullah N, Hastie T, Goldstein MK. Does cancer risk affect health-related quality of life in patients with Barrett’s esophagus? Gastrointest Endosc. 2007;65(1):16–25.
40. de Boer AG, Stalmeier PF, Sprangers MA, et al. Transhiatal vs extended transthoracic resection in oesophageal carcinoma: patients’ utilities and treatment preferences. Br J Cancer. 2002;86(6):851–857. doi:10.1038/sj.bjc.6600203
41. Haddix A. Prevention Effectiveness: A Guide to Decision Analysis and Economic Evaluation.
42. Graham JD. Valuing the future: OMB’s refined position. Univ Chi Law Rev. 2007;7:1.
 © 2019 The Author(s). This work is published and licensed by Dove Medical Press Limited. The
full terms of this license are available at https://www.dovepress.com/terms
and incorporate the Creative Commons Attribution
- Non Commercial (unported, 3.0) License.
By accessing the work you hereby accept the Terms. Non-commercial uses of the work are permitted
without any further permission from Dove Medical Press Limited, provided the work is properly
attributed. For permission for commercial use of this work, please see paragraphs 4.2 and 5 of our Terms.
© 2019 The Author(s). This work is published and licensed by Dove Medical Press Limited. The
full terms of this license are available at https://www.dovepress.com/terms
and incorporate the Creative Commons Attribution
- Non Commercial (unported, 3.0) License.
By accessing the work you hereby accept the Terms. Non-commercial uses of the work are permitted
without any further permission from Dove Medical Press Limited, provided the work is properly
attributed. For permission for commercial use of this work, please see paragraphs 4.2 and 5 of our Terms.