Back to Journals » OncoTargets and Therapy » Volume 13
A Comprehensive Risk Assessment Model for Ovarian Cancer Patients with Phospho-STAT3 and IL-31 as Immune Infiltration Relevant Genes
Authors Wang X, Lin F, Li J, Wang H
Received 25 March 2020
Accepted for publication 22 May 2020
Published 16 June 2020 Volume 2020:13 Pages 5617—5628
DOI https://doi.org/10.2147/OTT.S254494
Checked for plagiarism Yes
Review by Single anonymous peer review
Peer reviewer comments 2
Editor who approved publication: Dr Federico Perche
Xue Wang,1,2 Fei-kai Lin,1,2 Jia-rui Li,1 Hu-sheng Wang1
1Department of Obstetrics & Gynecology, Xin Hua Hospital Affiliated to Shanghai Jiao Tong University School of Medicine, Shanghai 200092, People’s Republic of China; 2Shanghai Jiao Tong University School of Medicine, Shanghai 200025, People’s Republic of China
Correspondence: Hu-sheng Wang; Jia-rui Li
Department of Gynaecology and Obstetrics, Xinhua Hospital, Shanghai Jiao Tong University School of Medicine, Shanghai 200092, People’s Republic of China
Tel +86-021-2507-8877
; Tel +86-021-6969-2701
Email [email protected]; [email protected]
Introduction: Ovarian carcinoma is a malignant tumor with a high mortality rate and a lack of effective treatment options for patients at advanced stages. For improving outcomes and helping patients with poor prognosis, choose a suitable therapy and an excellent risk assessment model and new treatment options are needed.
Materials and Methods: Ovarian cancer gene expression profile of GSE32062 was downloaded from the NCBI GEO database for screening differentially expressed genes (DEGs) between well and poor prognosis groups using limma package in R (version 3.4.1). Prognosis-related genes and clinical prognostic factors were obtained from univariate and multivariate Cox regression analyses, and a comprehensive risk assessment model was constructed using a Pathway Dysregulation Score (PDS) matrix, Cox-Proportional Hazards (Cox-PH) regression, as well as L1-least absolute shrinkage and selection operator (L1-LASSO) penalization. Then, significant DEGs were converted to pathways and optimal prognosis-related pathways were screened. Finally, risk prediction models based on pathways, genes involved in pathways, and comprehensive clinical risk factors with pathways were built. Their prognostic functions were assessed in verification sets. Besides, genes involved in immune-pathways were checked for immune infiltration using immunohistochemistry.
Results: A superior risk assessment model involving 9 optimal combinations of pathways and one clinical factor was constructed. The pathway-based model was found to be superior to the gene-based model. Phospho-STAT3 (from JAK-STAT signaling pathway) and IL-31 (from DEGs) were found to be related to immune infiltration.
Conclusion: We have generated a comprehensive risk assessment model consisting of a clinical risk factor and pathways that showed a possible bright foreground. The set of significant pathways might play as a better prognosis model which is more accurate and applicable than the DEG set. Besides, p-STAT3 and IL-31 showing correlation to immune infiltration of ovarian cancer tissues may be potential therapeutic targets for treating ovarian cancers.
Keywords: ovarian cancer, prognosis-related pathways, comprehensive risk assessment model, immune infiltration
Introduction
Ovarian carcinoma is a malignant tumor that has a high mortality rate.1 With the recent increase in the world’s aging population, the incidence of ovarian carcinoma has also increased;2 the mortality rate for ovarian cancer is higher for women over the age of 65 due to the difficulty in early diagnosis and the survival rate is less than 30%.3 Additionally, there is a lack of treatment options available for patients at advanced stages of the disease. To help patients with a poor prognosis get better nursing, an excellent risk assessment model to identify patients with poor prognosis after surgery needs to be constructed. This can contribute to the understanding of ovarian cancer pathogenesis and management of its patients. Another is to find new cures for patients with poor prognosis.
Firstly, clinical features are commonly used as important factors for predicting the patient’s outcome, but sometimes it becomes very difficult to make a credible prediction. Numerous related genes4–6 and transcripts7,8 have been identified as cancer biomarkers, that could benefit the malignancy diagnosis. However, a single gene is not a competent model as it ignores the inter-gene associations and pathways. Recently, co-expressed gene modules9 and pathway models have also emerged as potential tools to improve the prognosis of ovarian cancer.10 Models that combine genes with pathways and clinical features are considered to be useful; they can be exploited and analyzed using various bioinformatics methods.11–13 Secondly, the identification of cancer biomarkers is key, because they usually act as hub genes in tumorigenesis and metastasis. In recent years, immunotherapy has captured the interest of researchers, clinicians, and pharmaceutical companies, particularly due to its promise in treating various forms of cancer.14,15 The resulting immune infiltration in ovarian cancer tissues is a major prognostic factor.16 Therefore, there is a biological rationale for the development of immunotherapy in ovarian cancer based on identifying genes related to immune infiltration, which may benefit the patients with poor prognosis.
In this research, a comprehensive ovarian cancer risk assessment model consisting of prognosis-related pathways and clinic factors was studied, using large-scale bioinformatics analysis and based on the Pathway Dysregulation Score (PDS) matrix, Cox-Proportional Hazards (Cox-PH) regression, and L1-least absolute shrinkage and selection operator (L1-LASSO) penalization. We also generated a gene-based assessment model based on prognosis-related gene biomarkers and a pathway-based assessment model on prognosis-related pathways. When tested on the training set and five validation sets using Kaplan–Meier survival analysis and receiver operating characteristic (ROC) curves, the comprehensive risk assessment model with clinical factors and prognosis-related pathways showed a sound prediction than the gene model and the pathway model. Phospho-STAT3 (p-STAT3) and IL-31 were also found to be related to immune infiltration as indicators to patient survival times and could serve as potential therapeutic targets for patients with poor prognosis.
Materials and Methods
Data and Grouping
The ovarian cancer gene expression profiling data were obtained from the databases, the Cancer Genome Atlas (TCGA) and the Gene Expression Omnibus (GEO). The clinical characteristics of the training and validation sets are listed in Table S1.
GSE32062,17 the training set used for establishing the primary model, has 260 expression profiles downloaded from the GEO database (http://www.ncbi.nlm.nih.gov/geo/). The platform of GPL6480, Agilent-014850 Whole Human Genome Microarray 4×44K was used for the expression array of GSE32062.
Five independent datasets were used as validation sets. One was obtained from the TCGA database (https://gdc-portal.nci.nih.gov/). It contained 419 mRNA-seq expression profiles of ovarian tumors; Illumina HiSeq 2000 RNA Sequencing was used. The other 4 datasets that were obtained from GEO were GSE49997, GSE8842, GSE26712, and GSE31245, and their platforms were GPL2986 ABI Human Genome Survey Microarray Version 2, GPL5689 Agilent Human 1 cDNA Microarray, GPL96 [HG-U133A] Affymetrix Human Genome U133A Array, and GPL8300 [HG_U95Av2] Affymetrix Human Genome U95 Version 2 Array, respectively.
Data Pre-Processing and Differentially Expressed Genes (DEGs) Selection
For the data that was downloaded from the Affymetrix platform (GSE26712 and GSE31245), the background was corrected, quantiles were normalized and complementarity of missing values was found, which were conducted using the oligo package in R language (version 3.4.1) (http://www.bioconductor.org/packages/release/bioc/html/oligo.html).18 For GSE32062, GSE49997 and GSE8842, the limma package in R language was utilized (https://bioconductor.org/packages/release/bioc/html/limma.html).19 Probes were annotated according to the annotation platform, and an approximately normal distribution was yielded using log2 transformation. TCGA data were subjected to quantile normalization using the preprocess core package20 in R language (version 3.4.1) (http://bioconductor.org/packages/release/bioc/html/prepro-cessCore.html).
In the GSE32062 training set, patients with relapse and recurrence within 6 months and death were assigned into the poor prognosis group while those with recurrence after more than 24 months were assigned into well prognosis group. Screening of DEGs was performed between two groups using the limma package with the threshold of FDR < 0.05 and |logFC| > 0.263.
Screening Prognosis-Related Genes and Clinical Factors
Univariate and multivariate Cox regression analyses21 were performed to investigate the significant DEGs and the clinical factors of samples using survival package in R language (version 3.4.1) (http://bioconductor.org/packages/survivalr/). A P-value of less than 0.05, obtained by the Log rank test, was set as the significant threshold. A two-way hierarchical clustering analysis based on the centered Pearson correlation algorithm22 was conducted for identifying prognosis-related DEGs and clinical factors using the heatmap package in R (version 3.4.1) (https://bioconductor.org/packages/release/bioc/html/pheatmap.html).23
Prognostic Gene-Related Risk Pathways Screening
An annotation file (c2.cp.v6.0.symbols.gmt) containing 217 Biocarta and 186 KEGG accessions were downloaded from the Gene Set Enrichment Analysis (GSEA) database. Then, the matrix of prognosis-related gene expression was converted to a PDS matrix based on a principal components analysis (PCA) dimensionality reduction algorithm using the pathifier package24 in R language (version 3.4.1) (http://bioconductor.org/packages/pathifier/). Finally, the identified pathways were used to fit the Cox-PH model based on the L1-LASSO estimation25 for selecting the optimal panel of prognosis-related pathways. The optimal value for penalization coefficient lambda was selected by running cross-validation likelihood (cvl) 1000 times.
Construction and Verification of Risk Assessment Model Based on Pathways
Based on the optimal panel of prognosis-related pathways, a pathway-based risk assessment model was constructed and the Prognosis Index (PI) of each sample was calculated. The median score of PI was used as the cut-off point, and samples in the training set were divided into high and low-risk groups. The survival package was used to draw Kaplan–Meier survival curves for evaluating the relationship between this risk model, and the outcomes of progression-free survival (PFS) and overall survival (OS). ROC curves were drawn for evaluating the classification efficiency of the model. At the same time, the prognostic ability of this risk model was subsequently assessed in validation sets.
Construction and Verification of Risk Assessment Model Based on Gene Sets
Using the matrix of the expression values of prognosis-related genes as input, the Cox-PH model based on L1-LASSO estimation was applied to screen the optimal prognostic genes. A gene-based risk assessment model, similar to the pathway-based risk assessment model, was constructed by using the median PI score as the cut-off point. The Kaplan–Meier survival analysis was performed and ROC curves drawn in the same way.
Construction and Verification of Comprehensive Risk Assessment Model Based on Clinical Risk Factors and Optimal Panel of Prognosis-Related Pathways
A comprehensive risk assessment model was constructed by combining optimized prognosis-related pathways and clinical factors. The PI score of each sample was recalculated based on the gene and the pathway model. The median PI score was selected, and the samples were divided into high and low-risk groups. Then, the association between the comprehensive model and the prognosis was exploited using Kaplan–Meier survival analysis and ROC curves in the training and validation sets, respectively.
Immunohistochemistry and Immune Infiltration Analysis of Ovarian Cancer Tissues
Ten ovarian cancer tissues were collected in Xin Hua Hospital Affiliated to Shanghai Jiao Tong University School of Medicine, Shanghai, China. Five samples were poor prognosis, and 5 were well prognosis. This research was approved by the Ethics Committee of Xin Hua Hospital Affiliated to Shanghai Jiao Tong University School of Medicine. All recruited patients provided a signed, informed consent prior to the collection of ovarian cancer tissues.
Hematoxylin-eosin (HE) staining was performed for evaluating immune infiltration by observing the histomorphology and cell morphology. Among optimized prognosis-related genes and pathways, candidate genes were chosen according to the literature reviewed on PubMed (https://www.ncbi.nlm.nih.gov/pubmed/). Candidate genes that reported of functions related to immunity were briefly selected. Immunohistochemistry was performed for the selected candidate genes, as Zhang described.26 The phospho-STAT3 antibody (#9145S, Cell Signaling Technology, USA) was used at a dilution ratio of 1:200, and the IL-31 antibody (sc-515,415, Santa Cruz Biotechnology, USA) was used at a dilution ratio of 1:100.
Results
Screening of Prognosis Genes and Clinical Factors
All 264 of the DEGs screened from GSE32062 (training set) are shown in Figure 1A. The two-way hierarchical clustering graph based on gene expression values of DEGs in well and poor prognosis groups was drawn (Figure 1B). Using univariate and multivariate Cox regression analysis, 172 prognosis-related genes and one clinical prognostic factor (namely clinical stage) were screened from the DEGs and the clinical information of samples in the training set. The clustering analysis of the expression values of the 172 prognosis-related genes were conducted. Samples were clearly divided into two groups, namely Group 1 and 2 (Figure 1C), which included 109 and 151 ovarian tumor samples, respectively. Group 1 contained 95 recurrent samples and 14 non-recurrent samples, and Group 2 contained 98 recurrent samples and 53 non-recurrent samples (χ2 = 15.2484, P = 9.426E–05). Group 1 contained 14 samples of clinic stage III and 95 samples of clinic stage IV, and group 2 contained 42 samples of clinic stage III and 109 samples of clinic stage IV (χ2 = 7.5327, P = 0.006059). The association analysis between the two groups and the prognosis are shown in Figure 1D. According to the results, clustering was significantly associated with the recurrence (Log Rank P = 0.0001928). The samples in Group 2 had a longer PFS than that of the samples in Group 1 (29.29 ± 23.88 vs 23.52 ± 21.34, t-test P = 0.0419). Meanwhile, clustering was significantly associated with the OS (Log Rank P = 0.03222). The samples in Group 2 have a longer OS than that of the samples in Group 1 (44.89 ± 22.68 vs 38.71 ± 28.01, t-test P = 0.0496).
 |
Figure 1 The differentially expressed genes (DEGs), prognosis-related genes, and clinical factors screened from the training set. (A) The volcanic map for DEGs. Red triangles and green triangles indicate genes that were upregulated and downregulated in the well prognosis group, respectively. With the threshold of FDR < 0.05 and |logFC| > 0.263. (B) Two-way hierarchical clustering map of DEGs. Top bar in orange color indicates the well prognosis group and blue color indicates poor prognosis group. (C) Two-way hierarchical clustering map based on 172 prognosis-related genes. The first line below the sample tree indicates cluster 1 (black bars) and 2 (white bars) formed by the category. The second line shows the sample recurrence information, and the orange and blue bars represent the recurrent and non-recurrent samples, respectively. The third line shows the clinic stage information, in which the green and red represent the Clinic Stage III and IV samples, respectively. P values were obtained using Chi-square test. (D) The Kaplan–Meier curves of progression-free survival (PFS, left) and overall survival (OS, right) for clusters and clinic stages. Horizontal axis represents the survival period and the vertical axis represents the frequency. |
The clinical stage has been identified to be significantly correlated to prognosis (P values < 0.05, Table S2) and the Kaplan–Meier survival curves for the clinical stage and prognosis are shown in Figure 1D.
Screening of Prognosis Gene-Related Risk Pathways
Based on 172 prognosis-related gene expression matrices, 92 ovarian cancer-related pathways (61 KEGG pathways and 31 Biocarta pathways) and path-based PDS matrices were created using pathifier package. Lambda equalled to 0.1753 while cvl reached the max value of −1145.3164 (Figure 2A); the path coefficient is shown in Figure 2B. Finally, 9 optimal combinations of pathways (one Biocarta and 8 KEGG pathways, see Table 1) were obtained using Cox-PH model, which involved 19 prognostic genes.
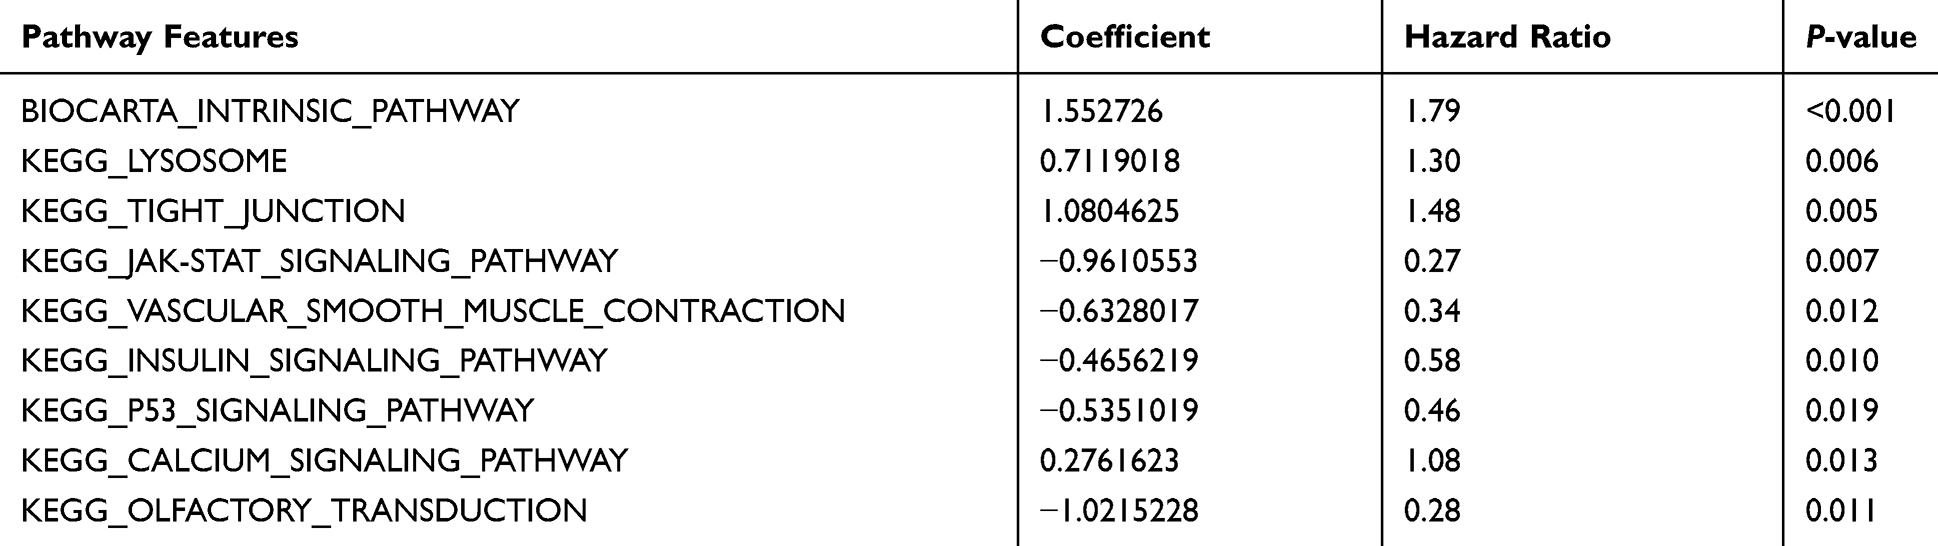 |
Table 1 Optimal Prognostic Pathways Screened Using the Cox-PH Model Based on L1-LASSO Estimation |
 |
Figure 2 Prognosis analysis for the selected 9 pathways. (A–C) Two-way hierarchical clustering map based on 9 prognosis-related pathways. The first line below the sample tree indicates the group I (black bars) and II (white bars) formed by category. The second line shows the sample recurrence information, and the orange and blue bars represent the recurrent and non-recurrent samples, respectively. The green and red in third line represent the Clinic Stage III and IV samples, respectively. P values were obtained using Chi-square test. (D) The Kaplan–Meier curves of progression-free survival (PFS, left) and overall survival (OS, right) for clusters. Horizontal axis represents the survival period and the vertical axis represents the frequency. |
Based on the PDS matrix values of 9 pathways, cluster analysis was performed in the training set of GSE32062 (Figure 2C). As expected, the samples were clearly divided into Group I and Group II, which included 138 and 122 ovarian cancer tumor samples, respectively. There were 117 recurrent samples and 21 non-recurrent samples in Group I, while 76 recurrent samples and 46 non-recurrent samples in Group II (χ2 = 15.963, P = 6.459E–05). Group I contained 95 samples of Clinic Stage III and 43 samples of Clinic Stage IV, while Group II contained 109 samples of Clinic Stage III and 13 samples of Clinic Stage IV (χ2 = 14.9182, P = 0.0001123). Meanwhile, the clustering of pathways was significantly associated with PFS (Log Rank P = 0.0002581, Figure 2D left) and OS (Log Rank P = 0.02053, Figure 2D right). The samples in Group II had a longer PFS and OS than those of the samples in Group I (31.39 ± 26.58 vs 22.88 ± 18.46, t-test P = 0.00339; 46.24 ± 28.93 vs 43.55 ± 20.95, t-test P = 0.0397).
Prognostic Abilities of Pathway-Based Risk Assessment Model
Using the median PI score as the cut-off point, a pathway-based risk assessment model was constructed. The prognostic ability of the model in a training set and validation sets are shown in Table S3. Kaplan–Meier survival analysis was applied to assess the association between risk groups and PFS as well as OS. As a result, patients in the low-risk group had longer PFS and OS in all sets (all P < 0.05) except for OS in GSE8842 (P > 0.05). Meanwhile, the ROC for PFS and OS based on this pathway-based model were conducted (Supplemental Figure S1).
The Prognostic Ability of Gene-Based Risk Assessment Model
The optimal prognosis-related genes screened by the Cox-PH model based on L1-LASSO estimation are shown in Table 2. The prognostic ability of gene-based risk assessment model in training and validation sets are shown in Table S4. According to the results of Kaplan–Meier survival analysis (Supplemental Figure S2), low-risk patients had a longer PFS than that of high-risk patients in the training set (P = 2.13E–11) as well as validation sets of TCGA (P = 0.03871) and GSE49997 (P = 0.0021). Unfortunately, low-risk patients had longer OS than that in high-risk patients in the training set (47.92 ± 24.41 and 41.71 ± 25.29, P = 2.13E–11); there was no significant correlation with OS prognosis in all validation sets (P > 0.05). Additionally, the ROC for PFS and OS based on this gene-based model were conducted (Supplemental Figure S2).
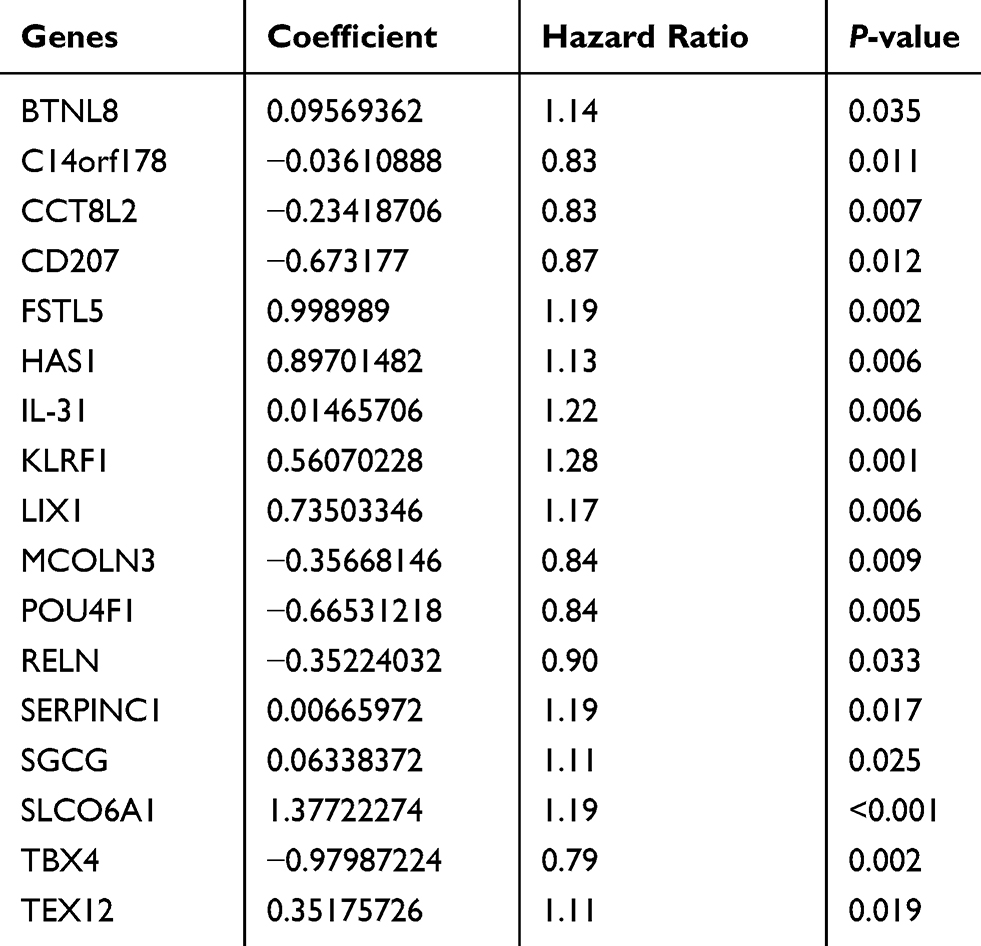 |
Table 2 The Optimal Prognosis-Related Genes Screened by Cox-PH Model Based on L1-LASSO Estimation |
The Prognostic Ability of Comprehensive Assessment Model Based on Clinical Risk Factors and Pathways
The clinical stage was the only optimal prognosis-related clinical factor screened by the Cox-PH model based on L1-LASSO estimation (P = 0.0176). Kaplan–Meier survival analysis ROC were used to assess the association between risk groups and PFS as well as OS for the training and validation sets based on this comprehensive assessment model (Figure 3). As shown in Table S5, low-risk patients had longer PFS and OS than high-risk patients in training and validation sets of TCGA and GSE4997 (all P < 0.05).
 |
Figure 3 Kaplan–Meier survival analysis and receiver operating characteristic (ROC) curves of comprehensive assessment model of clinical risk factor and pathways. (A) Kaplan–Meier curves of progression-free survival (PFS) for GEO and TCGA clusters. (B) Kaplan–Meier curves of overall survival (OS) for GEO and TCGA clusters. Horizontal axis represents the survival period and the vertical axis represents the frequency. (C) ROC curve of PFS and OS for comprehensive assessment model of clinical risk factor and pathways. The abscissa represents sensitivity and the ordinate represents specificity. |
Clinicopathologic Correlation of Immune Infiltration and Expression of Phospho-STAT3 and IL-31 in Ovarian Cancer Tissues
Histological sections from 6 ovarian cancer patients (3 well and 3 poor prognoses) were analyzed with HE staining and immunohistochemistry. Among 9 optimal prognostic pathways and 17 optimal prognostic genes, p-STAT3, BTL8, CD207, IL-31, RELN, LIX1, and POU4F1 were chosen as candidates related to immune infiltration according to the literature review on Pubmed. The candidate genes were chosen because they were related to immunity and have never been reported in correlation to immune infiltration in ovarian cancer.
According to the morphology of HE stained tissue sections and immunohistochemistry results, the position of concentrated immune cells showed brown signals in the cell cytoplasm (Figure 4B), that confirmed the correlation of immune infiltration and expression of p-STAT3 and IL-31. Tissues with poor prognosis are positively (3 strong and 2 moderate) correlated to the expression of p-STAT3, while well prognosis tissues showed negative or weak expression levels. In addition, IL-31 was detected in all samples, and tissues with poor prognosis showed a larger proportion of IL-31 positive regions (Figure 4A).
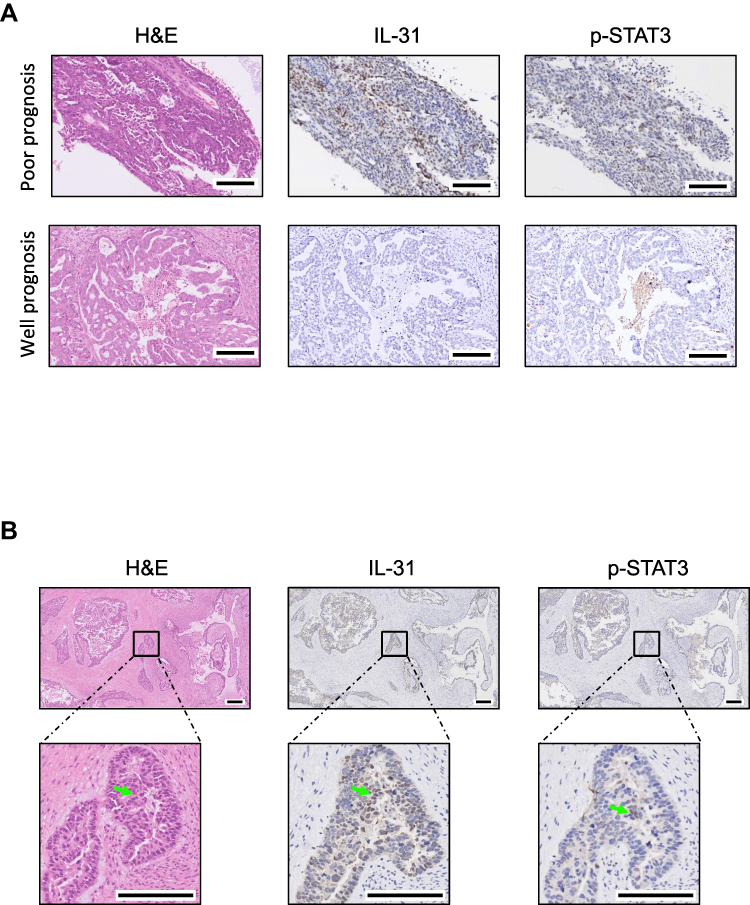 |
Figure 4 Hematoxylin-eosin (HE) staining and immunohistochemistry of phospho-STAT3 (p-STAT3) and IL-31 in ovarian cancer tissues. (A) Immunohistochemistry photos showed upregulated p-STAT3 and downregulated IL-31 in ovarian cancer tumor sections with poor prognosis, and brown positions indicate the expression of detected proteins. (B) Morphology of HE and immunohistochemistry results showed p-STAT3 and IL-31 expressed at the position of concentrated immune cells, which were marked by arrows in photos. Scale bars indicate 100 μm. |
Discussion
There are 3 types of risk assessment models associated with the prognosis of ovarian cancer in this study: a pathway model, a gene model, and a comprehensive model of clinical risk factors and pathways. Through a series of analyses and verification, the pathway model failed in the OS verification of GSE8842, while the gene model failed in the PFS verification of GSE8842 and the OS verification of all validation sets. Undoubtedly, the pathway model is superior to the gene model. The comprehensive model had a good prognostic role for PFS and OS in the training and all validation sets and hence is the most credible. However, one of the study’s limitations is that there are only two validation sets for the comprehensive model. Research that includes more validation sets based on ovarian cancer expression profiles and clinical studies is required for further confirmation.
Nine signaling pathways have been identified and might play pivotal roles in the prognosis of ovarian cancer. The significantly activated pathway, Janus kinase/signal transducer and activator of transcription (JAK-STAT, coefficient = –0.9615305 and P = 0.007, see Table 1) pathway, contributes to the invasion and metastasis of tumors;27 it plays a crucial role in orchestrating the immune system and can modulate the polarization of T helper cells.28 The dephosphorylation tyrosine residues bound to STATs is an important step in downregulating JAK-STAT signaling. Mechanistically, constitutively activated JAK signaling causes inflammation and subsequently phosphorylates additional targets in the STAT family.29 Inhibiting STAT3 could suppress the invasion and metastasis of ovarian cancer cells;30,31 a STAT3 inhibitor drug has been considered as a novel therapeutic approach for head and neck squamous cell carcinoma32 and ovarian carcinoma.33 Based on the mechanism of JAK-STAT signaling, we explored the clinicopathologic correlation of immune infiltration and expression of phosphorylated-STAT3 (p-STAT3). The expression of p-STAT3 was confirmed in immune cell-concentrated microenvironment in ovarian tumors with poor prognosis (Figure 4). In addition, as STAT3 is a latent transcription factor that resides in the cytoplasm until activated,29 it may be a potential target for ovarian cancer treatment.
Interleukin 31 (IL-31) has also been identified to be closely related to the outcome of ovarian cancer (Table 2) and immune infiltration (Figure 4) in this study. IL-31 is mainly produced by activated T-helper 2 cells, which have effects on certain kinds of tumors.34 IL31RA, the receptor of IL-31, is highly expressed in ovarian cancer tumors.35 Signaling through the IL31RA involves immune-pathways like MAPK and JAK-STAT, indicated the possible correlation between IL-31 and the clinical presentation of cancer. Moreover, previous studies also reported that serum level of IL-31 correlated with carcinoma stages, depth of invasion, lymph node, and even distant metastasis.36 Besides, a recent study suggested that IL-31 gene polymorphisms might be associated with the development and progression of epithelial ovarian cancer in the Chinese population.37 However, the roles of IL-31 in the development and progression of human epithelial ovarian cancer are largely unknown. Therefore, future trials focusing on IL-31 gene polymorphisms, IL-31 expression levels, and clinical outcomes are needed, and an animal experiment simulating and observing the immune system is useful for revealing the undiscovered mechanisms and novel pathways.
Other pathways and genes that are found in our models can also be explained. Lysosome, as a membrane-bound organelle,38 has critical functions in regulating cell adhesion dynamics,39 invasion, and metastasis,40 and cell death.41 The lysosome has also been reported as a mediator of drug resistance in cancer,42 and abnormal lysosomal trafficking is thought to induce the enhanced exosomal export of cisplatin, leading to drug resistance in human ovarian cancer cells.43 From this view, the lysosome might provide crucial pathways in clinical outcomes of ovarian cancer patients. The tight junction pathway also refers to cell adhesion44 and it is involved in ovarian cancer progression and targeted therapy.45,46 Cell adhesion is a critical process in the migration and invasion of cancer cells47 and several studies focusing on inhibiting cancer metastasis have been conducted via targeting focal adhesion pathways.48 Hyaluronan synthase (HAS1) and Reelin (RELN) are also two significant DEGs according to our results. Previous reports have consistently revealed that upregulated HAS1 enhances the metastasis of cancer cells.49 The overexpression of HAS1 might be related to poor outcomes in ovarian cancer patients as it is expressed higher in the poor prognosis group.50 RELN was also reported to be associated with metastasis in several types of cancer,51 and the knockdown of RELN or its downstream components significantly increase cell motility.52
In this study, we have confirmed that the pathway-based model was more convincing and had greater applicability than the gene-based model, and we have generated a comprehensive risk assessment model consisting of a clinical risk factor and pathways that showed a possible bright foreground. Besides, p-STAT3 and IL-31 showing correlation to immune infiltration of ovarian cancer tissues may be novel potential therapeutic targets for treating ovarian cancer with poor prognosis. For instance, we can explore the curative effect of combination therapy with conventional medicals with inhibitors or monoclonal antibodies of p-STAT3 and IL-31. The strategy for searching superior and applicable assessment models for the study might be appropriate for the prognosis risk assessment and understanding of ovarian cancer pathogenesis. The selected prognostic models from our study might help to improve the nursing of ovarian cancer patients; however, further validations based on a large number of ovarian cancer expression profiles and clinical trials are required. The analysis of clinical samples and animal experiments are also needed to confirm the efficacy and feasibility of p-STAT3 and IL-31.
Abbreviations
DEG, differentially expressed gene; PDS, Pathway Dysregulation Score; Cox-PH, Cox-Proportional Hazards; L1-LASSO, L1-Least Absolute Shrinkage and Selection Operator; ROC, receiver operating characteristic; TCGA, The Cancer Genome Atlas; GEO, The Gene Expression Omnibus; KEGG, Kyoto Encyclopedia of Genes and Genomes; PCA, principal components analysis; PI, prognosis index; PFS, progression-free survival; HAS1, hyaluronan synthase; RELN, Reelin.
Acknowledgment
This work was supported by the China Postdoctoral Science Foundation (Grant Number 2018M642044); and Youth Program of National Natural Science Foundation of China (Grant Number 81801543).
Disclosure
The authors report no conflicts of interest in this work.
References
1. Siegel R, Ma J, Zou Z, Jemal A. Cancer statistics, 2014. CA Cancer J Clin. 2014;64(1):9–29. doi:10.3322/caac.21208
2. Wang B, Liu SZ, Zheng RS, Zhang F, Chen WQ, Sun XB. Time trends of ovarian cancer incidence in China. Asian Pac J Cancer Prev. 2014;15(1):191–193. doi:10.7314/APJCP.2014.15.1.191
3. Lowe KA, Chia VM, Taylor A, et al. An international assessment of ovarian cancer incidence and mortality. Gynecol Oncol. 2013;130(1):107–114. doi:10.1016/j.ygyno.2013.03.026
4. Raman P, Purwin T, Pestell R, Tozeren A. FXYD5 is a marker for poor prognosis and a potential driver for metastasis in ovarian carcinomas. Cancer Inform. 2015;14:113–119. doi:10.4137/CIN.S30565
5. Dilruba S, Grondana A, Schiedel AC, et al. Non-phosphorylatable PEA-15 sensitises SKOV-3 ovarian cancer cells to cisplatin. Cells. 2020;9(2):E515. doi:10.3390/cells9020515
6. Scaletta G, Plotti F, Luvero D, et al. The role of novel biomarker HE4 in the diagnosis, prognosis and follow-up of ovarian cancer: a systematic review. Expert Rev Anticancer Ther. 2017;17(9):827–839. doi:10.1080/14737140.2017.1360138
7. Chen Z, Guo X, Sun S, Lu C, Wang L. Serum miR-125b levels associated with epithelial ovarian cancer (EOC) development and treatment responses. Bioengineered. 2020;11(1):311–317. doi:10.1080/21655979.2020.1736755
8. Cheng Z, Guo J, Chen L, Luo N, Yang W, Qu X. A long non-coding RNA AB073614 promotes tumorigenesis and predicts poor prognosis in ovarian cancer. Oncotarget. 2015;6(28):25381–25389. doi:10.18632/oncotarget.4541
9. Gov E, Arga KY. Differential co-expression analysis reveals a novel prognostic gene module in ovarian cancer. Sci Rep. 2017;7(1):4996. doi:10.1038/s41598-017-05298-w
10. Calura E, Paracchini L, Fruscio R, et al. A prognostic regulatory pathway in stage I epithelial ovarian cancer: new hints for the poor prognosis assessment. Ann Oncol. 2016;27(8):1511–1519. doi:10.1093/annonc/mdw210
11. Li L, Cai S, Liu S, Feng H, Zhang J. Bioinformatics analysis to screen the key prognostic genes in ovarian cancer. J Ovarian Res. 2017;10(1):27. doi:10.1186/s13048-017-0323-6
12. Tian S, Tian J, Chen X, et al. Identification of subpathway signatures for ovarian cancer prognosis by integrated analyses of high-throughput miRNA and mRNA expression. Cell Physiol Biochem. 2017;44(4):1325–1336. doi:10.1159/000485492
13. Shilpi A, Bi Y, Jung S, Patra SK, Davuluri RV. Identification of genetic and epigenetic variants associated with breast cancer prognosis by integrative bioinformatics analysis. Cancer Inform. 2017;16:1–13. doi:10.4137/CIN.S39783
14. Conforti L. The ion channel network in T lymphocytes, a target for immunotherapy. Clin Immunol. 2012;142(2):105–106. doi:10.1016/j.clim.2011.11.009
15. Syn NL, Teng MW, Mok TS, Soo RA. De-novo and acquired resistance to immune checkpoint targeting. Lancet Oncol. 2017;18(12):e731–e741. doi:10.1016/S1470-2045(17)30607-1
16. Le Saux O, Dubois B, Stern MH, et al. Current advances in immunotherapy in ovarian cancer. Bull Cancer. 2020;107(4):465–473. doi:10.1016/j.bulcan.2019.11.015
17. Yoshihara K, Tsunoda T, Shigemizu D, et al. High-risk ovarian cancer based on 126-gene expression signature is uniquely characterized by downregulation of antigen presentation pathway. Clin Cancer Res. 2012;18(5):1374–1385. doi:10.1158/1078-0432.CCR-11-2725
18. Parrish RS, Spencer HJ. Effect of normalization on significance testing for oligonucleotide microarrays. J Biopharm Stat. 2004;14(3):575–589. doi:10.1081/BIP-200025650
19. Ritchie ME, Phipson B, Wu D, et al. limma powers differential expression analyses for RNA-sequencing and microarray studies. Nucleic Acids Res. 2015;43(7):e47. doi:10.1093/nar/gkv007
20. Bolstad BM, Irizarry RA, Åstrand M, Speed TP. A comparison of normalization methods for high density oligonucleotide array data based on variance and bias. Bioinformatics. 2003;19(2):185–193. doi:10.1093/bioinformatics/19.2.185
21. Wang P, Wang Y, Hang B, Zou X, Mao JH. A novel gene expression-based prognostic scoring system to predict survival in gastric cancer. Oncotarget. 2016;7(34):55343–55351. doi:10.18632/oncotarget.10533
22. Eisen MB, Spellman PT, Brown PO, Botstein D. Cluster analysis and display of genome-wide expression patterns. PNAS. 1998;95(25):14863–14868. doi:10.1073/pnas.95.25.14863
23. Wang L, Cao C, Ma Q, et al. RNA-seq analyses of multiple meristems of soybean: novel and alternative transcripts, evolutionary and functional implications. BMC Plant Biol. 2014;14(1):169. doi:10.1186/1471-2229-14-169
24. Drier Y, Sheffer M, Domany E. Pathway-based personalized analysis of cancer. PNAS. 2013;110(16):6388–6393. doi:10.1073/pnas.1219651110
25. Tibshirani R. The lasso method for variable selection in the Cox model. Stat Med. 1997;16(4):385–395. doi:10.1002/(SICI)1097-0258(19970228)16:4<385::AID-SIM380>3.0.CO;2-3
26. Zhang T, Ji D, Wang P, et al. The atypical protein kinase RIOK3 contributes to glioma cell proliferation/survival, migration/invasion and the AKT/mTOR signaling pathway. Cancer Lett. 2018;415:151–163. doi:10.1016/j.canlet.2017.12.010
27. Cho KH, Jeong KJ, Shin SC, Kang J, Park CG, Lee HY. STAT3 mediates TGF-β1-induced TWIST1 expression and prostate cancer invasion. Cancer Lett. 2013;336(1):167–173. doi:10.1016/j.canlet.2013.04.024
28. Seif F, Khoshmirsafa M, Aazami H, Mohsenzadegan M, Sedighi G, Bahar M. The role of JAK-STAT signaling pathway and its regulators in the fate of T helper cells. Cell Commun Signal. 2017;15(1):23. doi:10.1186/s12964-017-0177-y
29. Rawlings JS, Rosler KM, Harrison DA. The JAK/STAT signaling pathway. J Cell Sci. 2004;117(8):1281–1283. doi:10.1242/jcs.00963
30. Cai L, Zhang G, Tong X, et al. Growth inhibition of human ovarian cancer cells by blocking STAT3 activation with small interfering RNA. Eur J Obstet Gynecol Reprod Biol. 2010;148(1):73–80.
31. Seo JM, Park S, Kim JH. Leukotriene B4 receptor-2 promotes invasiveness and metastasis of ovarian cancer cells through signal transducer and activator of transcription 3 (STAT3)-dependent up-regulation of matrix metalloproteinase 2. J Biol Chem. 2012;287(17):13840–13849. doi:10.1074/jbc.M111.317131
32. Geiger JL, Grandis JR, Bauman JE. The STAT3 pathway as a therapeutic target in head and neck cancer: barriers and innovations. Oral Oncol. 2016;56:84–92.
33. Liang R, Chen X, Chen L, et al. STAT3 signaling in ovarian cancer: a potential therapeutic target. J Cancer. 2020;11(4):837–848. doi:10.7150/jca.35011
34. Maier E, Werner D, Duschl A, Bohle B, Horejs-Hoeck J. Human Th2 but not Th9 cells release IL-31 in a STAT6/NF-κB-dependent way. J Immunol. 2014;193(2):645–654. doi:10.4049/jimmunol.1301836
35. Davidi S, Fremder E, Kan T, et al. The antiangiogenic role of the pro-inflammatory cytokine interleukin-31. Oncotarget. 2017;8(10):16430–16444. doi:10.18632/oncotarget.14857
36. Ferretti E, Corcione A, Pistoia V. The IL-31/IL-31 receptor axis: general features and role in tumor microenvironment. J Leukoc Biol. 2017;102(3):711–717. doi:10.1189/jlb.3MR0117-033R
37. Liu C, Wang Y, Song H, et al. Genetic association of interleukin-31 gene polymorphisms with epithelial ovarian cancer in chinese population. Dis Markers. 2018;2018:3503858. doi:10.1155/2018/3503858
38. Settembre C, Fraldi A, Medina DL, Ballabio A. Signals from the lysosome: a control centre for cellular clearance and energy metabolism. Nat Rev Mol Cell Biol. 2013;14(5):283–296. doi:10.1038/nrm3565
39. Pu J, Schindler C, Jia R, Jarnik M, Backlund P, Bonifacino JS. BORC, a multisubunit complex that regulates lysosome positioning. Dev Cell. 2015;33(2):176–188. doi:10.1016/j.devcel.2015.02.011
40. Bian B, Mongrain S, Cagnol S, et al. Cathepsin B promotes colorectal tumorigenesis, cell invasion, and metastasis. Mol Carcinogen. 2016;55(5):671–687. doi:10.1002/mc.22312
41. Hamalisto S, Jaattela M. Lysosomes in cancer-living on the edge (of the cell). COCEBI. 2016;39:69–76.
42. Zhitomirsky B, Assaraf YG. Lysosomes as mediators of drug resistance in cancer. Drug Resist Updates. 2016;24:23–33. doi:10.1016/j.drup.2015.11.004
43. Safaei R. Abnormal lysosomal trafficking and enhanced exosomal export of cisplatin in drug-resistant human ovarian carcinoma cells. Mol Cancer Ther. 2005;4(10):1595–1604. doi:10.1158/1535-7163.MCT-05-0102
44. Knights AJ, Funnell AP, Crossley M, Pearson RC. Holding tight: cell junctions and cancer spread. Trends Cancer Res. 2012;8:61–69.
45. Battista MJ, Cotarelo C, Jakobi S, et al. Overexpression of epithelial cell adhesion molecule protein is associated with favorable prognosis in an unselected cohort of ovarian cancer patients. J Cancer Res Clin Oncol. 2014;140(7):1097–1102. doi:10.1007/s00432-014-1672-9
46. Chang PY, Liao YP, Wang HC, et al. An epigenetic signature of adhesion molecules predicts poor prognosis of ovarian cancer patients. Oncotarget. 2017;8(32):53432–53449. doi:10.18632/oncotarget.18515
47. Xia J, Cheng Y, Zhang H, Li R, Hu Y, Liu B. The role of adhesions between homologous cancer cells in tumor progression and targeted therapy. Expert Rev Anticancer Ther. 2017;17(6):517–526. doi:10.1080/14737140.2017.1322511
48. Tokuda E, Itoh T, Hasegawa J, et al. Phosphatidylinositol 4-phosphate in the Golgi apparatus regulates cell-cell adhesion and invasive cell migration in human breast cancer. Cancer Res. 2014;74(11):3054–3066. doi:10.1158/0008-5472.CAN-13-2441
49. Du Y, Liu H, He Y, et al. The interaction between LYVE-1 with hyaluronan on the cell surface may play a role in the diversity of adhesion to cancer cells. PLoS One. 2013;8(5):e63463. doi:10.1371/journal.pone.0063463
50. Yabushita H, Noguchi M, Kishida T, et al. Hyaluronan synthase expression in ovarian cancer. Oncol Rep. 2004;12(4):739–743.
51. Yuan Y, Chen H, Ma G, Cao X, Liu Z. Reelin is involved in transforming growth factor-β1-induced cell migration in esophageal carcinoma cells. PLoS One. 2012;7(2):e31802. doi:10.1371/journal.pone.0031802
52. Sato N, Fukushima N, Chang R, Matsubayashi H, Goggins M. Differential and epigenetic gene expression profiling identifies frequent disruption of the RELN pathway in pancreatic cancers. Gastroenterology. 2006;130(2):548–565. doi:10.1053/j.gastro.2005.11.008
 © 2020 The Author(s). This work is published and licensed by Dove Medical Press Limited. The
full terms of this license are available at https://www.dovepress.com/terms
and incorporate the Creative Commons Attribution
- Non Commercial (unported, 3.0) License.
By accessing the work you hereby accept the Terms. Non-commercial uses of the work are permitted
without any further permission from Dove Medical Press Limited, provided the work is properly
attributed. For permission for commercial use of this work, please see paragraphs 4.2 and 5 of our Terms.
© 2020 The Author(s). This work is published and licensed by Dove Medical Press Limited. The
full terms of this license are available at https://www.dovepress.com/terms
and incorporate the Creative Commons Attribution
- Non Commercial (unported, 3.0) License.
By accessing the work you hereby accept the Terms. Non-commercial uses of the work are permitted
without any further permission from Dove Medical Press Limited, provided the work is properly
attributed. For permission for commercial use of this work, please see paragraphs 4.2 and 5 of our Terms.