Back to Journals » OncoTargets and Therapy » Volume 9
A comparison study of pancreatic acinar cell carcinoma with ductal adenocarcinoma using computed tomography in Chinese patients
Authors Wang Q, Wang X, Guo R, Li G
Received 30 October 2015
Accepted for publication 26 April 2016
Published 6 September 2016 Volume 2016:9 Pages 5475—5481
DOI https://doi.org/10.2147/OTT.S99562
Checked for plagiarism Yes
Review by Single anonymous peer review
Peer reviewer comments 3
Editor who approved publication: Dr Jianmin Xu
Qingbing Wang,1,2 Xiaolin Wang,1,2 Rongfang Guo,2,3 Guoping Li1,2
1Department of Interventional Radiology, Zhongshan Hospital, Fudan University, 2Shanghai Institute of Medical Imaging, 3Department of Radiology, Zhongshan Hospital, Fudan University, Shanghai, People’s Republic of China
Abstract: Pancreatic acinar cell carcinoma (ACC) is a rare tumor that is difficult to diagnose preoperatively. The aim of this study was to evaluate and describe the computed tomography (CT) features of ACC and compare the results with pancreatic ductal adenocarcinoma (DAC) for improving preoperative diagnosis. The control group consisted of 34 patients with DAC collected from the pathology electronic database. The CT imaging from nine patients with pathologically confirmed ACC was retrospectively reviewed. Two radiologists independently assessed the tumor location, size, texture, and enhancement patterns. We found that 64.3% (9/14) of ACC tumors were homogeneous and 35.7% (5/14) had necrosis. The percentage of common bile duct and pancreatic ductal dilation was 14.3% (2/14) and 7.1% (1/14), respectively. The mean size of ACC was 50.1±24.2 mm. The mean attenuation of ACC was 35.4±3.9 Hounsfield unit (HU) before enhancement, 73.1±42.9 HU in arterial phase, and 71.8±15.6 HU in port venous phase. It is difficult to distinguish ACC from DAC preoperatively only based on CT findings. However, compared with DAC, we found that ACC tumors are likely to be larger and contain more heterogeneous intratumoral necrotic hypovascular regions, and less pancreatic ductal and common biliary dilation.
Keywords: acinar cell carcinoma, computed tomography, pancreatic ductal carcinoma, pancreas
Introduction
Although >80% of the pancreas is composed of acinar cells and only 4% of the organ is composed of ductal epithelial cells, acinar cell carcinoma (ACC) represents <1% of all pancreatic neoplasms and is much rarer than pancreatic ductal adenocarcinoma (DAC).1–5 DAC is an aggressive malignancy with a very poor prognosis. This tumor is the major histological subtype and comprises 90% of all pancreatic cancers.6,7 ACC is not well defined pathologically due to its rarity. There are only a few reports on the imaging performance, treatment, and outcome of ACC, and most of them are only case reports or small number series.4,5,8–10 Many issues concerning this tumor remain unclear.11 In particular, there is no consensus regarding the preoperative distinction of ACC from other pancreatic neoplasms. ACCs were previously considered to be as aggressive as DACs and pretreatment differentiation between tumor types was not considered important.12,13 However, recently, several studies have reported that the malignant potential and treatment principles for ACC are very different from DAC. In previous reports, 76.5% of the ACCs in patients were considered resectable, and the 5-year survival rate after resection is 43.9%.14,15 Even if ACC is unresectable or recurrent, chemotherapy, such as paclitaxel and 5-fluorouracil, is often still effective.13,16 Thus, a radiological differential diagnosis before beginning treatment is important to achieve better prognosis.
In this study, we retrospectively examined patients with ACC confirmed pathologically in the past 7 years in Zhongshan Hospital. The features of ACC were evaluated and compared with DAC by computed tomography (CT) scans to improve our understanding of ACC diagnosis and treatment.
Materials and methods
Patients
This study was approved by the Institutional Ethics Committee of Zhongshan Hospital, and informed consent was not required because the review of the patient data was all anonymous.
CT technique
All patients received plain and enhanced CT scans preoperatively using American GE Light Speed (Fairfield, CT, USA) or German Siemens SOMATOM Definition (Munich, Germany). The main parameters included the following: 1.5–2.5 mm detector collimation, 12.5–27 mm table speed per gantry rotation, 3–5 mm section thickness, and 3–5 mm reconstruction interval. A routine abdominal dynamic CT consisting of unenhanced, arterial, and portal venous phase imaging was performed. The arterial and port venous phases were obtained 20–40 and 60–80 seconds after starting intravenous injection of the contrast material. The patients were administered 1.5 mL/kg iohexol (Omnipaque 370; Amersham, Shanghai, People’s Republic of China) with a mechanical injector at a rate of 3 mL/s.
Image interpretation
All the images acquired by CT were reviewed by two radiologists with 6 and 11 years diagnostic imaging experience, respectively. The radiologists were blinded to the clinical findings and pathological results. The images were reviewed using a picture archiving and communication system (EBM Medical Information system, Shanghai, People’s Republic of China). The CT images from each patient were reviewed to analyze the imaging criteria. The tumor location was classified as head–neck and body–tail. The dividing line was the superior mesenteric artery. The diameter was defined by the mean of the long- and short-axis diameter at the level of maximum tumor diameter. The tumor texture was classified as homogeneous or heterogeneous (with intratumoral necrosis). The pancreatic duct and common bile duct dilation were defined as >3 and 10 mm, respectively. The CT attenuation value in Hounsfield units (HUs) was obtained using a region of interest (ROI) analysis. The ROI cursors were carefully placed to encompass as much of the tumor as possible and avoid necrotic areas and adjacent structures. The ROI value was calculated as the CT attenuation value of the tumor. Three ROIs 1 cm in diameter were also identified in the normal parenchyma adjacent to the tumor. The mean of the three ROI values was calculated as the CT attenuation value of the normal pancreas. When defining ROI, we excluded all cystic areas, calcification, the pancreatic duct, and the surrounding vessels.
Pathological examination
A pathological examination of all tumors was performed on specimens obtained during surgery. All tumors were surgically resected after CT scan. Hematoxylin and eosin–stained sections and immunohistochemical analysis of the tumor specimens were reviewed by two pathologists to ensure the diagnosis.
Statistical analysis
In this study, the ratios of CT attenuation values were used to indicate the distinction between tumor and pancreas parenchyma. We denoted the CT values of tumor and pancreas in unenhanced, arterial, and port venous phases as T0, Ta, Tp, and P0, Pa, Pp, respectively. The ratios of T0/P0, Ta/Pa, Tp/Pp, (Ta − T0)/(Pa − P0), and (Tp − T0)/(Pp − P0) were calculated and their log transformations between ACCs and DACs were examined by independent-sample t-tests. The differences in the tumor CT attenuation values obtained by the unenhanced and contrast-enhanced CT imaging were compared by the paired-samples t-test. The differences in size and CT attenuation between ACCs and DACs were also compared using the independent-samples t-test. The comparison of qualitative data was determined using the chi-square test. A two-side P-value <0.05 was considered a statistically significant difference. All data collection and statistical analysis were performed using the SPSS software (version 15.0, SPSS Inc., Chicago, IL, USA).
Results
Patient selection
The pathology database of our hospital was searched from January 2008 to December 2015 by using the terms “pancreatic cancer” or “pancreatic tumor” (Figure 1). There were 624 records reviewed after the database search and 283 cases were excluded. A total of 98 patients were excluded because the CT scanning results before surgical pancreatectomy were not recorded in our hospital. Given that an increased number of controls could not improve the validity of test when the ratio of the case to control was beyond 1:4,17 a sampling process that randomly selected one in four cases was used to generate a subset of DAC patients as the control group for ACC patients. In this study, we collected 14 cases with ACC and 34 cases with DAC for the comparison analysis (Figure 1).
 | Figure 1 Study flowchart. |
ACCs characteristics
The clinical data for the 14 ACC cases are listed in Table 1. The age of the patients ranged from 28 to 78 years (mean 58.1±13.7 years). The female (n=2, 14.3%) to male (n=12, 85.7%) ratio was 1:6. The majority of patients (n=11, 78.6%) had symptoms of abdominal pain and underwent a CT scan in the out-patient department. There were two tumors (14.3%) in the pancreas found during a routine physical examination. One tumor was found by the CT scan of a patient with jaundice.
 | Table 1 Data of patients with ACC |
All the ACC tumors were located in the pancreas and the tumor sizes ranged from 16 to 78 mm (mean 50.1±24.2 mm). Six of 14 tumors (42.9%) were located in the pancreas head–neck and eight (57.1%) were located in the body–tail (Figure 2). The tumor texture was homogeneous in nine of 14 cases (64.3%) and there were five (35.7%) cases with intratumoral necrosis (Figure 3). CT imaging also demonstrated a variety of features, including a large tumor involving artery and spleen (Figure 4). There was common bile duct dilation in two (2/14, 14.3%) patients and one patient (1/14, 7.1%) with pancreatic ductal obstructions.
 | Figure 2 Acinar cell carcinoma from the body of the pancreas in a 52-year-old male (A–C), and from the tail in a 49-year-old male (D, E). |
 | Figure 3 Acinar cell carcinoma in a 78-year-old male. |
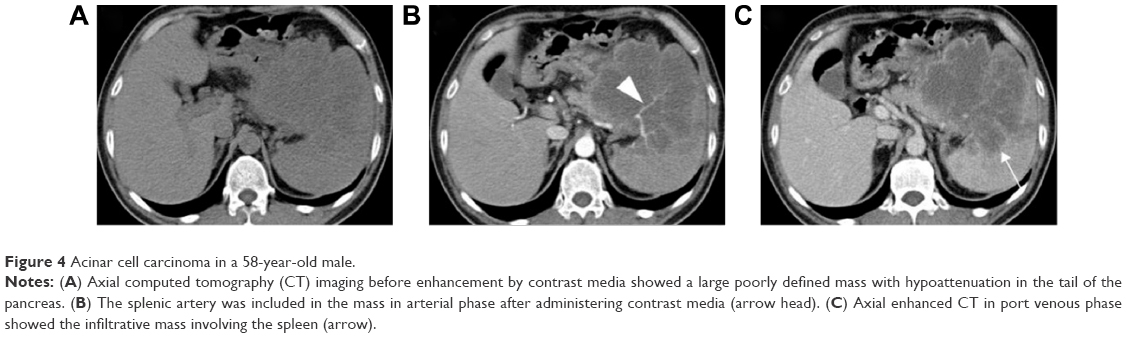 | Figure 4 Acinar cell carcinoma in a 58-year-old male. |
The mean attenuation of ACC was 35.4±3.9 HU before enhancement, 73.1±42.9 HU in arterial phase, and 71.8±15.6 HU in port venous phase (Figure 5). A significant difference was detected in attenuation of tumors before and after administration of contrast media (P<0.05). However, the paired-sample t-test demonstrated there were no significant differences of CT attenuation for ACC and normal pancreatic parenchyma in unenhanced, arterial, and port venous phases (P>0.05).
 | Figure 5 Mean attenuation of acinar cell carcinoma (ACC) patients. |
Comparison with DAC
We compared the ACC and DAC patient characteristics by statistical analyses. The patient age and sex were not different between groups (Table 2). The chi-square test demonstrated there was no difference in the tumor location. However, the size of ACC tumors was significantly larger than DAC tumors (50.1±24.2 vs 21.7±6.2 mm). The occurrence rate of necrosis in ACC patients was significantly higher than that in DAC cases (5/14 vs 2/34). Fisher’s exact probability test indicated that biliary dilation (ACC vs DAC =2/14 vs 16/34) and pancreatic ductal dilation (ACC vs DAC =1/14 vs 29/34) in ACC was significantly less than DAC (P<0.05). An independent-samples t-test showed there were no differences of CT attenuation values for the two groups with respect to measured values, variation, and logarithmic transformation of ratios (Table 2).
 | Table 2 Characteristic comparison between ACC and DAC patients |
Discussion
The pathogenesis of ACC is largely unknown due to the infrequent diagnosis. However, it is accepted that the molecular mechanisms involved are different from those of the more frequent DACs and neuroendocrine tumors.1,18 ACCs present as a distinct microsatellite stable and chromosomal unstable genotype with mutations in DCC and c-Myc with loss of APC gene function. Clinically, the postoperative survival and resection rates of ACC were reported to be superior to DAC in a multi-institutional study (median survival, 61 vs 24 months).12 There is no consensus on the treatment of ACCs. However, surgery greatly improves the prognosis.19 In addition, several reports have described a good prognosis after intervention with therapeutic regimens, such as FOLFIRINOX and S1, which differ from the treatments used in DAC patients.8,9 The malignant potential of ACC is significantly different from DAC. With proper regional, systemic, and targeted therapy, advanced ACC patients can survive >7 years after diagnosis.10 Thus, correct pretreatment distinction between these ACCs and DACs is very important.20 If we can clearly distinguish ACCs and DACs, perhaps we can select a more suitable pretreatment for both types of patients.
ACCs originate from the pancreatic acinar cells rather than the ductal epithelium.21 Clinically, ACC patients commonly show symptoms related to a local mass or metastases, which rarely cause dilatation of the pancreatic duct. Therefore, patients with ACC typically present with abdominal pain as opposed to painless obstructive jaundice. The presentation with jaundice is more typical of DAC of the pancreatic head. Consistent with these findings, most patients in our series had abdominal pain without jaundice (Table 1). Other patient subgroups with ACC presented with an interesting unique syndrome called “lipase hypersecretion syndrome,”2 which is characterized by skin rashes, polyarthralgias, fevers, and fat necrosis because of lipase secretion by the tumor into the blood. Though we did not find an age difference in the current study, a previous large population study showed that ACC patients tend to occur at a younger age than DAC (56 vs 70 years, P<0.001).22 But, we do not think younger patients will get a longer overall survival between the two kinds of different tumors because the survival is determined by many factors, such as malignant degree, complications, and comorbidities. Schmidt et al11 reported that patients were more likely to have ACC than DAC if they were male, white, had larger tumors, or a lesion in the tail of the pancreas. In our study, both sex and tumor location in patients with ACC were not statistically different from patients with DAC (Table 2). This result may be due to the small case number bias and the ratio of sex which is as high as 1:6 (female:male). Our findings showed the size of ACC tumors was larger than DAC tumors. This result is consistent with a previous study.23
Recent reports using CT have shown that ACCs are typically solitary and are homogenously enhanced when the lesion is small. The tumor may show hypodensity due to necrosis if the lesion is large.23–25 One possible explanation for the necrotic portion is the digestive effect of the pancreatic enzymes released by neoplastic cells. A previous report described ACCs as a hyperdense tumor in the arterial phase after administration of contrast media.4 Other studies reported ACC tended to be enhanced less than the adjacent normal pancreatic parenchyma.2,3 In our study, most cases (11/14) were hypodense in unenhanced, arterial, and port venous phases (Figure 2). However, the CT attenuation values were not statistically different between tumors and normal pancreatic parenchyma in unenhanced, arterial, and port venous phases. So, from our study and reported cases, it seems that not every ACC shows a unique attenuation pattern.
We examined the pattern of CT attenuation values before and after administering contrast media to compare the ACC results with DAC, which is the most frequently suspected disease in the preoperative diagnosis. Sumiyoshi et al20 reported that the time attenuation curve of ACC had a peak enhancement during arterial or port venous phase but not in delayed phase in a dynamic CT scanning. The results were different in DAC patients. However, we found the measured values and variations could not distinguish the two diseases. We also attempted to use novel indicators calculated with the CT attenuation values. These indicators included the ratio of attenuation value of tumors relative to normal pancreas for assessing if there were variation changes between abnormal and normal pancreas in CT imaging. Unfortunately, these indicators were not significantly different between ACC and DAC.
Limitations
There are limitations present in our study. First, the case number is small due to the rarity of ACCs. Second, the study only enrolled patients who were pathologically identified after surgical pancreatectomy. Thus, the patterns do not represent late-stage patients with ACC or patients with metastatic tumors. Third, as a retrospective study, the CT imaging parameters were not consistent and delayed CT imaging was absent.
Conclusion
The patterns of CT attenuation were similar for ACC in multiple phases with enhanced CT scanning. In addition, recently documented intraductal and papillary variants of ACCs are even more challenging for the differential diagnosis with DAC.26 Thus, CT imaging alone is not sufficient to differentiate ACC from DAC preoperatively. However, from our study, we found that ACC is more likely to be larger and contains more heterogeneous, intratumoral necrotic, and hypovascular regions on CT imaging. In addition, the presence of pancreatic ductal dilation and biliary dilation may be helpful to distinguish ACCs from DACs but it is not certain. Future studies about this aspect are needed. Novel CT imaging modalities in combination with magnetic resonance imaging,21 18-fluorodeoxyglucose positron emission tomography,27 and serum biomarkers, such as elevated serum alpha fetoprotein,4 should be explored to improve the differential diagnosis for ACC and DAC.
Acknowledgment
This study was supported by the Important Innovative Program of Shanghai Municipal Commission of Health and Family Planning (201440017).
Disclosure
The authors report no conflicts of interest in this work.
References
Bergmann F, Aulmann S, Sipos B, et al. Acinar cell carcinomas of the pancreas: a molecular analysis in a series of 57 cases. Virchows Arch. 2014;465(6):661–672. | ||
Raman SP, Hruban RH, Cameron JL, Wolfgang CL, Kawamoto S, Fishman EK. Acinar cell carcinoma of the pancreas: computed tomography features – a study of 15 patients. Abdom Imaging. 2013;38(1):137–143. | ||
Hu S, Hu S, Wang M, Wu Z, Miao F. Clinical and CT imaging features of pancreatic acinar cell carcinoma. Radiol Med. 2013;118(5):723–731. | ||
Liu K, Peng W, Zhou Z. The CT findings of pancreatic acinar cell carcinoma in five cases. Clin Imaging. 2013;37(2):302–307. | ||
Sumiyoshi T, Shima Y, Okabayashi T, et al. Long-term survival following pancreatectomy and s-1 chemotherapy for pancreatic acinar cell carcinoma with peritoneal dissemination: a case report and literature review. Medicine (Baltimore). 2015;94(1):e378. | ||
Bukki J. Pancreatic adenocarcinoma. N Engl J Med. 2014;371(22):2139–2140. | ||
Siegel R, Ma J, Zou Z, Jemal A. Cancer statistics, 2014. CA Cancer J Clin. 2014;64(1):9–29. | ||
Schempf U, Sipos B, Konig C, Malek NP, Bitzer M, Plentz RR. FOLFIRINOX as first-line treatment for unresectable acinar cell carcinoma of the pancreas: a case report. Z Gastroenterol. 2014;52(2):200–203. | ||
Yamamoto T, Ohzato H, Fukunaga M, Imamura H, Furukawa H. Acinar cell carcinoma of the pancreas: a possible role of S-1 as chemotherapy for acinar cell carcinoma. A case report. JOP. 2012;13(1):87–90. | ||
Ang C, Herran LA, Lagunes DR, Klimstra DS, Kemeny NE. A case report of a patient with advanced acinar cell carcinoma of the pancreas: long-term survival with regional, systemic and targeted therapy. Tumori. 2013;99(2):e61–e64. | ||
Schmidt CM, Matos JM, Bentrem DJ, Talamonti MS, Lillemoe KD, Bilimoria KY. Acinar cell carcinoma of the pancreas in the United States: prognostic factors and comparison to ductal adenocarcinoma. J Gastrointest Surg. 2008;12(12):2078–2086. | ||
Colombo P, Arizzi C, Roncalli M. Acinar cell cystadenocarcinoma of the pancreas: report of rare case and review of the literature. Hum Pathol. 2004;35(12):1568–1571. | ||
Riechelmann RP, Hoff PM, Moron RA, da Camera Lopes LH, Buzaid AC. Acinar cell carcinoma of the pancreas. Int J Gastrointest Cancer. 2003;34(2–3):67–72. | ||
Lowery MA, Klimstra DS, Shia J, et al. Acinar cell carcinoma of the pancreas: new genetic and treatment insights into a rare malignancy. Oncologist. 2011;16(12):1714–1720. | ||
Kitagami H, Kondo S, Hirano S, Kawakami H, Egawa S, Tanaka M. Acinar cell carcinoma of the pancreas: clinical analysis of 115 patients from Pancreatic Cancer Registry of Japan Pancreas Society. Pancreas. 2007;35(1):42–46. | ||
Distler M, Ruckert F, Dittert DD, et al. Curative resection of a primarily unresectable acinar cell carcinoma of the pancreas after chemotherapy. World J Surg Oncol. 2009;7:22. | ||
Rigby AS, Robinson MB. Statistical methods in epidemiology. IV. Confounding and the matched pairs odds ratio. Disabil Rehabil. 2000;22(6):259–265. | ||
Furlan D, Sahnane N, Bernasconi B, et al. APC alterations are frequently involved in the pathogenesis of acinar cell carcinoma of the pancreas, mainly through gene loss and promoter hypermethylation. Virchows Arch. 2014;464(5):553–564. | ||
La Rosa S, Adsay V, Albarello L, et al. Clinicopathologic study of 62 acinar cell carcinomas of the pancreas: insights into the morphology and immunophenotype and search for prognostic markers. Am J Surg Pathol. 2012;36(12):1782–1795. | ||
Sumiyoshi T, Shima Y, Okabayashi T, Kozuki A, Nakamura T. Comparison of pancreatic acinar cell carcinoma and adenocarcinoma using multidetector-row computed tomography. World J Gastroenterol. 2013;19(34):5713–5719. | ||
Hsu MY, Pan KT, Chu SY, Hung CF, Wu RC, Tseng JH. CT and MRI features of acinar cell carcinoma of the pancreas with pathological correlations. Clin Radiol. 2010;65(3):223–229. | ||
Wisnoski NC, Townsend CM Jr, Nealon WH, Freeman JL, Riall TS. 672 patients with acinar cell carcinoma of the pancreas: a population-based comparison to pancreatic adenocarcinoma. Surgery. 2008;144(2):141–148. | ||
Hammond NA, Miller FH, Day K, Nikolaidis P. Imaging features of the less common pancreatic masses. Abdom Imaging. 2013;38(3):561–572. | ||
Chavalitdhamrong D, Draganov PV. Computed tomography features of acinar cell carcinoma of the pancreas. Abdom Imaging. 2013;38(4):877–878. | ||
Bhosale P, Balachandran A, Wang H, et al. CT imaging features of acinar cell carcinoma and its hepatic metastases. Abdom Imaging. 2013;38(6):1383–1390. | ||
Basturk O, Zamboni G, Klimstra DS, et al. Intraductal and papillary variants of acinar cell carcinomas: a new addition to the challenging differential diagnosis of intraductal neoplasms. Am J Surg Pathol. 2007;31(3):363–370. | ||
Sperti C, Bissoli S, Pasquali C, et al. 18-fluorodeoxyglucose positron emission tomography enhances computed tomography diagnosis of malignant intraductal papillary mucinous neoplasms of the pancreas. Ann Surg. 2007;246(6):932–937; discussion 937–939. |
 © 2016 The Author(s). This work is published and licensed by Dove Medical Press Limited. The
full terms of this license are available at https://www.dovepress.com/terms
and incorporate the Creative Commons Attribution
- Non Commercial (unported, 3.0) License.
By accessing the work you hereby accept the Terms. Non-commercial uses of the work are permitted
without any further permission from Dove Medical Press Limited, provided the work is properly
attributed. For permission for commercial use of this work, please see paragraphs 4.2 and 5 of our Terms.
© 2016 The Author(s). This work is published and licensed by Dove Medical Press Limited. The
full terms of this license are available at https://www.dovepress.com/terms
and incorporate the Creative Commons Attribution
- Non Commercial (unported, 3.0) License.
By accessing the work you hereby accept the Terms. Non-commercial uses of the work are permitted
without any further permission from Dove Medical Press Limited, provided the work is properly
attributed. For permission for commercial use of this work, please see paragraphs 4.2 and 5 of our Terms.