")
Back to Journals » Vascular Health and Risk Management » Volume 20
A Combined Measure of the Triglyceride Glucose Index and Trimethylamine N-Oxide in Risk Stratification of ST-Segment Elevation Myocardial Infarction Patients with High-Risk Plaque Features Defined by Optical Coherence Tomography: A Substudy of the OCTAMI Registry Study
Authors Zhao X, Zhao H, Chen R , Li J, Zhou J, Li N, Yan S, Liu C, Zhou P, Chen Y, Song L, Yan H
Received 16 November 2023
Accepted for publication 10 March 2024
Published 29 March 2024 Volume 2024:20 Pages 141—155
DOI https://doi.org/10.2147/VHRM.S443742
Checked for plagiarism Yes
Review by Single anonymous peer review
Peer reviewer comments 2
Editor who approved publication: Dr Harry Struijker-Boudier
Xiaoxiao Zhao,1 Hanjun Zhao,1 Runzhen Chen,1 Jiannan Li,1 Jinying Zhou,1 Nan Li,1 Shaodi Yan,2 Chen Liu,1 Peng Zhou,1 Yi Chen,1 Li Song,1 Hongbing Yan2
1Department of Cardiology, Fuwai Hospital, National Center for Cardiovascular Diseases, Peking Union Medical College & Chinese Academy of Medical Sciences, BeiJing, People’s Republic of China; 2Department of Cardiology, Fuwai Hospital Chinese Academy of Medical Sciences, ShenZhen, People’s Republic of China
Correspondence: Hanjun Zhao, Department of Cardiology, Fuwai Hospital, Chinese Academy of Medical Sciences, No. 167, Beijing, 100037, People’s Republic of China, Tel +86-15210020808, Email [email protected] Hongbing Yan, Fuwai Hospital, Chinese Academy of Medical Sciences, 12 Langshan Road, Shenzhen, 518000, People’s Republic of China, Tel +86-1301339287, Email [email protected]
Background and Aim: An elevated triglyceride-glucose (TyG) level is associated with increased risk of mortality in patients with CAD. Trimethylamine N-oxide (TMAO) has mechanistic links to atherosclerotic coronary artery disease (CAD) pathogenesis and is correlated with adverse outcomes. However, the incremental prognostic value of TMAO and TyG in the cohort of optical coherence tomography (OCT)-defined high-risk ST-segment elevation myocardial infarction (STEMI) patients is unknown.
Methods: We studied 274 consecutive aged ≥ 18 years patients with evidence of STEMI and detected on pre-intervention OCT imaging of culprit lesions between March 2017 and March 2019.
Outcomes: There were 22 (22.68%), 27 (27.84%), 26 (26.80%), and 22 (22.68%) patients in groups A-D, respectively. The baseline characteristics according to the level of TMAO and TyG showed that patients with higher level in both indicators were more likely to have higher triglycerides (p < 0.001), fasting glucose (p < 0.001) and higher incidence of diabetes (p = 0.008). The group with TMAO > median and TyG ≤ median was associated with higher rates of MACEs significantly (p = 0.009) in fully adjusted analyses. During a median follow-up of 2.027 years, 20 (20.6%) patients experienced MACEs. To evaluate the diagnostic value of the TyG index combined with TMAO, the area under the receiver operating characteristic curve for predicting MACEs after full adjustment was 0.815 (95% confidence interval, 0.723– 0.887; sensitivity, 85.00%; specificity, 72.73%; cut-off level, 0.577). Among the group of patients with TMAO > median and TyG ≤ median, there was a significantly higher incidence of MACEs (p= 0.033). A similar tendency was found in the cohort with hyperlipidemia (p= 0.016) and diabetes mellitus (p= 0.036).
Conclusion: This study demonstrated the usefulness of combined measures of the TyG index and TMAO in enhancing risk stratification in STEMI patients with OCT-defined high-risk plaque characteristics.
Trial Registration: This study was registered at ClinicalTrials.gov as NCT03593928.
Keywords: optical coherence tomography, triglyceride glucose index, trimethylamine N-oxide, high risk plaque feature, major adverse cardiovascular events, prospective study
Introduction
Acute coronary syndrome (ACS) has been extensively proven to cause a heavy socio-economic burden, and it remains a high risk for major adverse cardiovascular events (MACEs) according to the current guidelines.1–3 The triglyceride-glucose (TyG) index, derived from fasting blood glucose and fasting triglycerides (TGs), has been proposed as a surrogate biomarker for insulin resistance (IR).4–6 Moreover, former clinical researches show a high correlation of the TyG index with the prevalence and prognosis of cardiovascular diseases, regardless of whether a patient has comorbidity of diabetes mellitus (DM).7–10 Furthermore, trimethylamine N-oxide (TMAO), a gut microbiota-related metabolite, has been reported in epidemiological studies as a novel marker that correlates with MACEs risks.11–13 Optical coherence tomography (OCT), a high-resolution intravascular imaging modality, enables detailed visualization of superficial plaque components and assessment of coronary plaque characteristics.14,15 Additionally, OCT is capable of identifying high-risk plaques.16–18 However, the incremental prognostic value and the clinical significance of TMAO and TyG in the cohort of optical coherence tomography (OCT)-defined high-risk ST-segment elevation myocardial infarction (STEMI) patients are unknown. Thus, we aim to determine the prognostic values of both the TyG index and TMAO level in high-risk patients enrolled in the OCTAMI (Optical Coherence Tomography Examination in Acute Myocardial Infarction) registry study.
Methods
Study Population
In the present study, a post hoc analysis of the OCTAMI (Optical Coherence Tomography Examination in Acute Myocardial Infarction) registry, in which prospectively and consecutively recruited 434 patients screened by OCT if they were hospitalized for STEMI underwent primary PCI between March 2017 and March 2019 at one of the top-ranked and largest PCI center in China.
For the purpose of this sub-study, we analyzed prognostic value of both TyG and TMAO among patients with OCT defined high-risk features. The present study is addressing the 2-year follow-up results. Furthermore, we excluded the poor imaging quality (N = 87), in-stent restenosis (N = 34), coronary spasm (N = 11), coronary embolism (N = 2), calcified nodule (N = 17), without follow-up data (N = 1) and absence of value of TMAO (N = 59). The inclusion criteria was patients meet at least three of the OCT criteria [including minimum lumen area (MLA) <3.5mm2, fibrous cap thickness (FCT) <75mm, lipid arc circumferential extension >180, and macrophage infiltration]. Finally, there are 97 patients was included the study.
The study protocol was conducted in accordance with the principles outlined in the Declaration of Helsinki and approved by the institutional review board committee and all patients have written informed consent (Fuwai Hospital OCTAMI Registry, clinical trials.gov: NCT03593928).
Definition
The definition of STEMI was followed by the established criteria.19–22 Patients smoking status that do not meet standards of never smokers (never cigarettes in their life-time) or former light smokers (stopped smoking at least 15 years ago, with a total of ≤10 pack-years of smoking) are considered as current smoking.23 CKD was defined as the abnormality of kidney structure or function for more than 3 months, and ESRD was the final common pathway for CKD.20 Body mass index was calculated by dividing weight (kg) by the square of height (m2). Prior PCIs were identified by patients once they conducted the PCI (including percutaneous transluminal coronary angioplasty and stent implantation). According to the TyG index levels, patient data were divided into 3 tertiles: tertile 1: TyG ≤ 8.79; tertile 2: 8.79 ≤ 9.35; tertile 3: TyG>9.35. Furthermore, TMAO level was divided into 3 tertiles: TMAO ≤ 150 mg/L; tertile 2: 150 mg/L < TMAO ≤ 277 mg/L; tertile 3: TMAO > 277 mg/L.
Quantitative OCT Image Analysis and Calculating of TyG
OCT image analysis was performed by using an offline review work station of OCT (Ilumien Optis, St Jude Medical) in the core laboratory by three independent observers investigators (RZ.C., ZX.S, and JN.L.) who were double-blinded to angiographic data, laboratory examinations, clinical presentations, and endpoint events of enrolled patients. They are in charge of screening suitability for culprit-plaque evaluation, analyzing the characteristics of plaque, clearing plaque morphology and measuring the index of microstructural including minimal lumen area, maximal lipid arc, minimal fibrous cap thickness, and the thickness of thin-cap fibroatheroma. When it comes to disagreements and inconsistency among the investigators, we resolved situation by the consensus. A culprit plaque was defined as segments centered on the culprit lesion and bilaterally extending to more than 5 mm of the normal vessel segment.14,24 Based on established criteria,14 calcifications25 (Figure 1A), lipid plaque (Figure 1B), macrophage infiltration (Figure 1C),26 rupture plaque (Figure 1D), erosion plaque (Figure 1E), Microvessels23 (Figure 1F), White thrombi8 (Figure 1G), Cholesterol crystal (Figure 1H) 25 are shown. The TyG index was assessed by the formula of ln [fasting TG (mg/dL)×FPG (mg/dL)/2].4,27
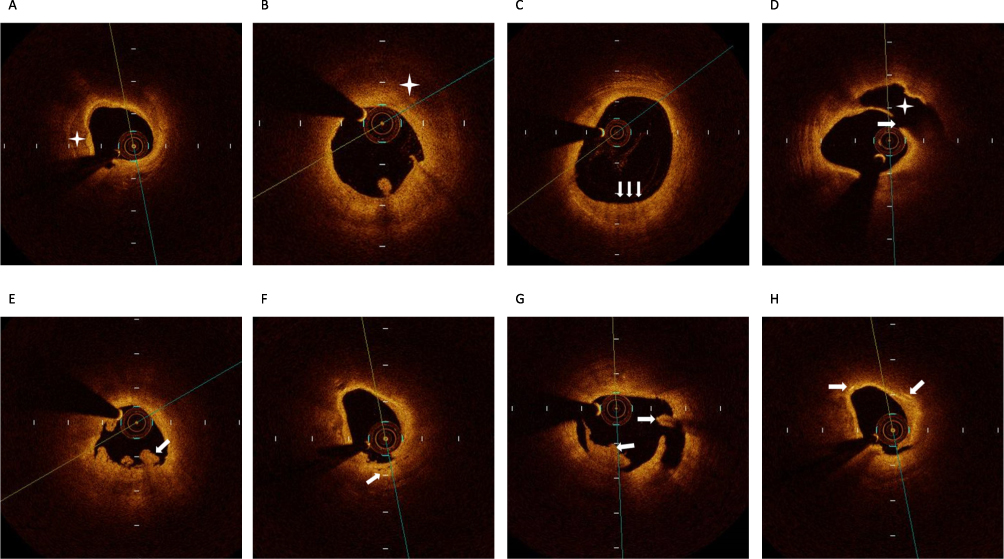 |
Figure 1 Representative cross-sectional optical coherence tomography images. (A) Calcification identified by the presence of a well-delineated, low-backscattering heterogeneous region (asterisk). (B) Lipid plaque (asterisk) most often appears as diffusely bordered, signal-poor regions with overlying signal-rich bands. (C) Macrophage infiltration (arrow) defined as a signal-rich, distinct or confluent punctate region of higher intensity than background speckle noise that generates remarkable backward shadowing (D) Plaque rupture identified by disruption of the fibrous cap and cavity formation (asterisk). The area where the plaque ruptures was marked by arrow. (E) Plaque erosion identified by the presence of attached thrombus (arrow) overlying an intact plaque. (F) Microvessels defined as tubule luminal structures that do not generate a signal, with no connection to the vessel lumen (arrow). (G) Red thrombus consists mainly of red blood cells; relevant OCT images are characterized as high-backscattering protrusions with signal free shadowing (arrow). White thrombi mainly consisted of white blood cells (WBCs) and platelets and were characterized as signal-rich, low-backscattering, billowing projections protruding into the lumen (arrow). (H) Cholesterol crystal (arrow) identified by linear, highly backscattering structures without remarkable backward shadowing. |
Endpoints and Follow-Up
Figure 2 summarizes the inclusion/exclusion study criteria. MACEs were defined as a composite of all-cause mortality, recurrence MI and ischemic cerebrovascular events and revascularization. Recurrence MI was diagnosed as positive cardiac troponins and the changes of typical electrocardiogram serial. A clinical follow-up was performed via direct interviews, telephone calls and hospital discharge records or clinical notes in the event (including all-cause death, MI recurrence, ischemic stroke and revascularization) well-trained physicians and nurses performed the clinical follow-up in the enrolled patients of OCTAMI registry (median time to follow-up: 740.44 days/2.03 years). The protocol of the follow-up was approved by obtaining permission from the Institutional Review Board of Fuwai Hospital and has been registered online (https://www.clinicaltrials.gov/ct2/show/NCT03593928 and term=NCT03593928&draw=2andrank=1). Well-trained physicians in charge of the follow-up primary endpoints, including MI recurrence, angina pectoris, all-cause death, cardiac death, revascularization, heart failure, ischemic stroke, hemorrhagic apoplexy and bleeding events identified and extracted the primary endpoints from laboratory reports, hospital records, medical records, emergency records, and clinical notes which required to be sent to our centers. More than two professional physicians who were blinded to clinical and angiographic data confirmed the clinical endpoints.
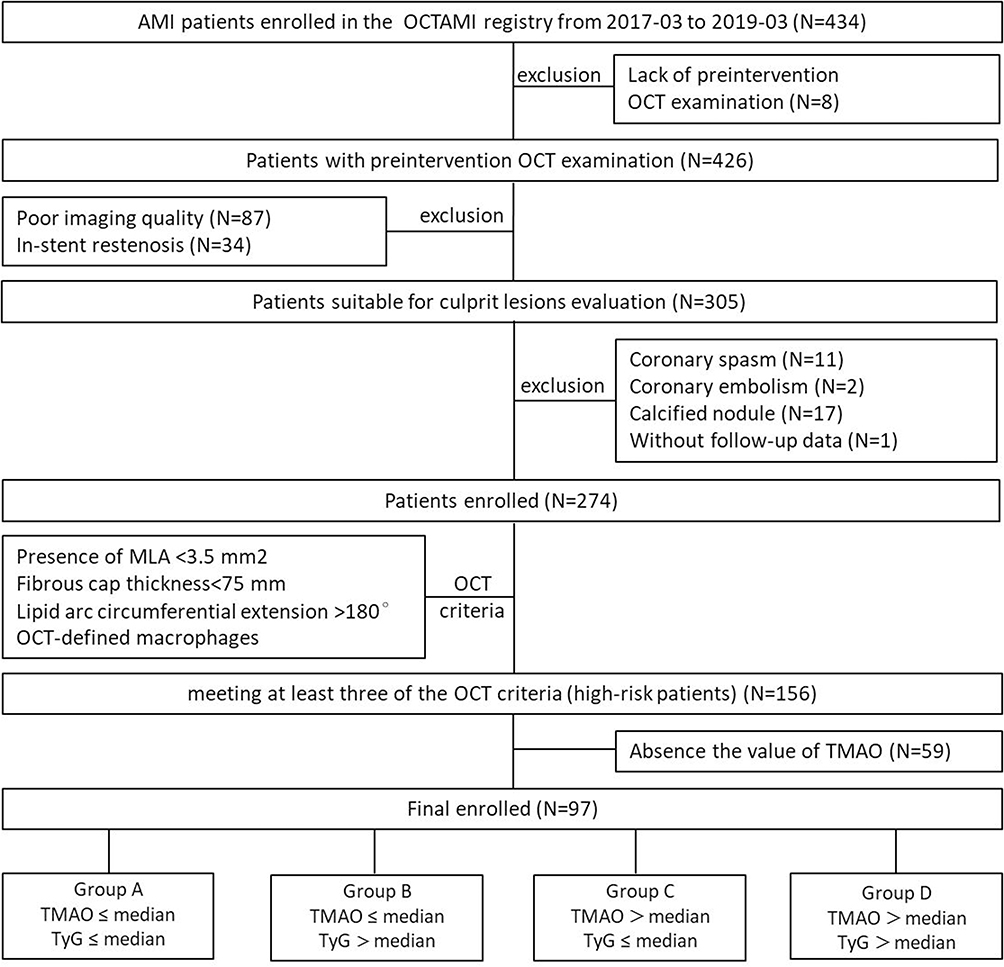 |
Figure 2 Study flow chart. Abbreviations: OCTAMI, Optical Coherence Tomography Examination in Acute Myocardial Infarction; OCT optical coherence tomography, AMI acute myocardial infarction; MLA, minimal lumen area; TMAO, Trimethylamine N-Oxide; TyG, Triglyceride glucose index Exclusion criteria of conducting OCT were cardiac shock, serious liver dysfunction, allergy to contrast media, severe hepatic and renal insufficiency, congestive heart failure, contraindication to aspirin or ticagrelor and lesions with characteristics which raised the difficulty and risk in performing OCT (eg, heavily calcified vessels, chronic total occlusion and left main coronary artery diseases). |
Statistical Analysis
Data are presented as mean ± standard deviation (SD) or median (interquartile range) for continuous variables, and continuous data are presented as median (25th and 75th percentiles) in the case of non-normal or normal distribution. For baseline characteristics analysis, the statistical differences among four groups were tested with t-test or one-way ANOVA for continuous variables and chi-square or Fisher test for categorical variables. The normal distribution of outcome variables was accessed using the Kolmogorov–Smirnov test. For baseline characteristic analysis, the statistical differences among groups were tested with t-test or one-way ANOVA for continuous variables and chi-square or Fisher test for categorical variables. We analyzed normal and non-normal distributed data using the independent sample t-test or Mann–Whitney U-test respectively between-group differences. Categorical data were presented as numbers (percentages) and were compared using the Fisher’s exact test or Pearson’s chi-squared (χ2) test. We used the multivariable Cox proportional hazards regression models with adjustments for confounding factors to determine the prognostic value. Furthermore, to evaluate the incidence rate of MACEs among groups according to the group of the TyG index and TMAO, we constructed Kaplan–Meier survival curves. Discrepancy rates of cumulative events were compared using the Log rank test. The authors had full access to and take full responsibility for the integrity of the data. All authors have read and agreed to the manuscript as written. Statistical analyses were performed using SPSS (version 20.0; IBM Corp., Armonk, NY, USA), R Programming Language X64 4.0.4 (R Foundation for Statistical Computing, Vienna, Austria), and MedCalc version 18.2.1 (MedCalc Software, Ostend, Belgium). Statistical significance was set at P < 0.05, and all P values were two-tailed.
Results
Patient Characteristics
Baseline characteristics of the 97 patients included in our study are shown in Table 1. The mean age was 57 years old, 80.4% were men, 62 (63.92%) had hypertension, while 32 (32.99%) were diabetic. Figure 1 has presented the representative cross-sectional optical coherence tomography images and 67 (69.07%), 67 (69.07%), and 25 (56.70%) patients had plaque ruptures, lipid-rich plaques, and calcifications, respectively. Furthermore, the prevalence of macrophages, microvessels, and cholesterol crystals were 92.78%, 20.62%, and 13.40%, respectively. The baseline characteristics according to the level of TMAO and TyG showed that patients with higher level in both indicators were more likely to have higher triglycerides (p < 0.001), fasting glucose (p < 0.001) and higher incidence of diabetes (p = 0.008). During the follow-up, some of the participants presented with MACE (20.67%), while a small subset of patients died (1.03%) or had recurrent MI (3.09%) and ischemic stroke (6.19%). The median values of concordance and discordance were 9.13 for the TyG index and 287.15 mg/L for the TMAO level, respectively (Table 1).
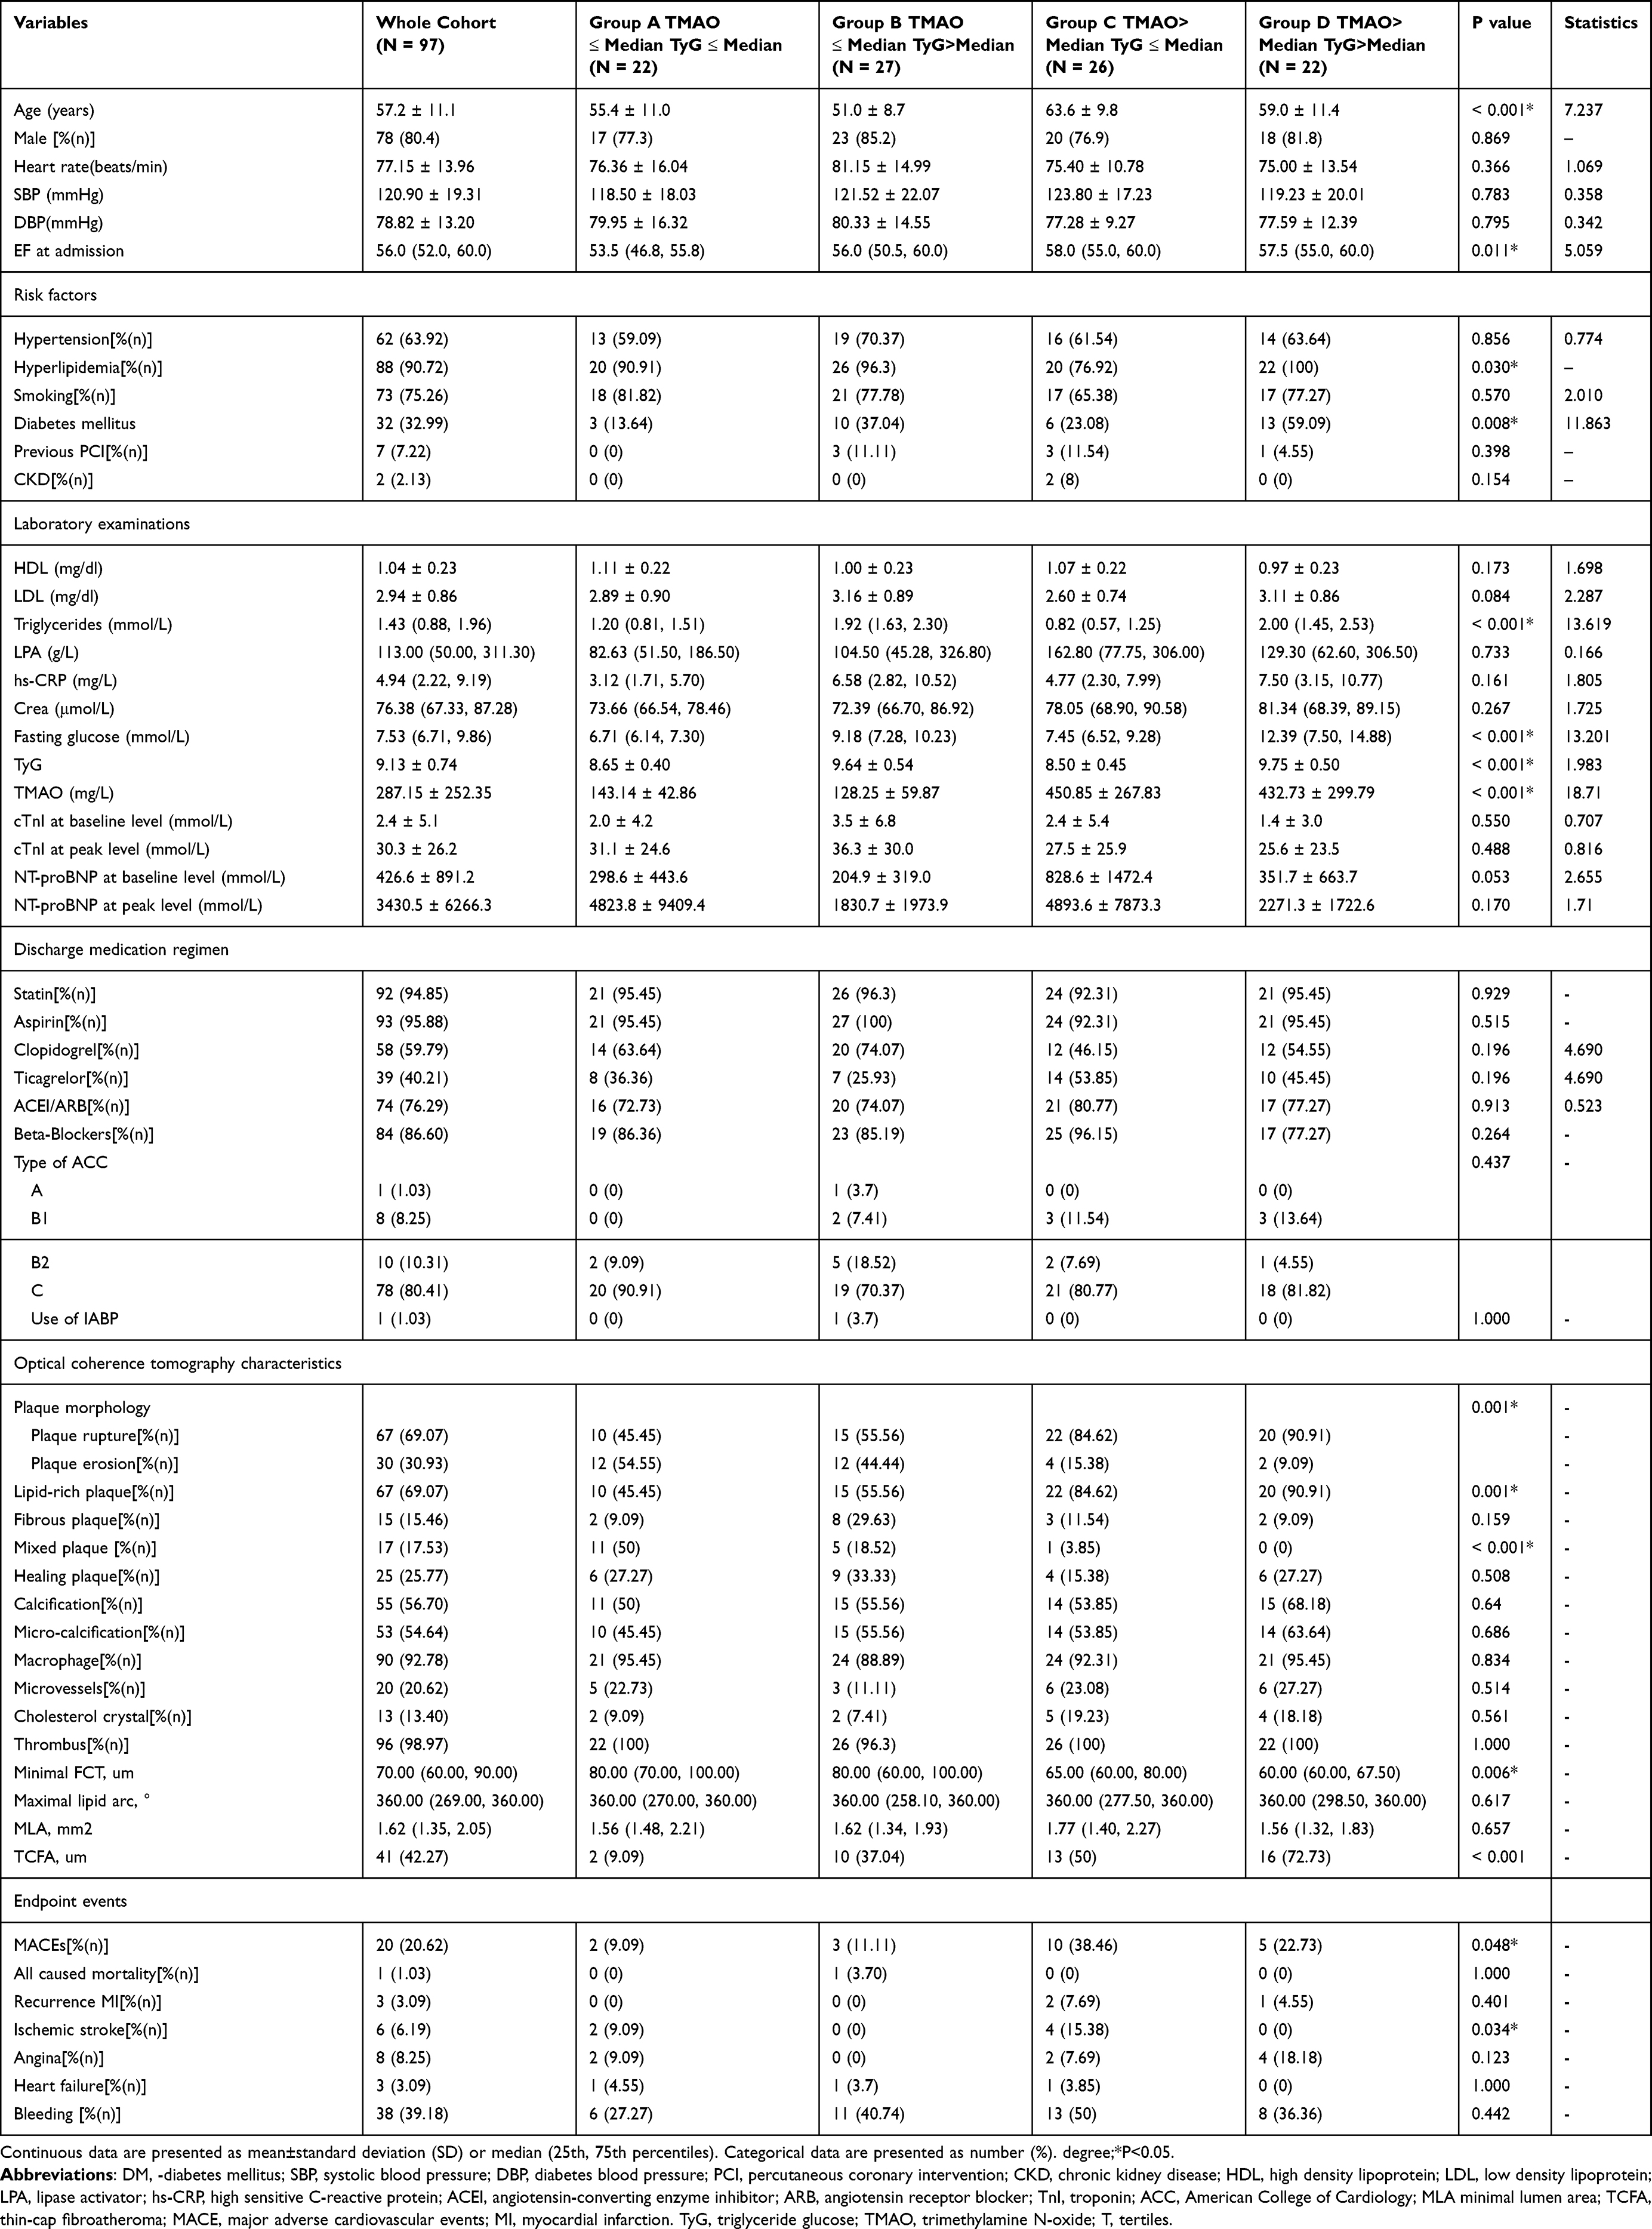 |
Table 1 Baseline Clinical and Optical Coherence Tomography Characteristics of the Study Population Among the High-Risk Cohort |
Comparison of Baseline Characteristics According to the TyG Index and TMAO Levels
According to the TyG index levels, we have divided the cohort into 4 groups: group A: TMAO ≤ median and TyG ≤ median; group B: TMAO ≤ median and TyG > median; group C: TMAO > median and TyG ≤ median; group C: TMAO > median and TyG > median. There were 22 (22.68%), 27 (27.84%), 26 (26.80%), 22 (22.68%) patients in group A, group B, group C, and group D, respectively. Patients in group C were older (p<0.001) and had higher ejection fraction (p=0.011), increased incidence of MACEs (p=0.048) and ischemic stroke (p=0.034). Meanwhile, patients in group D had a higher prevalence of hyperlipidemia (p=0.030), DM (p=0.008), plaque rupture (p=0.001), and lipid-rich plaques (p<0.001). Moreover, the characteristics of minimal fibrous cap thickness (FCT) were thinner among patients in group D (p=0.006) (Table 1).
Relationship Between Biomarkers and Parameters of OCT Characteristics
The TyG index was remained independently associated with the prevalence of thin-cap fibroatheroma (TCFA) (p=0.043) (Table 2). Moreover, the TMAO levels are correlated with parameters of plaque morphology (PE&PR) (p=0.012), lipid-rich plaque (p=0.016), mixed plaque (p=0.003), minimal FCT (p=0.004), and TCFA (p=0.001) significantly.
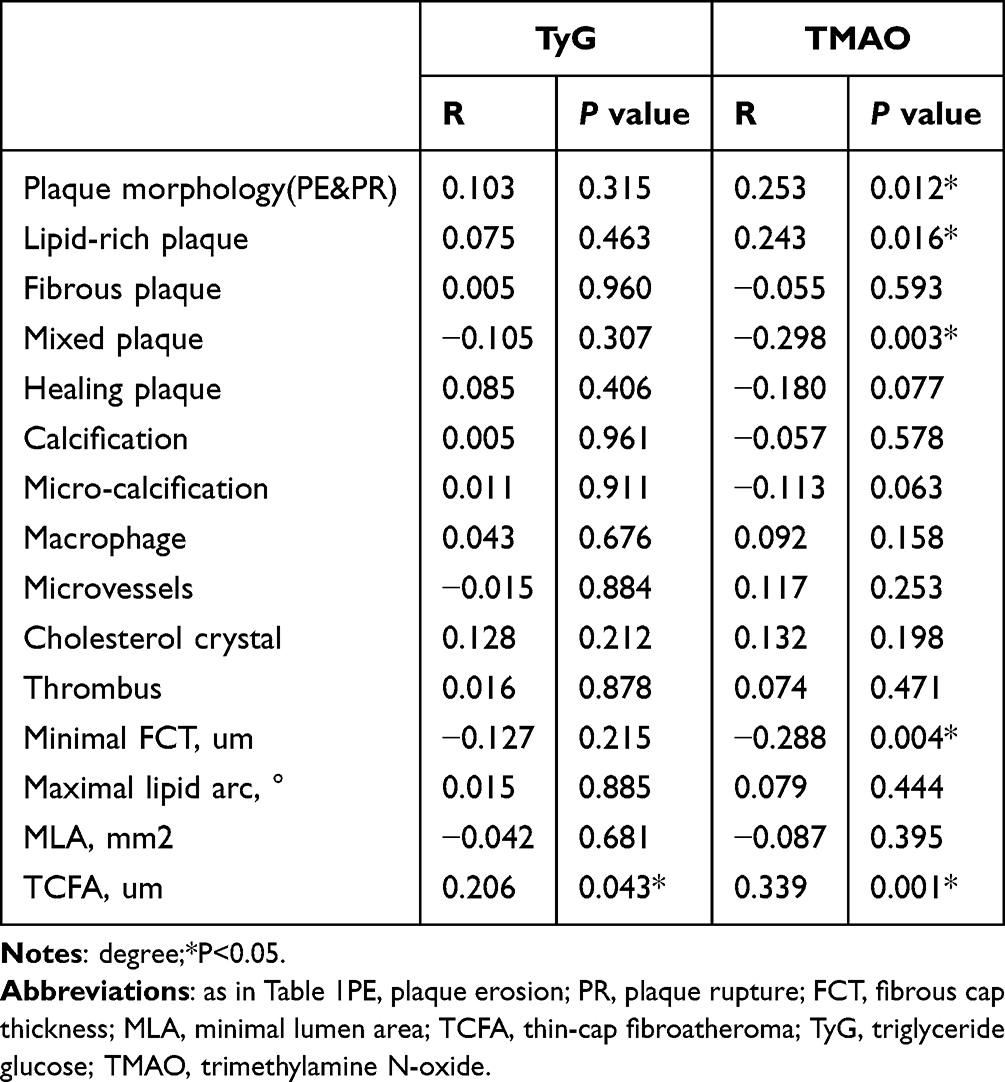 |
Table 2 Correlation Between Biomarkers and Optical Coherence Tomography Characteristics |
Relationship Between MACEs Stratified According to the TyG Index and TMAO Levels
Table 3 describes univariable and fully adjusted multivariable relationships between MACEs stratified according to the TyG index and TMAO levels in the overall population. On stratifying according to TMAO levels, a 42.8% increased risk of MACEs in the crude model was observed per standard deviation (SD) increase in the TMAO (HR = 1.428, p = 0.020). Furthermore, a 53% increased risk of MACEs was observed per SD increase in the TMAO among the fully adjusted model (HR = 1.530, p = 0.113). Patients in Tertile 3 (mean ± SD, 532.42 ± 297.17 mg/L) gained significantly higher risk for MACEs (hazard ratio [HR]: 4.748, p=0.048), while MACEs risk of patients in Tertile 2 did not show a significant difference (HR: 1.679, p=0.491). In addition, per SD level increase of the TyG index was associated with a 5.7% increase in MACEs risk (HR: 1.057, p = 0.895) among the fully adjusted model. Compared to Tertile 1 of the TyG index, patients in Tertile 3 were associated with a 43.9% increase in MACEs risk in the fully adjusted model. The survival curves for TyG and TMAO are shown in Figure 3.
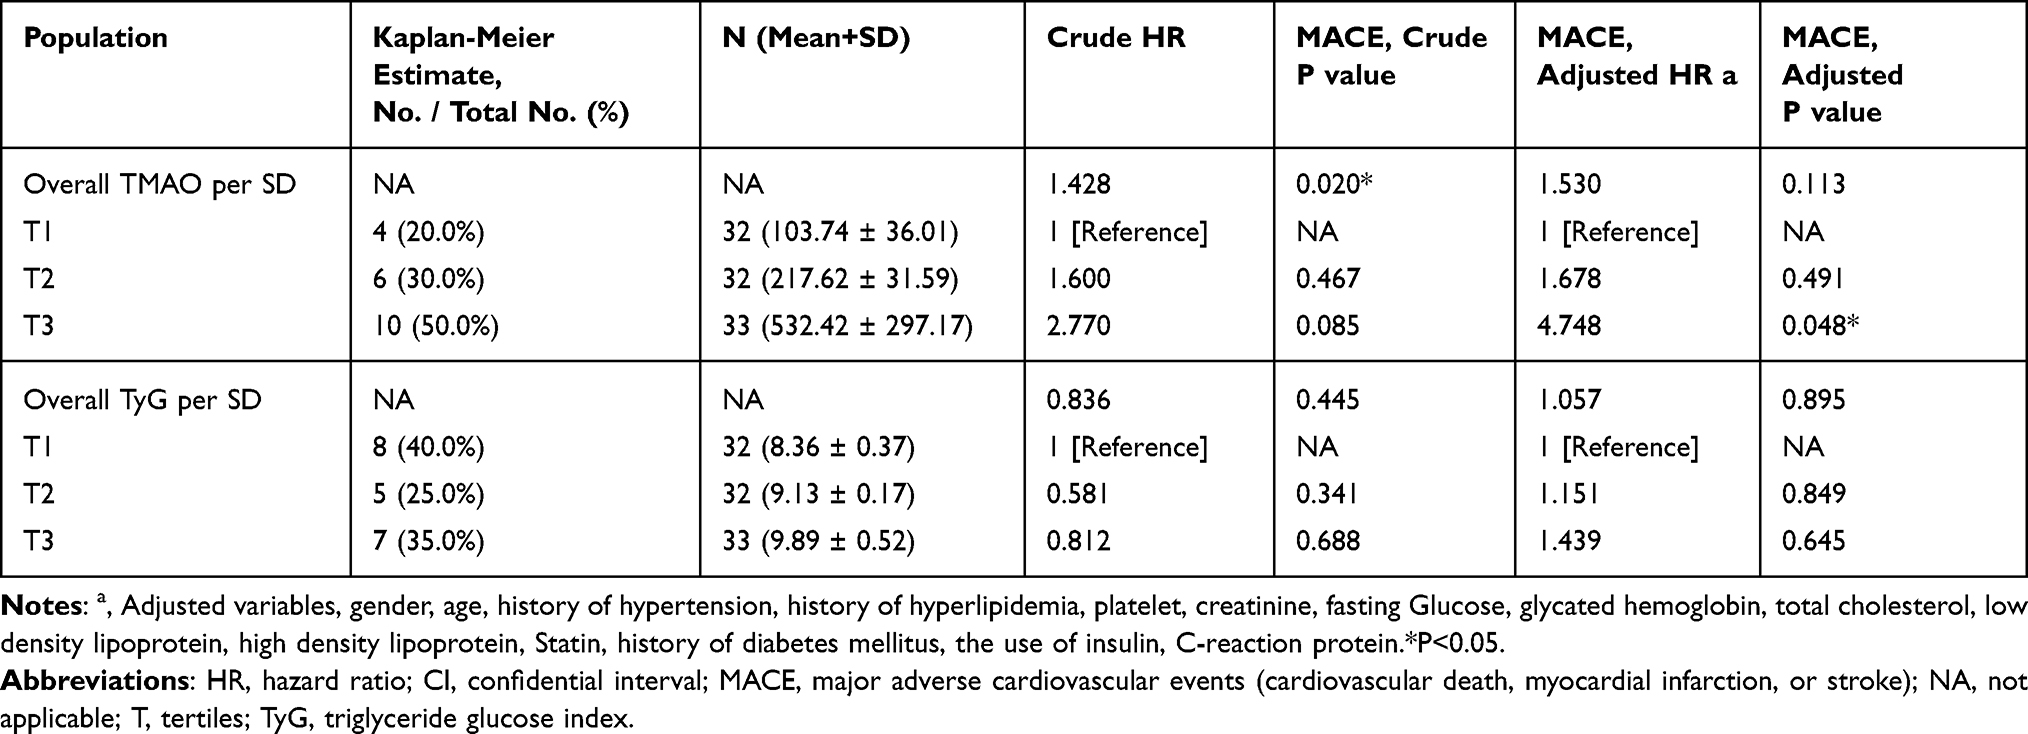 |
Table 3 Associations Between MACEs Stratified According to TyG Index and TMAO Tertiles Among High Risk OCT-Defined Patients |
 |
Figure 3 Survival curves for predicting MACEs according to the tertiles of TyG or TMAO. (A) performed survival curves for predicting MACEs according to the tertiles of TyG (A) and (B) performed survival curves for predicting MACEs according to the tertiles of TMAO (B). |
Outcomes According to the TyG Index and TMAO Plasma Levels
During a median follow-up of 2.03 years (25th to 75th percentiles range: 1.97–2.97), 20 (20.62%) patients experienced MACEs. In univariable analysis, group C, D, and B were associated with 4.97 (HR = 4.972, 95% confidence interval (CI): 1.089–22.703, P-value = 0.038), 2.58 (HR = 2.581, 95% CI: 0.499–13.350, P-value=0.038), and 1.21-fold (HR = 1.206, 95% CI: 0.201–7.231, P-value = 0.837) increase in MACEs compared with group A, respectively (Table 4). After adjusting for several variables in different models, including sex, age, hypertension, hyperlipidemia, DM, creatine kinase, C-reactive protein, TGs, and glucose, group C remained independently associated with an increased risk of MACEs. In contrast, no trend was observed in other groups compared with group A (Table 4). Notably, the incidence of MACEs was higher in group A (TMAO > median and TyG ≤ median) than in the other groups (p=0.033) significantly (Figure 4A). Similarly, patients in group A had an increased risk of MACEs compared to other groups with hyperlipidemia (p=0.016) (Figure 4B) or DM (p=0.036) (Figure 4C). However, there is no significant difference between the four groups among patients with hypertension (Figure 4D). We conducted the Receiver operating characteristic curve of TyG combined with plaque characteristics for predicting MACEs (Figure 5). The area under the ROC curve was 0.815 (95% CI, 0.723–0.887). The cut-off threshold (Youden index) was 0.5773 to generate the maximum sensitivity and specificity in predicting MACEs. The corresponding sensitivity and specificity were 85.00% and 72.73%, respectively.
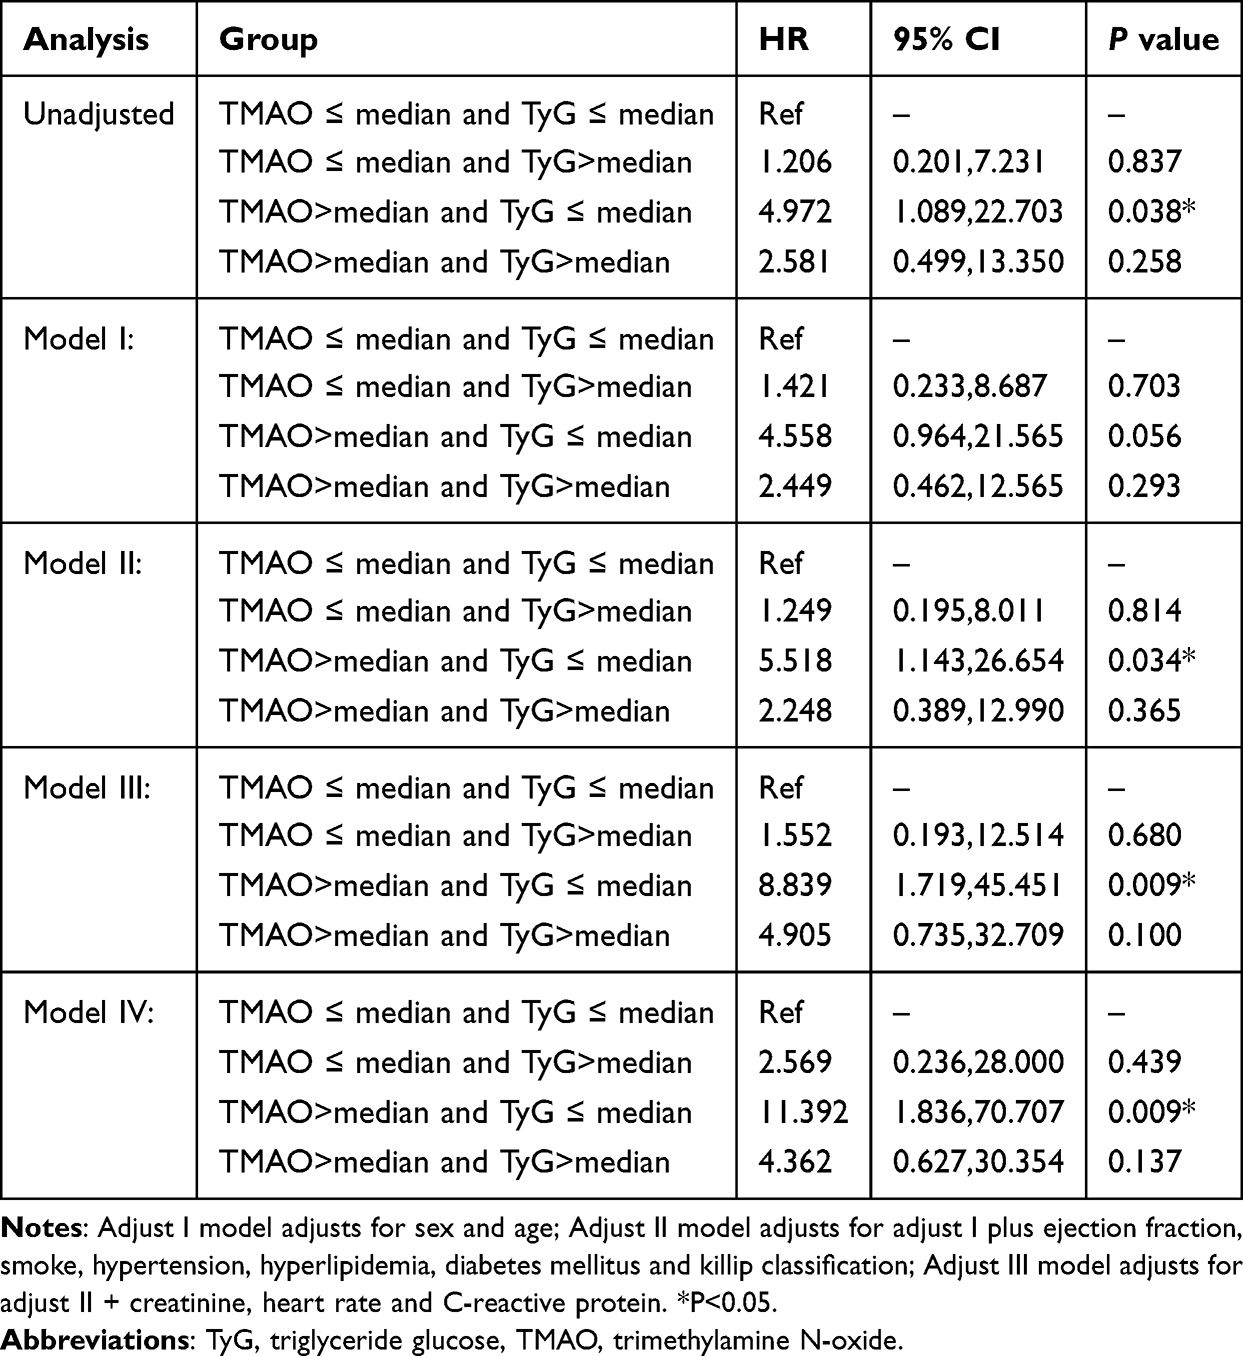 |
Table 4 Univariable and Multivariable Analyses of the Impact of TyG and TMAO on MACE |
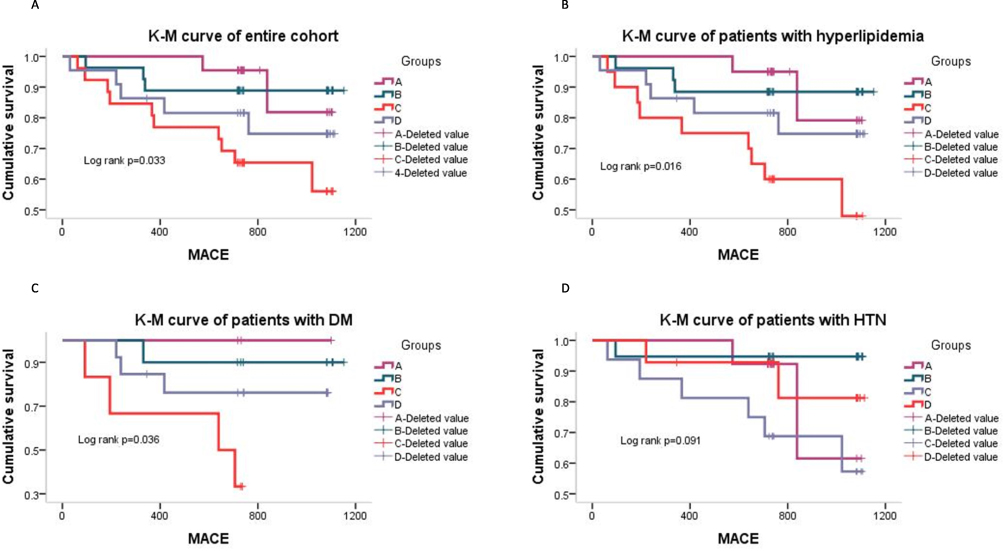 |
Figure 4 Kaplan–Meier curves showing cumulative MACE rates for up to median 2.03 years stratified by the level of TyG and TMAO characteristic among patients with high risk plaque characteristic. (A) Kaplan–Meier curves showing cumulative MACE rates stratified by the level of TyG and TMAO among total cohort of patients with high risk plaque characteristic. (B) Kaplan–Meier curves showing cumulative MACE rates stratified by the level of TyG and TMAO among hyperlipidemia cohort of patients with high risk plaque characteristic (C) Kaplan–Meier curves showing cumulative MACE rates stratified by the level of TyG and TMAO among DM cohort of patients with high risk plaque characteristic. (D) Kaplan–Meier curves showing cumulative MACE rates stratified by the level of TyG and TMAO among hypertension cohort of patients with high risk plaque characteristic. Group (A) TMAO ≤ median and TyG ≤ median; Group (B) TMAO ≤ median and TyG>median; Group (C) TMAO>median and TyG ≤ median; Group (D) TMAO>median and TyG>median. Abbreviations: MACE, major adverse cardiovascular events; K-M curve, Kaplan–Meier curves. |
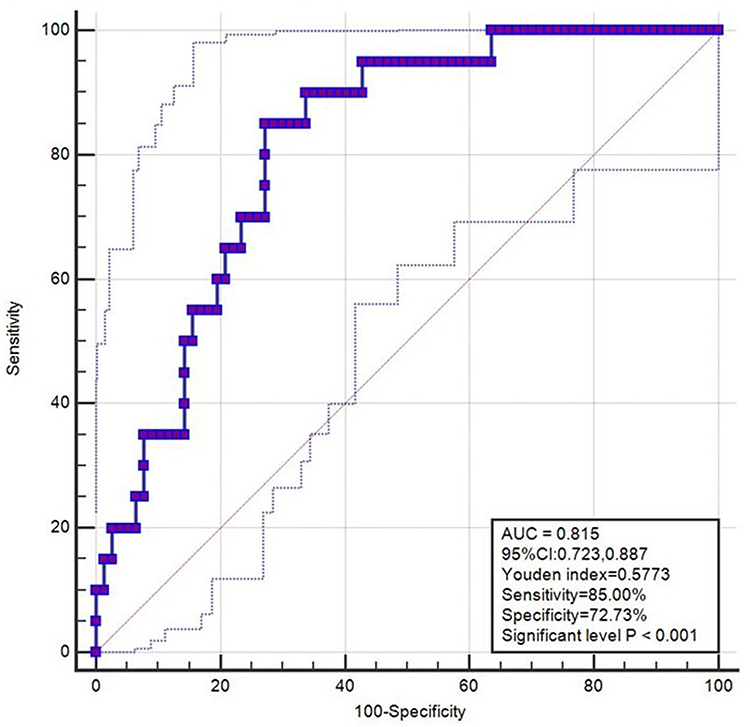 |
Figure 5 Receiver operating characteristic curve of triglyceride glucose index combined with plaque characteristics for predicting MACES. Adjusted variables including gender, age, status of smoking, hypertension, hyperlipidemia, diabetes mellitus, history of PCI, Killip classification, creatinine, low density lipoprotein. Abbreviations: MACEs, major adverse cardiovascular events; AUC, areas under the ROC curve; CI, 95% confidence interval. |
Discussion
In the present study, we retrospectively investigated the prognostic significance of the TyG index and TMAO levels to MACEs in patients with high-risk plaque characteristics defined by OCT, then treated with PCI. The main findings of the present study were: 1) In fully adjusted analyses, the TMAO > median and TyG ≤ median group were significantly associated with higher rates of MACEs (p=0.009). 2) The area under the receiver operating characteristic curve for predicting MACEs constructed to evaluate the diagnostic value of the TyG index combined with TMAO after full adjustment was 0.815. 3) Kaplan–Meier curves were generated for the cumulative incidence of MACEs stratified by the groupings of the TyG index and TMAO levels. Among the group of patients with TMAO > median and TyG ≤ median, there was a significantly higher incidence of MACEs (p=0.033).
The TyG Index and Coronary Artery Disease
There has been an increasing interest for using blood biomarkers to enhance risk stratification and clinical decision-making in several cardiovascular diseases. Previous studies have demonstrated and considered the TyG index an early predictor for individuals at high risk of developing DM and pre-DM. Several clinical literatures have been shown to be useful for risk stratification in patients with STEMI. TMAO and TyG are the two most commonly measured biomarkers for this purpose, and they represent different responses to those associated with cardiac atherogenic. In addition, the increased TyG index is prominently correlated with an increased risk of developing cardiovascular disease; thus, it helps identify people susceptible to cardiovascular disease.28–30 Ma et al31 evaluated the prognostic impact of the TyG index and incremental effect of risk stratification in a relatively longer follow-up among cohorts with non-ST-segment elevation acute coronary syndromes who underwent PCI and reported that the TyG index was an independent predictor of adverse clinical outcomes. Our previous results32 showed that the middle tertile of TyG was significantly associated with greater rates of MACEs in patients with plaque rupture in fully adjusted analyses. Moreover, the results indicated a significantly higher HR for MACEs in patients in the middle tertile of TyG than in those in the low tertile of TyG after full additional adjustment (HR, 5.45; 95% CI, 1.10–27.09; p=0.038). Furthermore, being in the high tertile of TyG independently and significantly increased the risk of major bleeding events among patients with pulmonary embolism (HR, 2.50; 95% CI, 1.11–5.65; p=0.028). These data, including our current findings, support that increasing the TyG index contributes to the higher incidence of MACEs. Additionally, these may suggest IR as a target in novel interventions for coronary heart disease prevention.
TMAO Levels and Coronary Artery Disease
There is a growing appreciation that the gut microbes play an important role in overall host metabolism. TMAO is atherogenic,11,33 while plasma TMAO levels can predict future CVD prevalence and MACEs, owing to the increased number of diseased coronary vessels and enhanced coronary artery atherosclerotic burden in patients with elevated TMAO levels.12,34 One study provided evidence on the relation of increased TMAO level to enhanced prothrombotic effect in patients.35 Similarly, we found that assessment of a high level of TMAO and low TyG index over a median follow-up of 2.03 years has a higher incidence of MACEs. Wang et al reported that blocking the production of trimethylamine might prevent the formation of atherosclerotic lesions. Thus, the gut microbial TMAO as a therapeutic target for atherosclerosis may be a novel intervention for coronary heart disease prevention.36
By contrast, decreasing plasma TMAO levels can reduce the risk of MACEs.37 Therefore, as recommended by current dietary guidelines, lifestyle intervention38 and modification of diet,12 such as reducing red meat intake,39 are important for modulating the gut microbiome and circulating TMAO levels. Subsequently, these could improve carotid intima-media thickness and reduce the incidence of MACEs.40
Prognostic Value of the Combination of the TyG Index and TMAO Levels on IR and the Gut Microbiota
In the present study, the two biomarkers were complementary in terms of prognostication. The incidence of MACEs was significantly higher in the group with TMAO > median, TyG ≤ median/TMAO > median, and TyG > median compared to other groups (p=0.033). Moreover, several human and animal experiments have confirmed that IR is closely associated with the gut microbiome.41,42 Germ-free mice infected with the gut microbiota content of conventionally raised mice presented with an increase in body weight and fat content, correlated with IR and glucose intolerance.43 Furthermore, intestinal microbiota transplantation to germ-free mice enhanced IR-associated adiposity, which may indicate a cause–effect relationship between IR and microbiota.44
Various hypotheses have explained the mechanism of the association. A hypothesis indicated that the intestinal bacteria of ob/ob mice are capable of removing more energy from the diet,45 which may result in enzymes produced by such bacteria that are efficient in dietary nutrient degradation. Meanwhile, most of the reported mechanisms propose that enzyme-produced bacteria may significantly influence the link between microbiota and insulin sensitivity.46 Moreover, the lipopolysaccharide from the intestinal flora bacteria can induce a chronic subclinical inflammatory process that leads to IR.47 Furthermore, a variety of inflammatory mediators, including branch-chain amino acids, are produced by intestinal microflora. Therefore, dysbiosis of the gut microbiota can increase intestinal mucosal permeability. These concepts may introduce new therapeutic avenues for the gut and gut microbiota-promoting metabolic inflammation, disorders, and their comorbidities.
Strength and Limitation
Our study for the first time assessed the relations of TyG combined with TAMO and subsequent risk of coronary heart disease among patients with high-risk plaque characteristics defined by OCT. However, several potential limitations warrant consideration. Firstly, it was a single-center study that was restricted to a selected group and the time of follow-up might not be long enough. Thus, further multi-center studies are needed to verify the findings of the present study. Furthermore, our study did not assess the timing or trajectories of the changes of TyG and TAMO. Therefore, there might be unmeasured exogenous or endogenous confounding factors; there also might be residual confounding factors for CHD incidence. Finally, compared with the OCTAMI registry study, which focuses on cardiovascular studies, other glucose-related variables were not assessed in this study.
Conclusion
This study demonstrated the usefulness of combined measures of the TyG index and TMAO in enhancing risk stratification in STEMI patients with OCT-defined high-risk plaque characteristics. Further studies with a larger number of patients are needed to confirm these results.
Data Sharing Statement
The datasets used and/or analyzed are available from the corresponding author (Hongbing Yan) on reasonable request.
Ethics Approval and Consent to Participate
It is from the ethics committee of the department of Cardiology, Fuwai Hospital, National Center for Cardiovascular Diseases, Peking Union Medical College, China.
Acknowledgments
The authors gratefully acknowledge all individuals who participated in this study.
The abstract of this paper was presented at the Conference name Organizing Committee of China Heart Congress (CHC) 2021 in conjunction with the 6th China Vascular Congress (CVC) as conference proceedings. The abstract was published in ZHONGGUO XUNHUAN ZAZHI CHINESE CIRCULATION JOURNAL (ISSN 1000-3614 CN 11-2212/R1).
Author Contributions
All authors have made a significant contribution to the work reported, including conception, study design, execution, acquisition of data, analysis and interpretation, or in all these areas. All authors have drafted or written, or substantially revised or critically reviewed the article. All authors have agreed on the journal to which the article will be submitted. All authors have reviewed and agreed on all versions of the article before submission, during revision, the final version accepted for publication, and any significant changes introduced at the proofing stage. All authors have agreed to take responsibility and be accountable for the contents of the article.
Funding
This study was supported by Shenzhen Key Medical Discipline Construction Fund (number: SZXK001), the Fund of “Sanming” Project of Medicine in Shenzhen (number: SZSM201911017), the Chinese Academy of Medical Sciences Innovation Fund for Medical Sciences (2016-I2M-1–009), National Natural Science Funds (number: 81970308). CAMS Innovation Fund for Medical Sciences (2023-I2M-C&T-B-069).
Disclosure
The authors report no conflicts of interest in this work.
References
1. Zhou M, Liu J, Hao Y, et al. Prevalence and in-hospital outcomes of diabetes among patients with acute coronary syndrome in China: findings from the improving care for cardiovascular disease in china-acute coronary syndrome project. Cardiovasc Diabetol. 2018;17(1):147.
2. Wiviott SD, Braunwald E, McCabe CH, et al. Prasugrel versus clopidogrel in patients with acute coronary syndromes. N Engl J Med. 2007;357(20):2001–2015. doi:10.1056/NEJMoa0706482
3. Cannon CP, Blazing MA, Giugliano RP, et al. Ezetimibe added to statin therapy after acute coronary syndromes. N Engl J Med. 2015;372(25):2387–2397. doi:10.1056/NEJMoa1410489
4. Guerrero-Romero F, Simental-Mendia LE, Gonzalez-Ortiz M, et al. The product of triglycerides and glucose, a simple measure of insulin sensitivity. Com- parison with the euglycemic-hyperinsulinemic clamp. J Clin Endocrinol Metab. 2010;95(7):3347–3351. doi:10.1210/jc.2010-0288
5. Mazidi M, Kengne AP, Katsiki N, Mikhailidis DP, Banach M. Lipid accumula- tion product and triglycerides/glucose index are useful predictors of insulin resistance. J Diabetes Complicat. 2018;32(3):266–270. doi:10.1016/j.jdiacomp.2017.10.007
6. Du T, Yuan G, Zhang M, Zhou X, Sun X, Yu X. Clinical usefulness of lipid ratios, visceral adiposity indicators, and the triglycerides and glu- cose index as risk markers of insulin resistance. Cardiovasc Diabetol. 2014;13(1):146. doi:10.1186/s12933-014-0146-3
7. Da Silva A, Caldas APS, Hermsdorf HHM, et al. Triglyceride-glucose index is associated with sympto- matic coronary artery disease in patients in secondary care. Cardiovasc Diabetol. 2019;18(1):89. doi:10.1186/s12933-019-0893-2
8. Li S, Guo B, Chen H, et al. The role of the triglyceride (triacylglycerol) glucose index in the development of cardiovascular events: a retrospective cohort analysis. Sci Rep-Uk. 2019;9(1):7320. doi:10.1038/s41598-019-43776-5
9. Cho Y, Ann SH, Won K, et al. Association between insulin resistance, hyperglycemia, and coronary artery disease according to the presence of diabetes. Sci Rep-Uk. 2019;9(1):6129. doi:10.1038/s41598-019-42700-1
10. Lee EY, Yang HK, Lee J, et al. Triglyceride glucose index, a marker of insulin resistance, is associated with coronary artery stenosis in asymptomatic subjects with type 2 diabetes. Lipids Health Dis. 2016;15(1):155. doi:10.1186/s12944-016-0324-2
11. Wang Z, Klipfell E, Bennett BJ, et al. Gut flora metabolism of phosphatidylcholine promotes cardiovascular disease. Nature. 2011;472(7341):57–63. doi:10.1038/nature09922
12. Tang WH, Wang Z, Levison BS, et al. Intestinal microbial metabolism of phosphatidylcholine and cardiovascular risk. N Engl J Med. 2013;368(17):1575–1584. doi:10.1056/NEJMoa1109400
13. Heianza Y, Ma W, Manson JE, et al. Gut microbiota metabolites and risk of major adverse cardiovascular disease events and death: a systematic review and meta-analysis of prospective studies. J Am Heart Assoc. 2017;6(7):e004947. doi:10.1161/JAHA.116.004947
14. Tearney GJ, Regar E, Akasaka T, et al. Consensus standards for acquisition, measurement, and reporting of intravascular optical coherence tomography studies: a report from the international working group for intravascular optical coherence tomography standardization and validation. J Am Coll Cardiol. 2012;59(12):1058–1072.
15. Kubo T, Imanishi T, Takarada S, et al. Assessment of culprit lesion morphology in acute myocardial infarction: ability of optical coherence tomography compared with intravascular ultrasound and coronary angioscopy. J Am Coll Cardiol. 2007;50(10):933–939. doi:10.1016/j.jacc.2007.04.082
16. Stone GW, Maehara A, Lansky AJ, et al. Prospect Investigators. A prospective natural-history study of coronary atherosclerosis. N Engl J Med. 2011;364(3):226–235. doi:10.1056/NEJMoa1002358
17. Xing L, Higuma T, Wang Z, et al. Clinical significance of lipid-rich plaque detected by optical coherence tomography: a 4-year follow-up study. J Am Coll Cardiol. 2017;69:2502–2513. doi:10.1016/j.jacc.2017.03.556
18. Waksman R. on behalf of the LRP investigators. Assessment of coronary near infrared spectroscopy imaging to detect vulnerable plaques and vulnerable patients. Late breaking trial. TCT. 2018;2018:1.
19. Ibanez B, James S, Agewall S, et al. ESC Guidelines for the management of acute myocardial infarction in patients presenting with ST-segment elevation: the Task Force for the management of acute myocardial infarction in patients presenting with ST-segment elevation of the European Society of Cardiology (ESC). Eur Heart J. 2018;39:119–177. doi:10.1093/eurheartj/ehx393
20. Aronow WS. Hypertension guidelines. Hypertension. 2011;58(3):347–348. doi:10.1161/HYPERTENSIONAHA.111.177147
21. Rubino F, Nathan DM, Eckel RH, et al. Metabolic surgery in the treatment algorithm for type 2 diabetes: a joint statement by international diabetes organizations. Diabetes Care. 2016;39(6):861–877. doi:10.2337/dc16-0236
22. Shrank WH, Barlow JF, Brennan TA. New therapies in the treatment of high cholesterol: an argument to return to goal-based lipid guidelines. JAMA. 2015;314(14):1443–1444. doi:10.1001/jama.2015.10017
23. Lin L, Zhao J, Hu J, et al. Current smoking has a detrimental effect on survival for Epidermal Growth Factor Receptor (EGFR) and Anaplastic Lymphoma Kinase (ALK) negative Advanced non-squamous Non-small Cell Lung Cancer (NSCLC) patients treated with pemetrexed continuation maintenance. J Cancer. 2018;9(12):2140–2146. doi:10.7150/jca.24872
24. Fiorentino TV, Marini MA, Succurro E, Andreozzi F, Sesti G. Relationships of surrogate indexes of insulin resistance with insulin sensitivity assessed by euglycemic hyperinsulinemic clamp and subclinical vascular damage. BMJ Open Diabetes Res Care. 2019;7(1):e000911. doi:10.1136/bmjdrc-2019-000911
25. Tian J, Ren X, Vergallo R, et al. Distinct morphological features of ruptured culprit plaque for acute coronary events compared to those with silent rupture and thin-cap fibroatheroma: a combined optical coherence tomography and intravascular ultrasound study. J Am Coll Cardiol. 2014;63(21):2209–2216. doi:10.1016/j.jacc.2014.01.061
26. Prati F, Regar E, Mintz GS, et al. Expert review document on methodology, terminology, and clinical applications of optical coherence tomography: physical principles, methodology of image acquisition, and clinical application for assessment of coronary arteries and atherosclerosis. Eur Heart J. 2010;31:401–415. doi:10.1093/eurheartj/ehp433
27. Wang Z, Levison BS, Hazen JE, Donahue L, Li XM, Hazen SL. Measurement of trimethylamine-N-oxide by stable isotope dilution liquid chromatography tandem mass spectrometry. Anal Biochem. 2014;455:35–40. doi:10.1016/j.ab.2014.03.016
28. Brahimaj A, Rivadeneira F, Muka T, et al. Novel metabolic indices and incident type 2 diabetes among women and men: the Rotterdam Study. Diabetologia. 2019;62(9):1581–1590. doi:10.1007/s00125-019-4921-2
29. Zhang M, Wang B, Liu Y, et al. Cumulative increased risk of incident type 2 diabetes mellitus with increasing triglyceride glucose index in normal-weight people: the rural Chinese cohort study. Cardiovasc Diabetol. 2017;16(1):30. doi:10.1186/s12933-017-0514-x
30. Su W, Chen S, Huang Y, et al. Comparison of the effects of fasting glucose, hemoglobin A1c, and triglyceride-glucose index on cardiovascular events in type 2 diabetes mellitus. Nutrients. 2019;11(11):2838. doi:10.3390/nu11112838
31. Ma X, Dong L, Shao Q, et al. Triglyceride glucose index for predicting cardiovascular outcomes after percutaneous coronary intervention in patients with type 2 diabetes mellitus and acute coronary syndrome. Cardiovasc Diabetol. 2020;19(1):31. doi:10.1186/s12933-020-01006-7
32. Zhao X, Wang Y, Chen R, et al. Triglyceride glucose index combined with plaque characteristics as a novel biomarker for cardiovascular outcomes after percutaneous coronary intervention in ST-elevated myocardial infarction patients: an intravascular optical coherence tomography study. Cardiovasc Diabetol. 2021;20(1):131. doi:10.1186/s12933-021-01321-7
33. Koeth RA, Wang Z, Levison BS, et al. Intestinal microbiota metabolism of L-carnitine, a nutrient in red meat, promotes atherosclerosis. Nat Med. 2013;19:576–585. doi:10.1038/nm.3145
34. Koeth RA, Levison BS, Culley MK, et al. gamma-Butyrobetaine is a proatherogenic intermediate in gut microbial metabolism of L-carnitine to TMAO. Cell Metab. 2014;20:799–812. doi:10.1016/j.cmet.2014.10.006
35. Rodes-Cabau J, Gutierrez M, Courtis J, et al. Importance of diffuse atherosclerosis in the functional evaluation of coronary stenosis in the proximal-mid segment of a coronary artery by myocardial fractional flow reserve measurements. Am J Cardiol. 2011;108:483–490. doi:10.1016/j.amjcard.2011.03.073
36. Wang Z, Roberts AB, Buffa JA, et al. Non-lethal inhibition of gut microbial trimethylamine production for the treatment of atherosclerosis. Cell. 2015;163:1585–1595. doi:10.1016/j.cell.2015.11.055
37. Guo Y, Hwang L-D, Li J, et al. Genetic analysis of impaired trimethylamine metabolism using whole exome sequencing. BMC Med Genet. 2017;18(1):11. doi:10.1186/s12881-017-0369-8
38. Randrianarisoa E, Lehn-Stefan A, Wang X, et al. Relationship of serum trimethylamine NOxide (TMAO) levels with early atherosclerosis in humans. Sci Rep. 2016;6:26745. doi:10.1038/srep26745
39. Wang Z, Bergeron N, Levison BS, et al. Impact of chronic dietary red meat, white meat, or non-meat protein on trimethylamine N-oxide metabolism and renal excretion in healthy men and women. Eur Heart J. 2019;40:583–594. doi:10.1093/eurheartj/ehy799
40. Heianza Y, Ma W, A DJ, et al. Long-term changes in gut microbial metabolite trimethylamine N-oxide and coronary heart disease risk. J Americ Coll Cardio. 2020;75(7):763–772. doi:10.1016/j.jacc.2019.11.060
41. Jiao N, Baker SS, Nugent CA, et al. Gut microbiome may contribute to insulin resistance and systemic inflammation in obese rodents: a meta-analysis. Physiol Genomics. 2018;50(4):244–254. doi:10.1152/physiolgenomics.00114.2017
42. Hartstra AV, Bouter KE, Backhed F, Nieuwdorp M. Insights into the role of the microbiome in obesity and type 2 diabetes. Diabetes Care. 2015;38(1):159–165. doi:10.2337/dc14-0769
43. Backhed F, Ding H, Wang T, et al. The gut microbiota as an environmental factor that regulates fat storage. Proc Natl Acad Sci USA. 2004;101:15718–15723. doi:10.1073/pnas.0407076101
44. Turnbaugh PJ, Ley RE, Mahowald MA, Magrini V, Mardis ER, Gordon JI. An obesity-associated gut microbiome with increased capacity for energy harvest. Nature. 2006;444:1027–1031. doi:10.1038/nature05414
45. Warwick BP, Romsos DR. Energy balance in adrenalectomized ob/ob mice: effects of dietary starch and glucose. Am J Physiol Regul Integr Comp Physiol. 1988;255:R141–R148. doi:10.1152/ajpregu.1988.255.1.R141
46. Neis EP, Dejong CH, Rensen SS. The role of microbial amino acid metabolism in host metabolism. Nutrients. 2015;7:2930–2946. doi:10.3390/nu7042930
47. Zhao L. The gut microbiota and obesity: from correlation to causality. Nat Rev Microbiol. 2013;11:639–647. doi:10.1038/nrmicro3089
 © 2024 The Author(s). This work is published and licensed by Dove Medical Press Limited. The full terms of this license are available at https://www.dovepress.com/terms.php and incorporate the Creative Commons Attribution - Non Commercial (unported, v3.0) License.
By accessing the work you hereby accept the Terms. Non-commercial uses of the work are permitted without any further permission from Dove Medical Press Limited, provided the work is properly attributed. For permission for commercial use of this work, please see paragraphs 4.2 and 5 of our Terms.
© 2024 The Author(s). This work is published and licensed by Dove Medical Press Limited. The full terms of this license are available at https://www.dovepress.com/terms.php and incorporate the Creative Commons Attribution - Non Commercial (unported, v3.0) License.
By accessing the work you hereby accept the Terms. Non-commercial uses of the work are permitted without any further permission from Dove Medical Press Limited, provided the work is properly attributed. For permission for commercial use of this work, please see paragraphs 4.2 and 5 of our Terms.