Back to Journals » International Journal of General Medicine » Volume 18
A Clinical Risk Prediction Model for Depressive Disorders Based on Seven Machine Learning Algorithms
Authors Jin W, Chen S, Wang M, Lin P
Received 3 March 2025
Accepted for publication 30 April 2025
Published 8 May 2025 Volume 2025:18 Pages 2461—2473
DOI https://doi.org/10.2147/IJGM.S524016
Checked for plagiarism Yes
Review by Single anonymous peer review
Peer reviewer comments 2
Editor who approved publication: Dr Redoy Ranjan
Weifeng Jin,* Shuzi Chen,* Mengxia Wang,* Ping Lin
Department of Medical Laboratory, Shanghai Mental Health Center, Shanghai Jiao Tong University School of Medicine, Shanghai, People’s Republic of China
*These authors contributed equally to this work
Correspondence: Ping Lin, Email [email protected]
Objective: To develop a clinical risk prediction model for depressive disorders using seven machine learning algorithms based on routine blood test indicators.
Methods: A retrospective study was conducted, involving 284 patients with depressive disorders and 214 healthy controls recruited between January and October 2024. Clinical data, including age, sex, and routine blood test results, were collected. The dataset was randomly divided into a training set (70%; n=348) and a test set (30%; n=150). Univariate logistic regression analysis (p< 0.1) was initially performed to identify potential predictors, followed by feature selection using the Boruta and LASSO algorithms. Seven machine learning algorithms were employed to construct predictive models, with their performance evaluated using metrics such as AUC, sensitivity, specificity, positive predictive value (PPV), negative predictive value (NPV), precision, recall, and F1 score. A multivariable logistic regression model was subsequently used to develop a nomogram, and its discrimination, calibration, and clinical utility were comprehensively assessed.
Results: Four significant predictors (alkaline phosphatase [AKP], serotonin, phenylalanine [Phe], and arginine [Arg]) were identified through univariate logistic regression combined with Boruta and LASSO feature selection. Among the seven algorithms, the random forest model exhibited the highest AUC, achieving an AUC of 1.000 (95% CI: 1.000– 1.000) in the training set and 0.958 (95% CI: 0.931– 0.985) in the test set. However, due to concerns about potential overfitting, the multivariable logistic regression model was selected as the final predictive model. A nomogram was constructed based on this model.
Conclusion: This study successfully developed a clinically interpretable risk prediction model for depressive disorders by integrating machine learning algorithms and routine blood test indicators. The logistic regression model demonstrated robust performance across all metrics and holds potential as a reliable auxiliary tool for the diagnosis of depressive disorders.
Keywords: depressive disorders, machine learn
Introduction
Depressive disorder is a prevalent mental illness with a rapidly increasing global burden, posing a significant public health challenge. A study published in The Lancet reported that the COVID-19 pandemic led to a 28% increase in the prevalence of major depressive disorder and a 26% increase in anxiety disorders worldwide in 2020, with women and younger populations being disproportionately affected.1 Currently, the diagnosis of depressive disorders relies primarily on clinical evaluations conducted by psychiatrists, based on criteria outlined in the Diagnostic and Statistical Manual of Mental Disorders, Fifth Edition (DSM-5) or the International Classification of Diseases, Tenth Revision (ICD-10). However, the absence of objective biomarkers for depressive disorders remains a critical limitation, reducing the accuracy and efficiency of diagnosis. Although significant efforts have been made to identify potential biomarkers, no widely accepted or reliable objective indicators have been established to date.2,3
In recent years, machine learning algorithms have emerged as powerful tools, capable of addressing the limitations of traditional statistical methods. These algorithms have been successfully applied to various medical scenarios. However, existing predictive models for depressive disorders primarily rely on imaging data.4,5 While imaging-based models demonstrate strong discriminatory performance, their high costs and technical complexity significantly limit their clinical applicability. To address these challenges, this study aims to identify differences in routine blood test indicators between patients with depressive disorders and healthy controls, and to develop a cost-effective, accessible, and user-friendly clinical prediction model to facilitate early diagnosis and timely intervention.
Methods
Study Design and Participants
A retrospective study was conducted, comprising 284 patients diagnosed with depressive disorders at the Shanghai Mental Health Center and 214 healthy controls who underwent routine physical examinations during the same period. Blood test data, including the albumin-to-globulin ratio (A/G), low-density lipoprotein (LDL), triglycerides (TG), high-density lipoprotein (HDL), γ-glutamyl transferase (GGT), alanine transaminase (ALT), creatinine (CREA), alkaline phosphatase (AKP), blood urea nitrogen (BUN), glucose (GLU), total cholesterol (TC), total bilirubin (T-BIL), arginine (Arg), serotonin (5-HT), tryptophan (Trp), phenylalanine (Phe), and methionine (Met), were retrieved from the hospital’s information system for analysis.
Statistical Analysis
The dataset was randomly divided into a training set (70%) and a test set (30%). Normally distributed data were presented as mean ± standard deviation ( ), while non-normally distributed data were expressed as medians with interquartile ranges (M [P25–P75]). Univariate logistic regression analysis was performed to identify potential predictors (p<0.1). Significant variables were subsequently subjected to LASSO regression with 10-fold cross-validation and the Boruta algorithm to determine the optimal combination of predictors. The overlapping subset of variables identified by these methods was utilized to construct predictive models using seven machine learning algorithms. Given its high interpretability and simplicity, the logistic regression model was ultimately selected to develop a nomogram. The model’s performance was evaluated based on its discrimination, calibration, and clinical utility. All statistical analyses were conducted using the R software package (version 4.2.1).
Ethical Statement
This was a retrospective study that adhered to the guidelines outlined in the Declaration of Helsinki and was approved by the Ethics Committee of the Shanghai Mental Health Centre under approval number 2024 KY-190. All study participants gave informed consent.
Results
Baseline Characteristics
The dataset was randomly divided into a training set (70%) and a test set (30%). Baseline characteristics of the two groups are summarized in Table 1, with no statistically significant differences observed between the training and test sets, ensuring the comparability of the data.
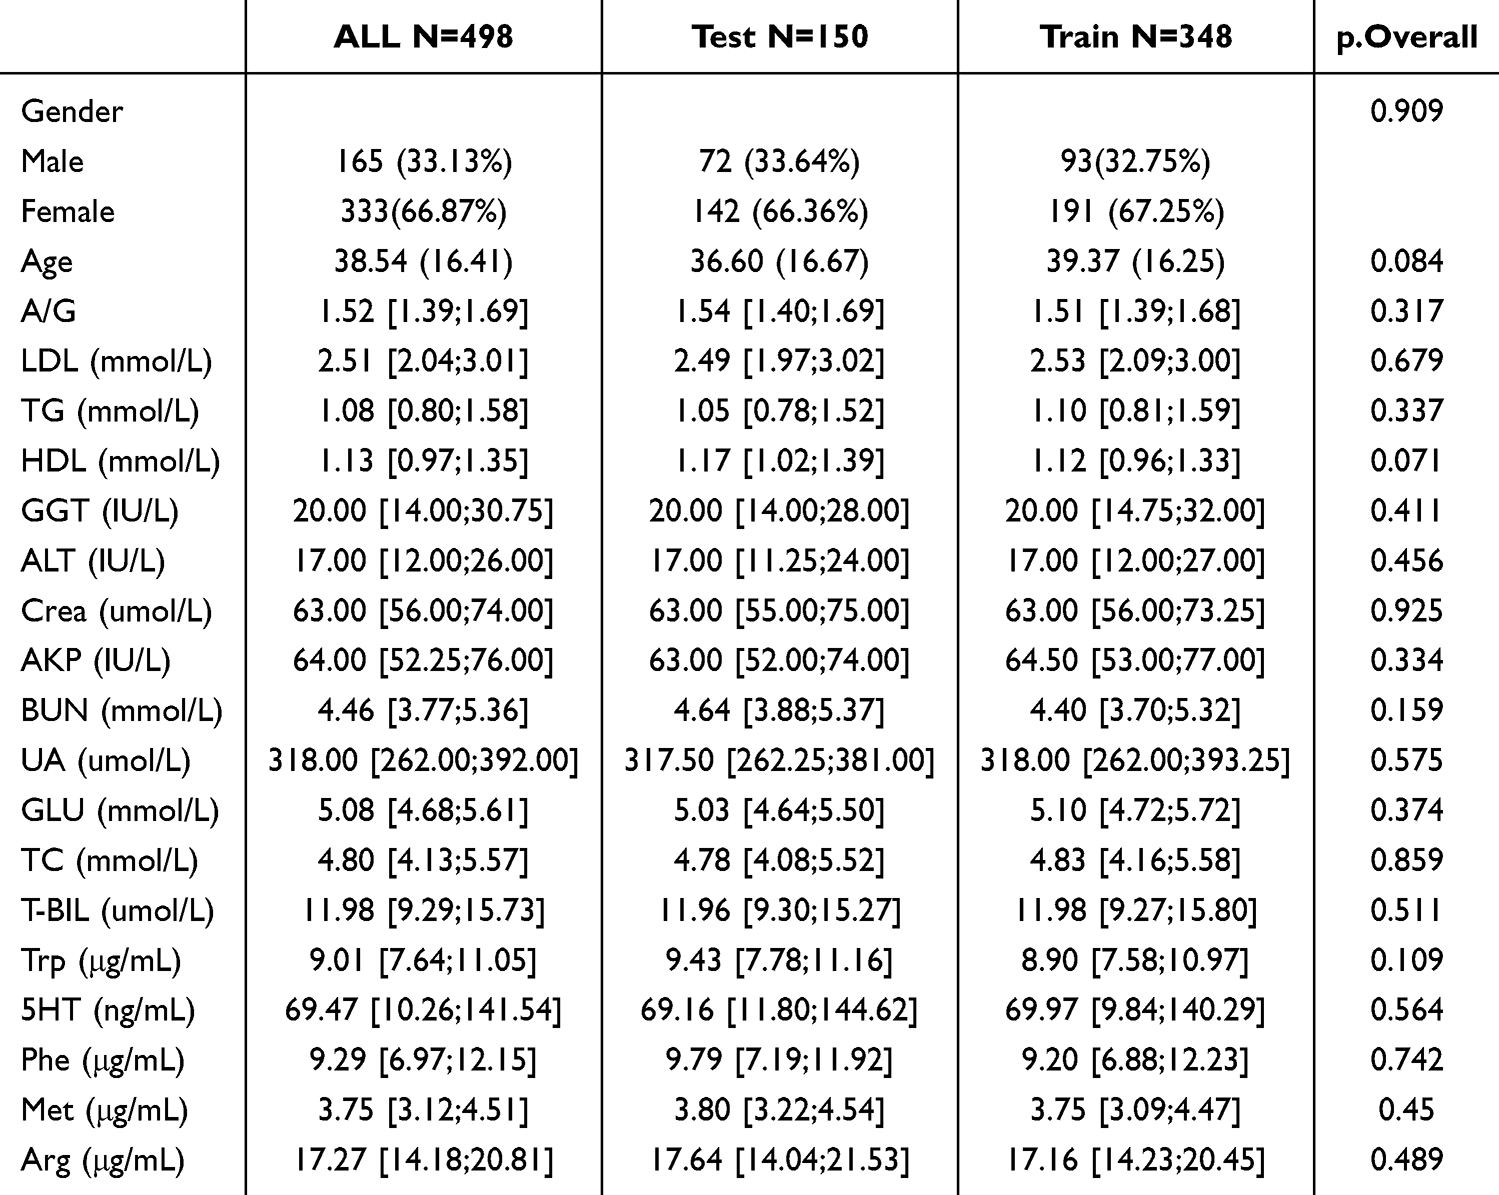 |
Table 1 Analysis of Baseline Data for Training and Validation Sets |
Univariate Logistic Regression Analysis
Univariate logistic regression analysis identified the following blood indicators as significant predictors (p<0.1): arginine (Arg), methionine (Met), phenylalanine (Phe), serotonin, tryptophan (Trp), glucose (GLU), uric acid (UA), alkaline phosphatase (AKP), γ-glutamyl transferase (GGT), high-density lipoprotein (HDL), and the albumin-to-globulin ratio (A/G) (Table 2).
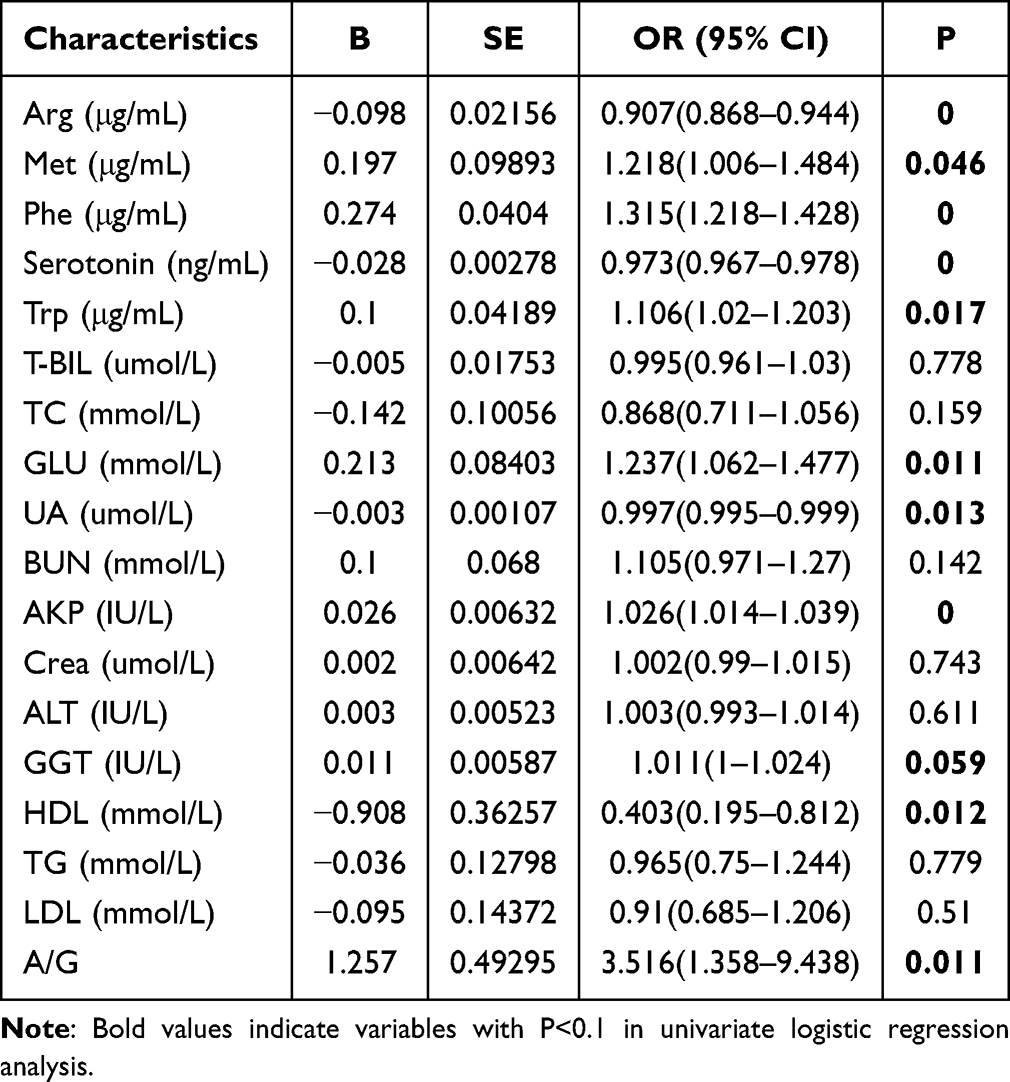 |
Table 2 Univariate Logistic Regression Analysis |
Feature Selection: LASSO and Boruta
LASSO regression identified arginine (Arg), alkaline phosphatase (AKP), phenylalanine (Phe), and serotonin as the optimal predictors at Lambda.1se (Figure 1). Similarly, Boruta analysis confirmed Arg, AKP, Phe, and serotonin as significant predictors, while additionally identifying methionine (Met), tryptophan (Trp), glucose (GLU), and the albumin-to-globulin ratio (A/G) as relevant variables (Figure 2).
 |
Figure 1 Lasso Screening. (a) Lasso log-lambda and (b) Lasso cross-validation. |
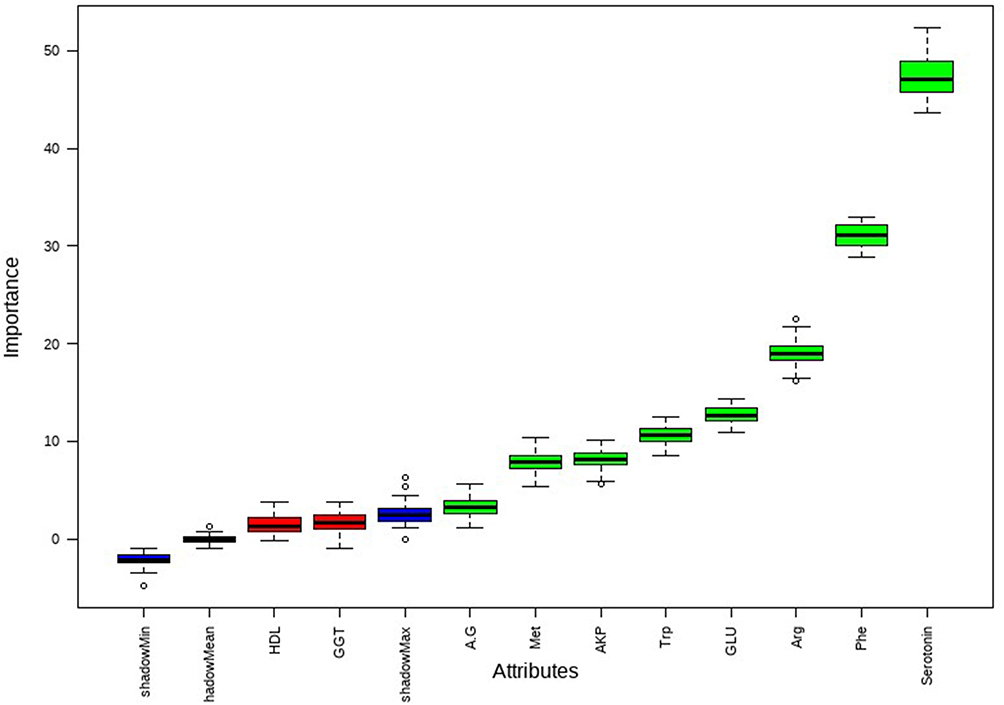 |
Figure 2 Bourta Screening. |
Machine Learning Model Evaluation
After performing LASSO regression and Boruta feature selection, predictive models were constructed and evaluated using seven machine learning algorithms: decision trees (DT), random forests (RF), extreme gradient boosting (XGBoost), k-nearest neighbors (KNN), light gradient boosting machines (LightGBM), support vector machines (SVM), and logistic regression (LR). A comprehensive model incorporating all selected variables was developed, and the performance of each algorithm was evaluated based on metrics such as AUC, sensitivity, specificity, positive predictive value (PPV), negative predictive value (NPV), precision, recall, and F1 score (Table 3). Confusion matrices for all seven models are shown in Figure 3.
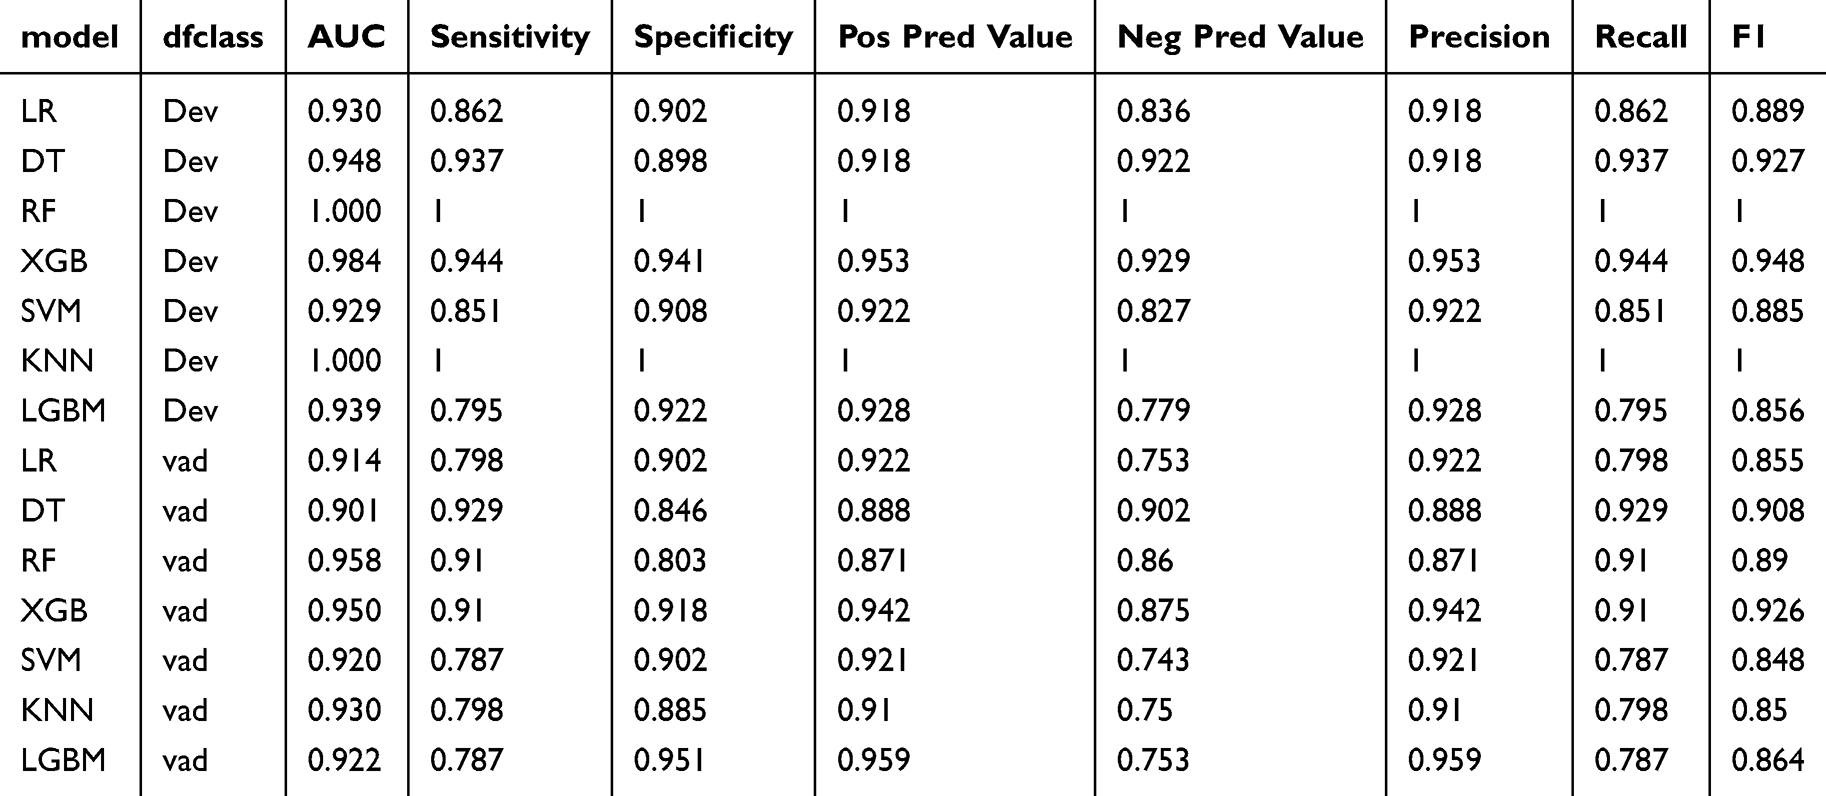 |
Table 3 Predictive Performance Comparison of the Seven Types of Machine Learning Algorithms |
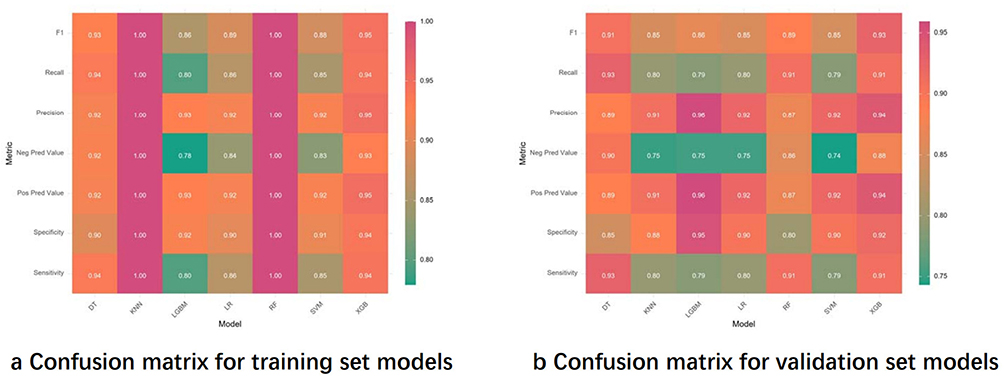 |
Figure 3 Confusion matrices for seven models. (a) Illustrates the machine learning confusion matrix for the training set and (b) presents the machine learning confusion matrix for the validation set. |
Among the seven models, the random forest (RF) algorithm achieved the highest AUC in both the training and validation sets, as shown in Figure 4. The variable importance rankings and SHAP interpretation plots for the RF model are presented in Figures 5 and 6. Although the RF model demonstrated the best AUC performance on the validation set (AUC = 0.958), concerns about potential overfitting prompted further evaluation. A comparison between the AUC of the RF model (0.958) and the logistic regression (LR) model (0.914) on the validation set revealed no statistically significant difference (P = 0.105). Consequently, the logistic regression model was selected as the final model due to its superior interpretability and robustness.
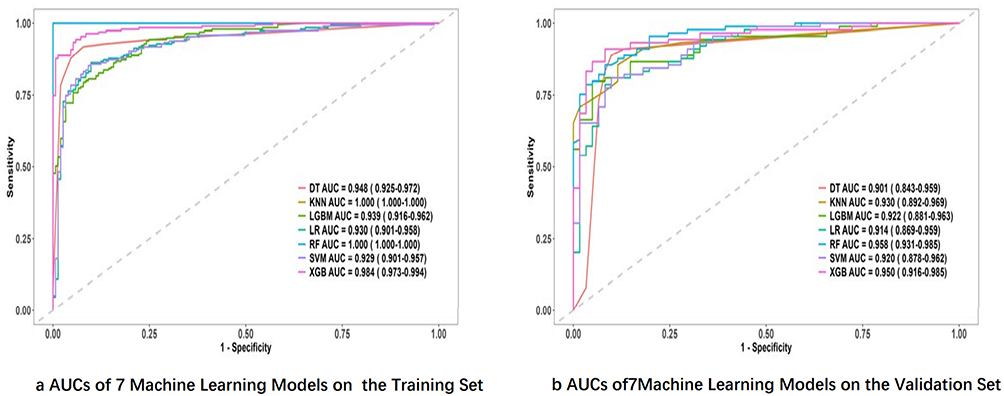 |
Figure 4 Machine learning ROC curve. (a) The ROC curves of seven machine learning models for the Training Set and (b) shows the ROC curves of seven machine learning models for the Validation Set. |
 |
Figure 5 Variable importance in Random Forest. |
 |
Figure 6 SHAP diagram in Random Forest. |
Multivariate Logistic Regression and Model Construction
A multivariate logistic regression model was developed with disease diagnosis as the dependent variable. The resulting logistic regression equation is as follows:
 (Table 4), indicating that alkaline phosphatase (AKP) and phenylalanine (Phe) were positively associated with the likelihood of depressive disorders, while serotonin and arginine (Arg) were negatively associated. No multicollinearity was observed among the variables, ensuring the stability and reliability of the model.
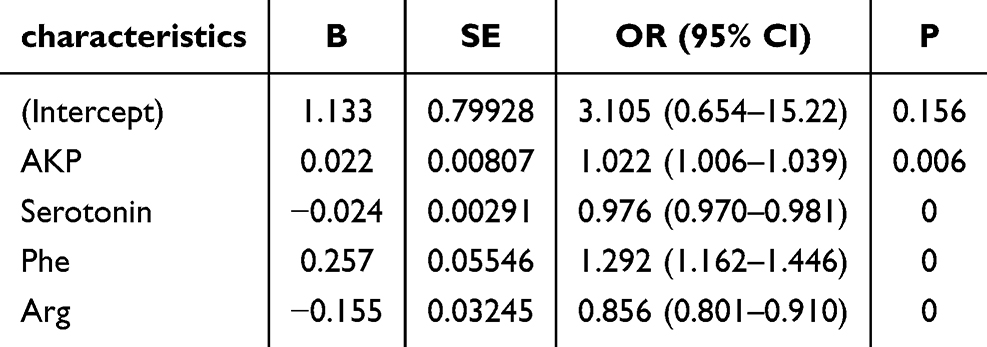 |
Table 4 Multivariate Logistic Regression Analysis in the Training Cohort |
Performance Evaluation of the Prediction Model
The predictive model’s performance was primarily assessed based on discrimination and calibration. After 500 bootstrap resampling iterations, the area under the ROC curve (AUC) was 0.9508 (95% CI: 0.9274–0.9741) for the training set and 0.9429 (95% CI: 0.9092–0.9766) for the validation set, demonstrating outstanding discriminatory power in differentiating depressive disorder patients from healthy controls (Figure 7).
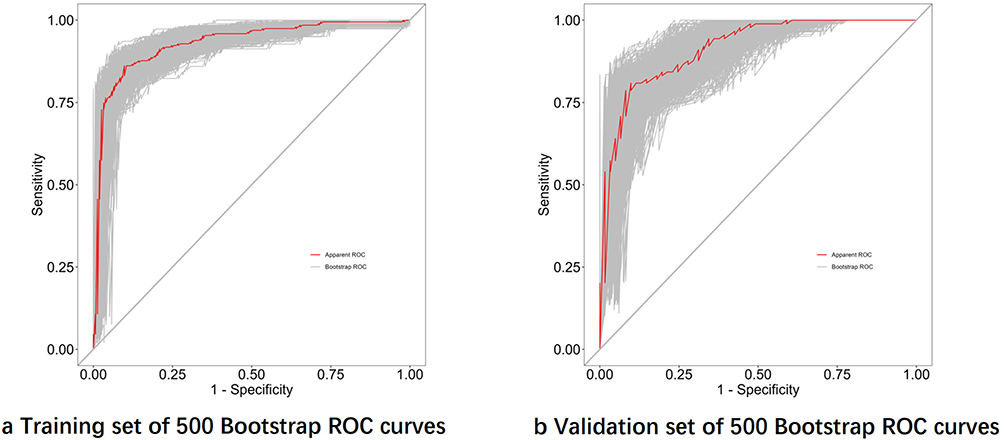 |
Figure 7 Logistic regression model ROC curve after 500 Bootstraps. (a) The area of the ROC curve after 500 bootstrap for the Training Set and (b) shows the area of the ROC curve after 500 bootstrap for the Validation Set. |
The model’s prediction accuracy was further evaluated using the Brier score, which was 0.100 for the training set and 0.119 for the validation set, indicating minimal prediction error and high accuracy. Calibration curves generated after 500 bootstrap resampling iterations revealed strong concordance between predicted probabilities and observed outcomes (Figure 8). Moreover, the Hosmer-Lemeshow goodness-of-fit test produced p-values of 0.104 for the training set and 0.072 for the validation set, suggesting no statistically significant differences between predicted and actual probabilities. These findings confirm the model’s excellent calibration performance.
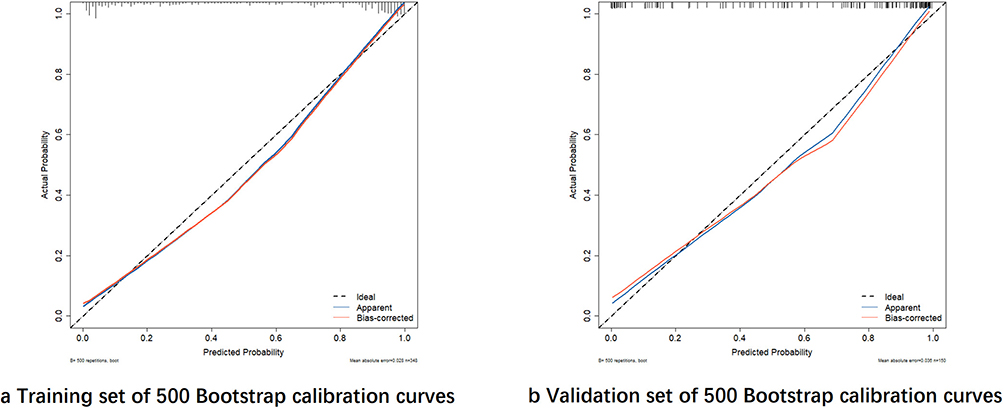 |
Figure 8 Calibration curves of logistic regression model after 500 bootstraps. (a) The calibration curve after 500 bootstrap for theTraining Set and (b) shows the calibration curve after 500 bootstrap for the Validation Set. |
Nomogram Construction and Clinical Utility Evaluation
A nomogram was developed based on the significant predictors identified in the multivariate analysis, including four key variables (AKP, Serotonin, Phe, and Arg). The nomogram provides a visual representation of the predictive model (Figure 9).
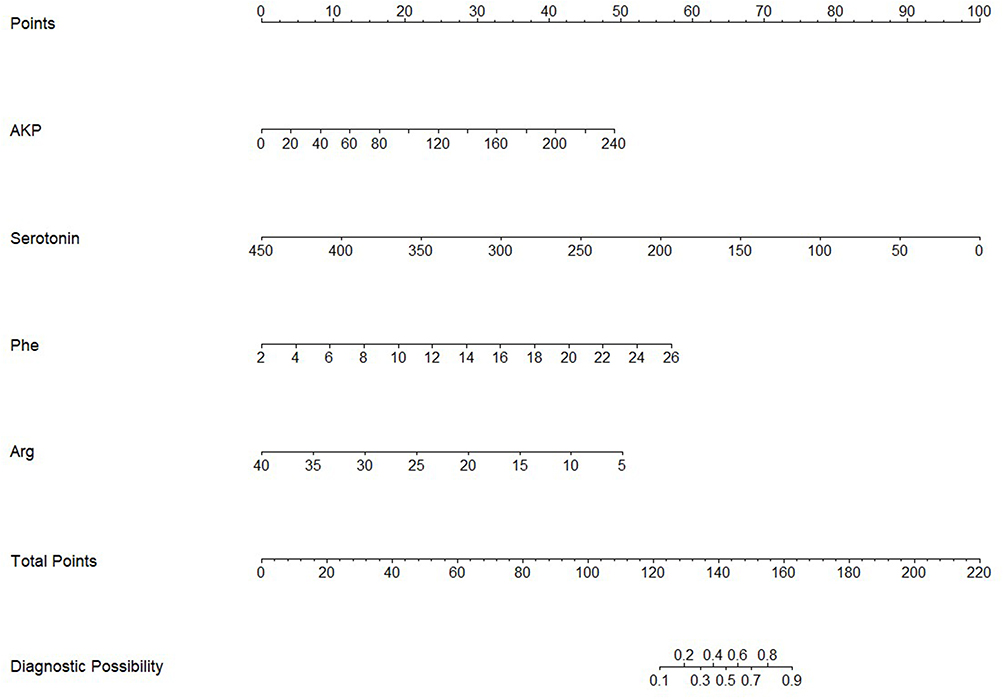 |
Figure 9 Nomogram for predicting depressive disorder. |
The clinical utility of the nomogram was assessed using decision curve analysis (DCA). The results showed that the nomogram achieved maximum net benefit within a threshold probability range of 0% to 100% (Figure 10). This indicates that the model has strong clinical applicability and can assist in risk stratification and decision-making for depressive disorders.
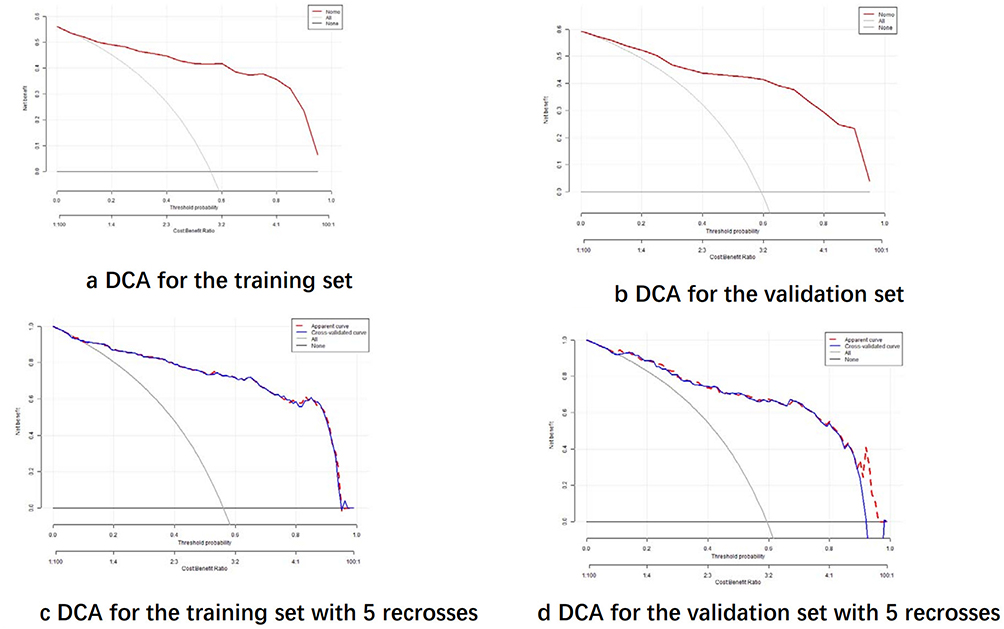 |
Figure 10 Predictive Modelling Clinical Decision Curve Analysis. (a) Illustrates the DCA for the training set, (b) the validation set, (c) the training set after 5 - fold cross - validation, and (d) the validation set after 5 - fold cross - validation. |
Discussion
A study shows that 30% of patients with depressive disorders globally are missed in primary care, mainly due to the lack of cost-effective and objective diagnostic tools.6 Thus, developing a predictive model based on routine blood indicators holds urgent clinical value. In recent years, researchers have explored peripheral blood biomarkers. For instance, Guo et al found serum proteomic features linked to depression severity, but the complex technology hinders promotion3 Ho developed an amino acid metabolite model to distinguish healthy individuals from those with depressive disorders, yet its low AUC of 0.68 limits discrimination.7 Also, Erritzoe et al confirmed that reduced central 5-HT release is associated with depression, but the link between peripheral serotonin levels and central mechanisms remains controversial.8 So, this study, via machine learning algorithms with routine blood indicators, builds a low-cost predictive model for depressive disorders with high clinical application value.
Our study developed a clinical risk prediction model for depressive disorders based on the analysis of seven machine learning algorithms. Among all algorithms, the random forest model demonstrated the best performance, achieving an AUC of 1.00 in the training set and 0.958 in the validation set, indicating exceptional predictive power. Within the random forest model, serotonin was identified as the most significant variable, effectively distinguishing depressive disorder patients from healthy controls.
In recent years, the application of machine learning technologies in the field of biomedicine has shown a rapid expansion trend, demonstrating significant breakthrough potential in critical areas such as clinical diagnosis, precision therapy, and health monitoring. The integration of machine learning algorithms not only enhances diagnostic accuracy but also enables dynamic optimization of treatment strategies based on individual characteristics and environmental factors, thereby achieving true individualized medicine.9 In this study, we employed LASSO regression and the Boruta algorithm for biomarker selection. LASSO regression introduces an L1 regularization penalty to achieve feature sparsity, automatically selecting features with significant contributions to the model. This process effectively reduces model complexity while significantly improving generalization capability and predictive accuracy. Additionally, LASSO regression combines the advantages of subset selection and ridge regression, offering robustness and interpretability, which makes it uniquely suitable for feature selection in high-dimensional data.10 The Boruta algorithm, on the other hand, dynamically adjusts selection thresholds using random shadow features, enabling the identification of weakly correlated but biologically meaningful features.11 It also reduces false-positive rates by dynamically adjusting thresholds through shadow features.12 By incorporating biomarkers commonly identified by both methods into machine learning, this study enhances the reliability and accuracy of biomarker selection.
The random forest algorithm is an ensemble learning technique that achieves classification or regression tasks by constructing multiple decision trees and aggregating their outputs. This algorithm has consistently demonstrated strong discriminatory capabilities across various studies. For example, in a study predicting postpartum depression risk, Dayeon Shin et al employed nine different machine learning algorithms, with the random forest achieving the highest AUC of 0.884.13 Additionally, another study comparing three machine learning algorithms for predicting depression risk in elderly individuals in South Korea found that random forest outperformed others in terms of sensitivity and specificity.14 Compared to these studies, our model, which is based on routine blood test indicators, not only demonstrates superior discriminatory performance but also offers significant advantages in sample accessibility and model practicality.
The logistic regression results revealed that alkaline phosphatase (ALP) and phenylalanine were positively associated with depressive disorders, while serotonin and arginine were negatively associated. We observed that the serum ALP levels in patients with depressive disorders were significantly higher than those in the control group. This finding aligns with several previous studies. For instance, Xi Tao et al reported that ALP levels increased with the severity of depressive symptoms in patients with cerebrovascular disease, particularly in those with vascular depression, where elevated ALP levels were independently associated with the severity of depressive symptoms.15 Furthermore, Liang Y et al, in a cross-sectional study of US adults, demonstrated that even within the normal range, higher ALP levels were significantly associated with an increased risk of depression.16 The serum phenylalanine (Phe) levels in patients with depressive disorders remain a subject of debate. Md. Rabiul Islam et al reported that serum Phe levels were significantly reduced in patients with depressive disorders.17 However, Linssen AM et al suggested that phenylalanine and tyrosine depletion in depressive patients might affect memory consolidation and attention but did not explicitly indicate elevated Phe levels.18 Another study found that while tryptophan concentrations were lower and glutamate levels were higher in depressive patients, the concentrations of Phe and other amino acids did not differ significantly between depressive patients and the control group.19 In contrast, our findings are consistent with those of Ho CSH et al, who also observed elevated Phe levels in patients with depressive disorders.7 The reduction in arginine (Arg) levels may impair vascular endothelial function by decreasing nitric oxide (NO) synthesis. Additionally, it may affect cellular bioenergetics and oxidative stress responses through mechanisms involving neurotransmitter release and regulation, thereby contributing to the development of depressive symptoms and cognitive dysfunction.20 A systematic review further highlighted that, based on subgroup analyses of serum samples, arginine concentrations were lower in patients with depressive disorders compared to healthy controls. Moreover, the review noted that arginine levels could be influenced by concurrent medication use.21 Serotonin (5-HT) is a central focus in depression research, with numerous studies demonstrating that serotonin levels in patients with depression are significantly lower than those in healthy controls.7,22 The serotonin system plays a critical role in the pathogenesis of depression. Depressed patients exhibit reduced neuronal density of serotonin in the brain, and the efficacy of serotonin reuptake inhibitors further underscores its pivotal role in the disorder.23,24 Recent studies have directly assessed serotonin release capacity in the brains of patients with depression. The findings revealed that patients with major depressive episodes (MDE) exhibit significantly lower serotonin release capacity compared to healthy individuals, providing clear evidence of serotonin dysfunction in depression.22
In this study, we analyzed independent risk factors in the blood indicators of patients with depressive disorders and developed a visualized nomogram model based on these findings. The model demonstrated high predictive value in terms of discrimination, calibration, and clinical utility. This study, based on routine blood indicators, offers a cost-effective alternative to imaging techniques, making it suitable for promotion in resource-limited regions. The constructed nomogram, which visualizes risk scores, serves as an objective diagnostic tool to assist primary healthcare institutions in risk screening and helps non-psychiatrists quickly identify potential patients. However, the study has limitations: the data were sourced from a single center, and the sample size was relatively small, which may introduce selection bias. To further validate the model’s effectiveness, future research will collect data from external medical institutions for external validation to better assess model performance.
In summary, this study, based on routine blood indicators and machine learning algorithms, has successfully constructed a clinical risk prediction model for depressive disorders. The model, for the first time, integrates liver function indicators and amino acid indicators to create a low - cost, high - precision diagnostic tool, breaking free from the current technical reliance on imaging or complex omics. Through risk stratification via a nomogram, the model can assist primary care physicians in quickly identifying high - risk groups, reducing missed diagnoses and optimizing the allocation of medical resources. However, the study is limited by single - center data and issues related to assay standardization. Future work should involve multicenter external validation to further enhance the clinical applicability of the model.
Acknowledgments
Weifeng Jin, Shuzi Chen and MengXia Wang are co-first authors for this study. We would like to express our gratitude to Ms. Jingyi Huang for her assistance in polishing the English text.
Funding
1.Shanghai Jiao Tong University “Star of Jiao Tong University” Programme Medical-Industrial Interdisciplinary Research Fund YG2024LC12. 2.National Medical Centre Health Commission of China, Reference intervals of 15 structural proteins and their significance for clinical diagnosis of cerebral cognitive impairment diseases,WZZ20230201 3.2024 Shanghai Municipal Health Commission Medical New Technology Research and Transformation Seed Program, Establishment and Application Transformation of Key Technology System for Precise Diagnosis of Cognitive Impairment in the Elderly, 2024ZZ1032 4.2022 hospital - level Project of Shanghai Mental Health Center, Composition of Gut Microbiota in Adolescents with First - episode Depression, 2022-YJ11.
Disclosure
The authors report no conflicts of interest in this work.
References
1. Santomauro DF, Mantilla Herrera AM, Shadid J, COVID-19 Mental Disorders Collaborators. Global prevalence and burden of depressive and anxiety disorders in 204 countries and territories in 2020 due to the COVID-19 pandemic. Lancet. 2021;398(10312):1700–1712. doi:10.1016/S0140-6736(21)02143-7
2. Nobis A, Zalewski D, Waszkiewicz N. Peripheral markers of depression. J Clin Med. 2020;9:3793.
3. Guo A, Wang B, Ding J, et al. Serum proteomic analysis uncovers novel serum biomarkers for depression. Front Psychiatry. 2024;15:1346151. doi:10.3389/fpsyt.2024.1346151
4. Sun X, Xu Y, Zhao Y, Zheng X, Zheng Y, Cui L. Multi-granularity graph convolution network for major depressive disorder recognition. IEEE Trans Neural Syst Rehabil Eng. 2024;32:559–569. doi:10.1109/TNSRE.2023.3311458
5. Shimizu Y, Yoshimoto J, Toki S, et al. Toward probabilistic diagnosis and understanding of depression based on functional MRI data analysis with logistic group LASSO. PLoS One. 2015;10(5):e0123524. doi:10.1371/journal.pone.0123524
6. Patel V, Saxena S. Transforming lives, enhancing communities--innovations in global mental health. N Engl J Med. 2014;370(6):498–501. doi:10.1056/NEJMp1315214
7. Ho CSH, Tay GWN, Wee HN, Ching J. The utility of amino acid metabolites in the diagnosis of major depressive disorder and correlations with depression severity. Int J Mol Sci. 2023;24(3):2231. doi:10.3390/ijms24032231
8. Sanchez SM, Tsuchiyagaitoa A, Rayus K, et al. Repetitive negative thinking–specific and –nonspecific white matter tracts engaged by historical psychosurgical targets for depression. Biol Psychiatry. 2023;94(8):661–671. doi:10.1016/j.biopsych.2023.03.012
9. Goecks J, Jalili V, Heiser LM, Gray JW. How machine learning will transform biomedicine. Cell. 2020;181(1):92–101. doi:10.1016/j.cell.2020.03.022
10. Tibshirani R. Regression shrinkage and selection via the lasso. J R Stat Soc Ser B Methodol. 1996;58:267–288. doi:10.1111/j.2517-6161.1996.tb02080.x
11. Degenhardt F, Seifert S, Szymczak S. Evaluation of variable selection methods for random forests and omics data sets. Brief Bioinform. 2019;20(2):492–503. doi:10.1093/bib/bbx124
12. Maliuk AS, Ahmad Z, Kim J-M. Hybrid feature selection framework for bearing fault diagnosis based on wrapper-WPT. Machines. 2022;10(12):1204. doi:10.3390/machines10121204
13. Shin D, Lee KJ, Adeluwa T, Hur J. Machine learning-based predictive modeling of postpartum depression. J Clin Med. 2020;9(9):2899. doi:10.3390/jcm9092899
14. Byeon H. Predicting the depression of the South Korean elderly using SMOTE and an imbalanced binary dataset. Int J Adv Comput Sci Appl. 2021;12.
15. Tao X, Yang C, He J, et al. Serum alkaline phosphatase was independently associated with depression in patients with cerebrovascular disease. Front Psychiatry. 2023;14:1184673. doi:10.3389/fpsyt.2023.1184673
16. Liang Y, Mao Y, Liang W, et al. Association of serum alkaline phosphatase and depression in US adults: a population-based cross-sectional study. Front Psychiatry. 2023;14:1131105. doi:10.3389/fpsyt.2023.1131105
17. Islam MR, Ali S, Karmoker JR, et al. Evaluation of serum amino acids and non-enzymatic antioxidants in drug-naïve first-episode major depressive disorder. BMC Psychiatry. 2020;20(1):333. doi:10.1186/s12888-020-02738-2
18. Linssen AM, Riedel WJ, Sambeth A. Effects of tyrosine/phenylalanine depletion on electrophysiological correlates of memory in healthy volunteers. J Psychopharmacol. 2011;25(2):230–238. doi:10.1177/0269881109348160
19. Miki T, Eguchi M, Kochi T, et al. Prospective study on the association between serum amino acid profiles and depressive symptoms among the Japanese working population. PLoS One. 2021;16(8):e0256337. doi:10.1371/journal.pone.0256337
20. Hess S, Baker G, Gyenes G, Tsuyuki R, Newman S, Le Melledo JM. Decreased serum L-arginine and L-citrulline levels in major depression. Psychopharmacology. 2017;234(21):3241–3247. doi:10.1007/s00213-017-4712-8
21. Fan M, Gao X, Li L, et al. The association between concentrations of arginine, ornithine, citrulline and major depressive disorder: a meta-analysis. Front Psychiatry. 2021;12:686973. doi:10.3389/fpsyt.2021.686973
22. Erritzoe D, Godlewska BR, Rizzo G, et al. Brain serotonin release is reduced in patients with depression: a [11C]cimbi-36 positron emission tomography study with a d-amphetamine challenge. Biol Psychiatry. 2023;93(12):1089–1098.
23. Mayegowda SB, Rao BV, Rao BS. Escitalopram treatment ameliorates chronic immobilization stress-induced depressive behavior and cognitive deficits by modulating BDNF expression in the hippocampus. J Appl Pharm Sci. 2024;14(03):170–182.
24. Liu Z, Yu S, Hu Y, et al. Efficacy and safety of repeated transcranial magnetic stimulation combined with escitalopram in the treatment of major depressive disorder: a meta-analysis. Front Psychiatry. 2024;14:1275839. doi:10.3389/fpsyt.2023.1275839
 © 2025 The Author(s). This work is published and licensed by Dove Medical Press Limited. The
full terms of this license are available at https://www.dovepress.com/terms
and incorporate the Creative Commons Attribution
- Non Commercial (unported, 4.0) License.
By accessing the work you hereby accept the Terms. Non-commercial uses of the work are permitted
without any further permission from Dove Medical Press Limited, provided the work is properly
attributed. For permission for commercial use of this work, please see paragraphs 4.2 and 5 of our Terms.
© 2025 The Author(s). This work is published and licensed by Dove Medical Press Limited. The
full terms of this license are available at https://www.dovepress.com/terms
and incorporate the Creative Commons Attribution
- Non Commercial (unported, 4.0) License.
By accessing the work you hereby accept the Terms. Non-commercial uses of the work are permitted
without any further permission from Dove Medical Press Limited, provided the work is properly
attributed. For permission for commercial use of this work, please see paragraphs 4.2 and 5 of our Terms.