Back to Journals » Patient Preference and Adherence » Volume 14
A Brief Metric Framework for Patient Adherence to Doctor’s Advice Based on Behavioral Economics
Received 19 August 2019
Accepted for publication 19 January 2020
Published 25 February 2020 Volume 2020:14 Pages 371—381
DOI https://doi.org/10.2147/PPA.S227829
Checked for plagiarism Yes
Review by Single anonymous peer review
Peer reviewer comments 2
Editor who approved publication: Dr Naifeng Liu
Senlin Lin, 1, 2,* Yingyan Ma, 1, 2,* Haidong Zou 1, 2
1Department of Eye Disease Prevention, Shanghai Eye Disease Prevention and Treatment Center, Shanghai Eye Hospital, Shanghai 200010, People’s Republic of China; 2Shanghai General Hospital, National Clinical Research Center for Eye Diseases, Shanghai Key Laboratory of Ocular Fundus Diseases, Shanghai Engineering Center for Visual Science and Photomedicine, Shanghai Engineering Center for Precise Diagnosis and Treatment of Eye Diseases, Shanghai 200000, People’s Republic of China
*These authors contributed equally to this work
Correspondence: Haidong Zou
Department of Eye Disease Prevention, Shanghai Eye Disease Prevention and Treatment Center, Shanghai Eye Hospital, No. 380 Kang Ding Road, Shanghai 200010, People’s Republic of China
Tel +86 133 1198 6528
Email [email protected]
Purpose: This study tried to establish a metric framework of patient adherence to doctor’s advice based on the expected utility and prospect theories, and it explained why the key to patient adherence to doctor’s advice is patients’ perceptions.
Methods: Our framework is primarily based on two mature theories: expected utility theory and prospect theory. We started with a basic assumption: the doctor is rational and cares for patient’s health utility. We analyzed the expected utility of therapy with a definite diagnosis. Then, we considered the impacts of the accuracy of diagnostic techniques. After that, we explored the patient’s response to the doctors’ advices based on behavioral economics. In addition, we launched a discrete choice experiment to test our main point: perception is the key to patients’ adherence. A total of 200 undergraduate students participated in the discrete choice experiment.
Results: Three main factors might impact a rational clinical decision: the therapeutic and side effects of the treatment, patient’s true disease risk, and diagnostic accuracy. However, another factor, patient’s individual percepion, was crucial for patient’s adherence since it may bias the patient’s estimations regarding the above three factors. As a result, doctors and patients would have a cognitive gap in the estimation of the disease and the treatment.
Conclusion: The results indicate that without the necessary information, better clinical techniques may not help to improve patient adherence, which support our theoretical reasoning forcefully. Therefore, improving patient adherence should be more of a process of empathy and communication rather than a promotion of medical technology.
Keywords: patient adherence, behavioral economics, discrete choice experiment
Introduction
Patient adherence is one of the most important factors impacting treatment outcomes.1–6 Many studies regard patient adherence to be a preventive factor of clinical outcomes,4,7 and consider non-adherence to be a risk factor.4 In addition, several studies have assessed interventions to strengthen patient adherence,8,9 including home-based healthcare services,10 health education,11 shared decision-making,11 and monitoring.3,11,12
However, the practice of these interventions to increase patient adherence is always based on experiences,2,6,8,9,13,14 and a special theoretical mechanistic framework is absent.14 Although the Morisky Medication Adherence Scale is widely used for adherence measurement, it remains a challenge to explain some basic questions, such as why monitoring helps to improve patient adherence,3,11,12 and whether all types of monitoring are effective.15
As far as we know, the most commonly used model for interpreting the patients’ healthcare service utilization is Andersen’s Behavioral Model. It is a very comprehensive model that covers almost everything from health service delivery, healthcare service needs, patient belief, cost, etc. However, this model does not pay attention to the difference between doctors’ and patients’ perceptions of the disease. Therefore, it is insufficient to be used for explaining patient adherence.
Our study aims to establish a metric framework of patient adherence based on the expected utility and prospect theories, and we will explain why the key to patient adherence is patients’ perceptions. In addition, we launched a discrete choice experiment (DCE) to test our inference.
Materials and Methods
Metric Framework Establishment
Our framework is primarily based on two mature theories: expected utility theory and prospect theory. We started with a basic assumption: the doctor is rational and cares for patient’s health utility. We analyzed the expected utility of therapy with a definite diagnosis. Then, we further considered the impacts of the accuracy of diagnostic techniques on the expected utility. On this basis, we indicated the necessary conditions for a rational therapy. After that, we explored the patient’s response to the doctors’ advices based on the prospect theory and pointed out the theoretical explanation of patient adherence. Finally, we summarized the derivation process and established the brief framework.
Discrete Choice Experiment
In order to test our main inference from the metric framework, we launched a discrete choice experiment (DCE) via a web-based survey. The main hypothesis was H0: Patient’s adherence is stable and independent of his/her perception of the clinical information; H1: Patient’s adherence changes along with his/her perception of the clinical information. Therefore, we have two criteria for disease selection: 1) The disease should be common to ensure the universality of the results and 2) The disease diagnosis and treatment technology should be unfamiliar with the public in order to limit the participants’ perceptions being mainly based on the information provided by the experiment. Thus, glaucoma was chosen in our DCE. We set up a virtual scene for the people surveyed: “Recently, you’ve always felt uncomfortable with your eyes and blurred. Therefore, you went to the hospital where you used to go. In the hospital, you were diagnosed with glaucoma.” Then, we asked them whether they would follow the doctor’s advice under eight different situations separately. These situations were some combinations of seven different features by orthogonal design (Table 1). It should be noted that whether Test1 and Test2 have different impacts on the participants’ choices is the key point of our DCE. Since static perimetry is more accurate than intraocular pressure in practice, Test1 can be seen as a blinded version of Test2. In other words, the feature Test1 only provided the technical name but lacked the necessary medical information, while feature Test2 provided medical information that enhanced the participants’ perceptions. Therefore, if Test1 and Test2 have different impacts on participants’ choices, it should be suggested that the difference is due to the participants’ perceptions. Conditional Logit model with dummy coding was used for analyzing the DCE data.
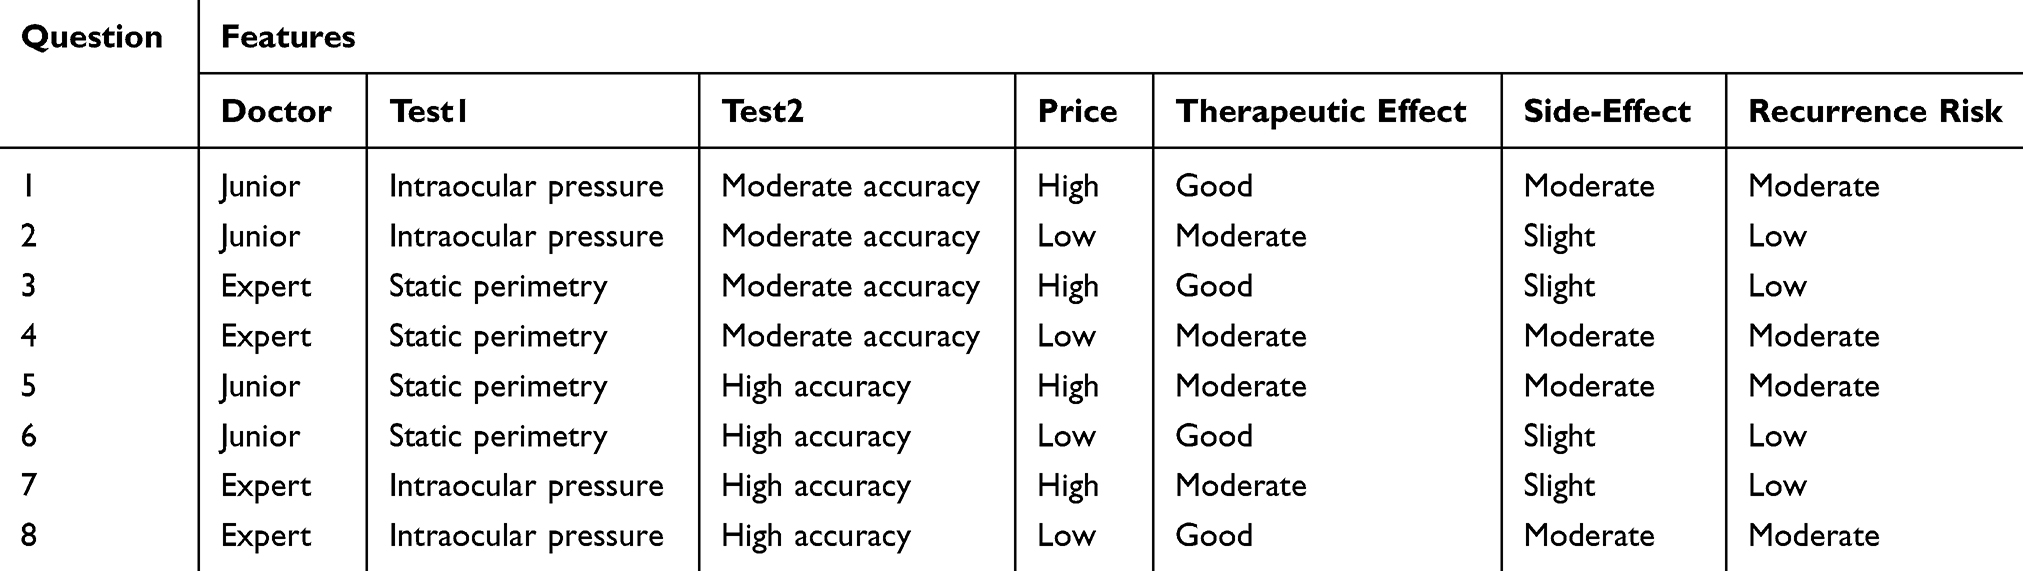 |
Table 1 Different Situations in Discrete Choice Experiment |
All statistical analyses were performed using SAS 9.4 (SAS Institute, Inc, Cary, NC, USA), and Microsoft Excel2016 was used for creating figures.
Ethics
The study was approved by the Shanghai General Hospital Ethics committee (No. 2018KY036) and adhered to the tenets of the Declaration of Helsinki. The potential participants were sent an e-questionnaire via WeChat (a social APP), including the general information about the DCE (such as the purpose, the design, and the privacy protection). They were also explicitly informed that they have the right to participate or refuse.
Results
Metric Framework Establishment
Expected Utility of the Doctor’s Advice Based on the True Risk of Disease
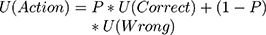
One basic question in clinical settings is whether further therapy (diagnosis or treatment) will benefit the patient. We, therefore, set the accuracy of an action as P and the utility change caused by the correct Action as U(Correct); the error rate, therefore, is 1-P. Similarly, we set the utility change caused by the wrong Action as U(Wrong). Therefore, according to the expected utility theory, the expected utility of the Action is
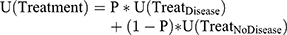
Now, assuming patient’s true disease risk is P, the accuracy of the treatment will also be P (Figure 1). Therefore, the expected utility of the doctor’s advice can be more specifically expressed as two separate equations:

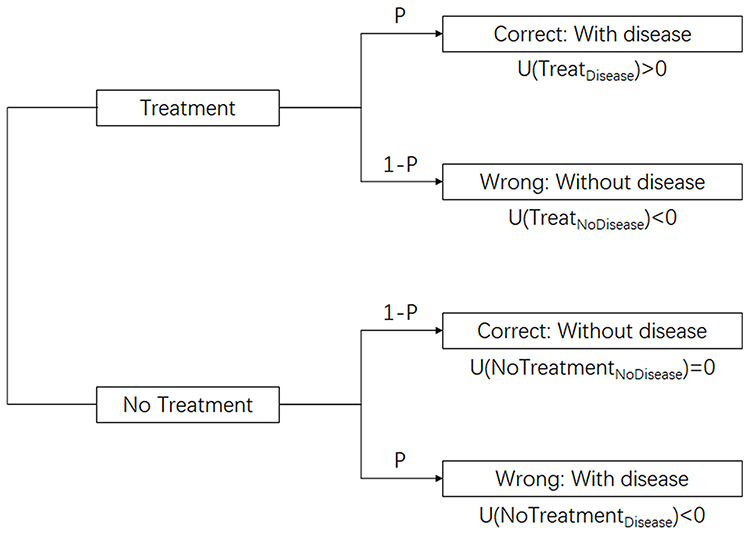 |
Figure 1 Expected utility of a doctor’s advice to a patient with a true disease risk of P. Abbreviations: P, probability of disease; U, utility. |
Expected Utility of the Doctor’s Advice Based on the Diagnostic Results
Furthermore, most diagnostic tests in practice do not provide perfectly accurate diagnoses. Supposing that the diagnostic test’s sensitivity (S) and specificity (Sp) are known, the probabilities of each diagnostic result are shown in Table 2.
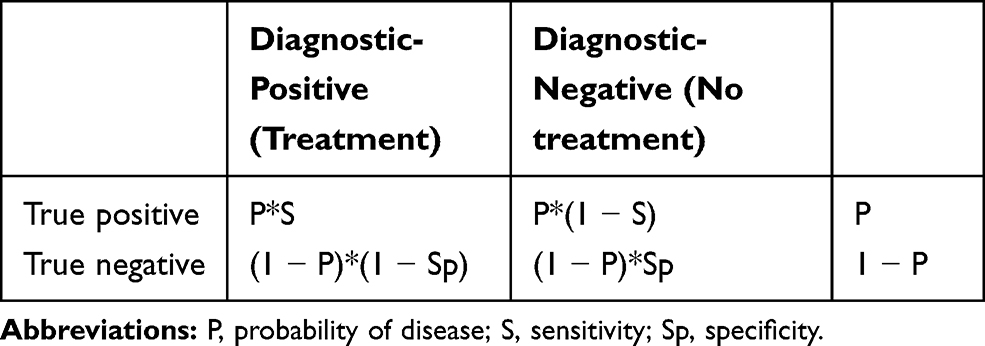 |
Table 2 The Probabilities of Each Diagnostic Result |
Since the doctor’s advice is based on these diagnostic results, the expected utility of the doctor’s advice could be rewritten as
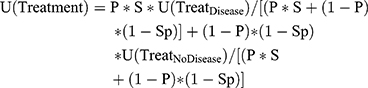
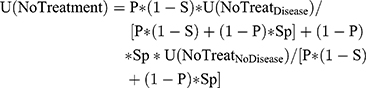
Now, let us examine the U(Treatment) equation. If U(Treatment) of Therapy A is greater than 0, then Therapy A will result in a positive net benefit to the patient. Therefore, the doctor may advise the patient to receive treatment A. However, if the U(Treatment) is less than 0, then Therapy A will result in a negative net benefit to the patient. Therefore, doctor will not advise Therapy A, but will instead recommend Therapy B provided its U(Treatment) is greater than 0.
The above is the metric explanation of the doctor’s diagnosis and treatment process based on the expected utility theory. To summarize: doctors will try their best to find a therapy with the maximum value of U(Treatment) (U(Treatment) must be higher than 0).
Next, we examine which therapies may meet the condition of U(Treatment)>0:


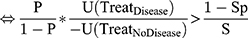

Similarly, the conditions in which the therapy is not likely to be recommended is

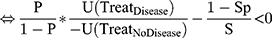
Therefore, we can set the Therapy Coefficient (TC) as
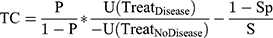
where U(TreatDisease)>0 and U(TreatNoDisease)<0
Because U(Treatment) is an estimation of both the objective therapeutic effects and the side effects (including not only adverse reactions but also poverty caused by therapy, discrimination, and other harm in general), U(TreatDisease) and U(TreatNoDisease) can be written as:
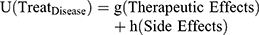
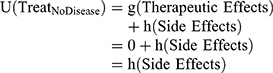
where g(Therapeutic Effects)>0 and h(Side Effects)<0
Therefore,

where g(Therapeutic Effects)>0 and h(Side Effects)<0
Again, in most cases, doctors will find a therapy with a TC>0.
Prospect Theory and Patient Adherence
We next examine a patient’s decision process when he or she is advised to receive a therapy. It is almost impossible for an ordinary patient to obtain the complete information on all the parameters in the TC as a doctor can. Therefore, the patient may estimate these parameters according to his/her own perceptions (including experiences, feelings, and knowledges), often resulting in a biased TC, or TCb:
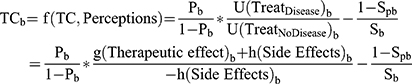
where g(Therapeutic Effects)b>0 and h(Side Effects)b<0
TCb conforms to the prospect theory.16 The main differences between the classical economics and prospect theories16 as well as some important impacts caused by these differences on patient adherence are shown in Figures 2–8. It should be noted that a patient would only follow the advice with a TCb>0, just like his/her doctor would only give the advices with TC>0.
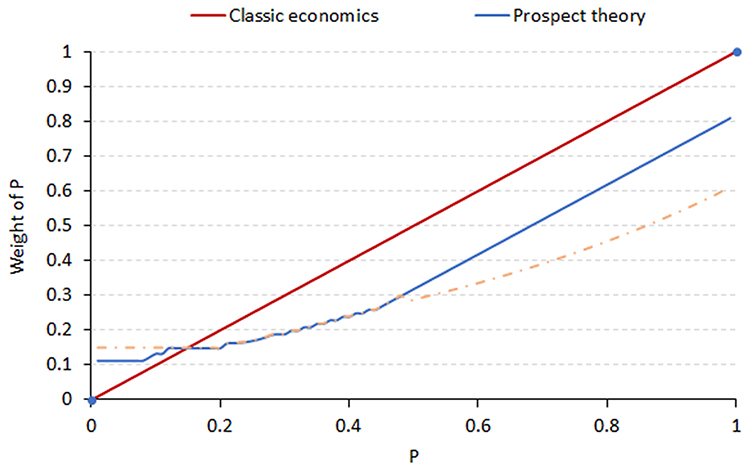 |
Figure 2 Differences in the weight of probability P between the classical economics and prospect theories. Notes: In the classical economics theory, the weight of probability P is equal to the P value (red line); however, in the prospect theory, if the P is slight (assume 0), the weight will be higher than the P in value (blue or yellow lines); however, if P is large (assume 100%), the weight will be lower than the P value (blue or yellow lines). It should be noted that the curve of the weight of P according to the prospect theory is not unique. The curves are suitable for the patient’s estimation of true disease risk, diagnostic sensitivity, and diagnostic specificity. Abbreviation: P, probability of disease. |
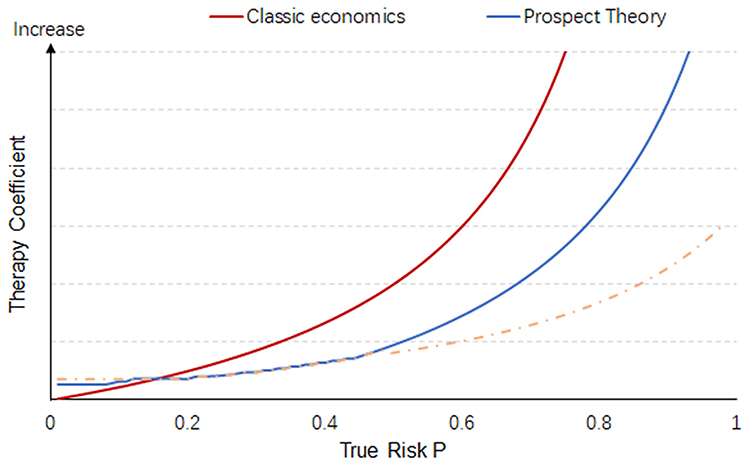 |
Figure 3 Differences in therapy coefficients with increasing disease risk between the classical economics and prospect theories. Notes: Because of the differences shown in Figure 3, the difference in the weight of P will cause a bias from TC to TCb. Assuming the other parameters are the same between TC and TCb, the difference in the weight of P will cause a dramatic decrease from TC (red line) to TCb (blue or yellow lines) if P is large (assume 100%); it will also cause an increase from TC to TCb if P is small (assume 0). Therefore, an ordinary patient may disregard the recommended therapy if they are diagnosed with a common disease; at the same time, they may be too worried about the diagnosis of a rare disease. Abbreviations: P, probability of disease; TC, therapy coefficient; TCb, biased therapy coefficient. |
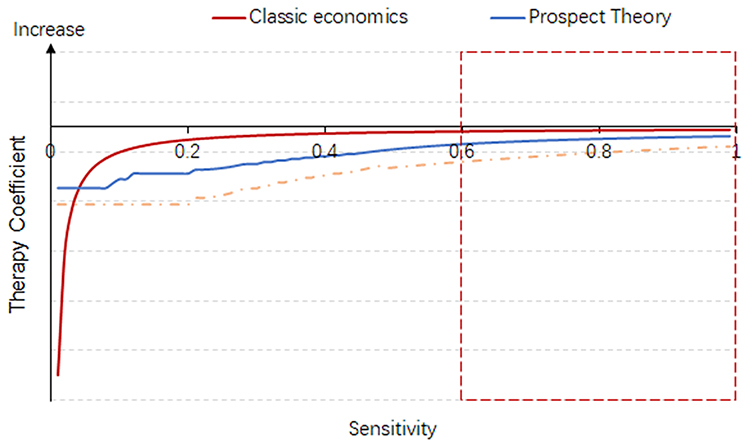 |
Figure 4 Differences in therapy coefficients with increasing diagnostic sensitivity between classical economics and prospect theories (assuming a fixed diagnostic specificity of 0.9). Notes: Because of the difference shown in Figure 3, differences in the weight of P will cause a bias from TC to TCb. In clinical practice, diagnostic tests have moderate to high accuracy; therefore, we focus only on the right part of the curves (for example, where the sensitivity is greater than 0.6, the red dotted box in the Figure). Assuming the other parameters are the same between in TC and in TCb, an increase in diagnostic sensitivity will cause an increase in the TC (red line) and TCb (blue or yellow lines). It should be noted that the gap between the TC and TCb is highly associated with the gap in the weight of the sensitivity. Therefore, an increase in diagnostic sensitivity alone may not improve patient adherence. In extreme cases, if a doctor has been informed of an increase in sensitivity while the patient remains unaware, the gap will increase and patient adherence may decrease. Abbreviations: P, probability of disease; TC, therapy coefficient; TCb, biased therapy coefficient. |
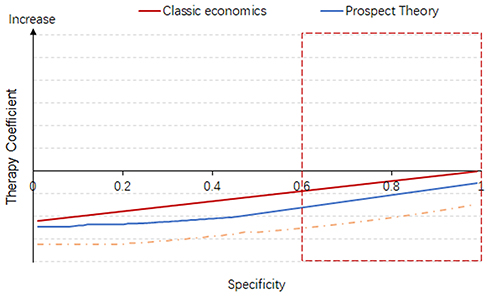 |
Figure 5 Differences in therapy coefficients with increasing diagnostic specificity between the classical economics and prospect theories (assuming a fixed diagnostic sensitivity of 0.9). Notes: Since in clinical practice, diagnostic tests generally have moderate to high accuracy, we focus only on the right part of the curves (for example, specificity above than 0.6, the red dotted box in the Figure). Similar to the increase in diagnostic sensitivity, assuming that the other parameters are the same between TC and in TCb, an increase in diagnostic specificity may cause an increase in TC (red line) and TCb (blue or yellow lines). The gap is also associated with a gap in the weight of the specificity. Therefore, an increase in diagnostic specificity alone may not help to improve patient adherence. In extreme cases, if a doctor has been informed of the increase while the patient has not, the gap will increase and patient adherence may decrease. Abbreviations: P, probability of disease; TC, therapy coefficient; TCb, biased therapy coefficient. |
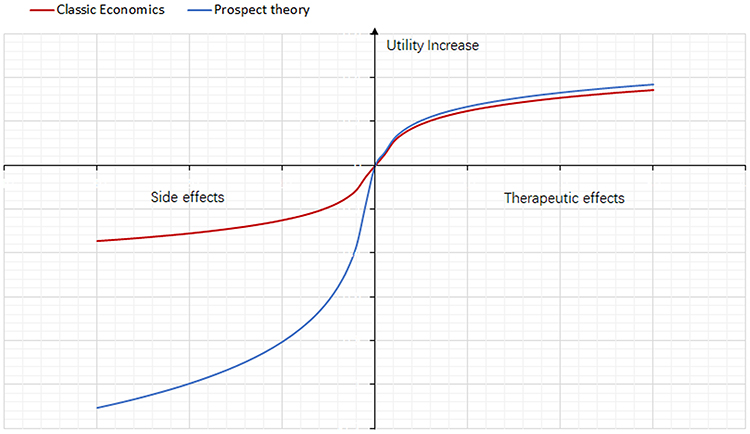 |
Figure 6 Differences in treatment utility between the classical economics and prospect theories. Notes: According to the classical economics theory, the absolute value of the utility increase caused by the therapeutic effects is equal to the absolute value of the utility decrease caused by side effects. However, in the prospect theory, the absolute value of the utility increase caused by the therapeutic effects is much lower than the absolute value of the utility decrease caused by the side effects. Therefore, side effects may have more impact on TCb. Abbreviation: TCb, biased therapy coefficient. |
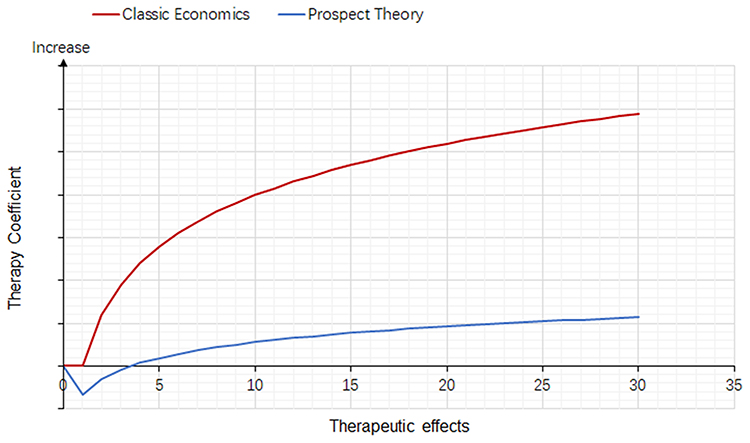 |
Figure 7 Trends in therapy coefficients with increasing therapeutic effects (assuming the side effect of the therapy is always one unit). Notes: According to the classical economics theory, increasing therapeutic effects will cause a dramatic increase in the therapy coefficient (red line), while increase is much lower in the prospect theory (blue line). Therefore, doctors should understand that their patients may not be as excited about advanced therapy as they are. |
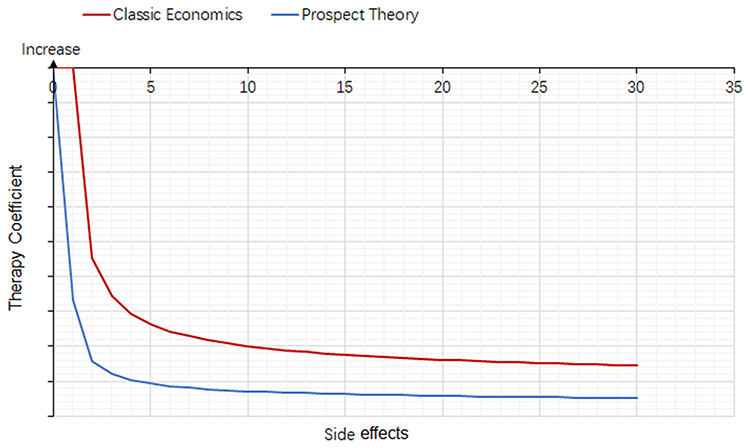 |
Figure 8 Trend in the therapy coefficient with increasing side effects (assuming a therapeutic effect of one unit). Notes: According to both classic theories, increased side effects will cause a decrease in the therapy coefficient (red and blue lines); however, the degree of decrease is larger in the prospect theory (blue line). Therefore, doctors should understand that their patients may be excessively concerned about the side effects of the therapy. |
Hence, the framework of patient adherence is
- When TCb is close to TC, the patient may follow the doctor’s advice.
- When TCb is much larger than TC, the patient may not only receive the advised therapy but may also seek additional, unnecessary therapies.
- When TCb is much smaller than TC, the patient may refuse the doctor’s advice and stop the necessary therapy, which is the most common situation in clinical practice.
- Brief explanations of the framework
From the composition of TC, three main aspects will affect the doctor’s advice:
- The therapeutic and side effects of the treatment:
- Both therapeutic and side effects will be considered.
- If the therapeutic effects increase, the TC will also increase, indicating that doctor will tend to recommend the therapy.
- If the side effects increase, the TC will get smaller, indicating that the doctor will not tend to recommend the therapy.
- Both therapeutic and side effects will be considered.
- True disease risk:
- If the true disease risk increases, the TC will get larger, indicating that the doctor will tend to recommend the therapy.
- Diagnostic accuracy:
- If the diagnostic techniques and processes are improved (the specificity and sensitivity increase), the TC will also increase, indicating that therapy based on the diagnostic results will be more worthwhile.
Furthermore, from the composition of TCb, it should be noted that a patient’s individual perception is the unique factor influencing patient adherence, because it determines the gap between TCb and TC:
- If the patient’s individual perceptions are adequate and correct, their TCb will be close to TC, indicating they will follow the doctors’ advice.
- If the patient’s individual perceptions are inadequate or incorrect, the TCb will differ greatly from the TC.
- If the TCb is much higher than the TC, the patient may blindly pursue excessive and unnecessary therapies.
- If the TCb is much lower than the TC, the patient will refuse the doctor’s advice.
- It should be highlighted that the improvement of medical diagnosis and treatment technology alone, without informing the patient, may cause non-adherence because the gap between the estimation of the parameters in TC and those in TCb will increase.
Discrete Choice Experiment Results
Total of 200 undergraduate students participated in the discrete choice experiment, among whom 49.5% were male and 50.5% were female. Thirty-four percent of the students’ majorities were medicine, and the left 66% studied other subjects.
According to DCE, when the participants were diagnosed as glaucoma, whether they would follow the doctors’ advice might be impacted by the type of doctor (Expert vs Junior doctor), test with accuracy announcement (high accuracy test vs moderate accuracy test), price (low vs high), therapeutic effect (good vs moderate), side-effect (slight vs moderate), and recurrence risk (low risk vs moderate risk). However, test without accuracy announcement (static perimetry vs intraocular pressure) had no impacts, though in fact, static perimetry is more accurate than intraocular pressure. The detailed information has been shown in Figure 9. It should be highlighted that the use of advanced diagnostic techniques would not improve patient compliance unless the patient was clearly informed that the diagnosis originated from a higher accuracy test.
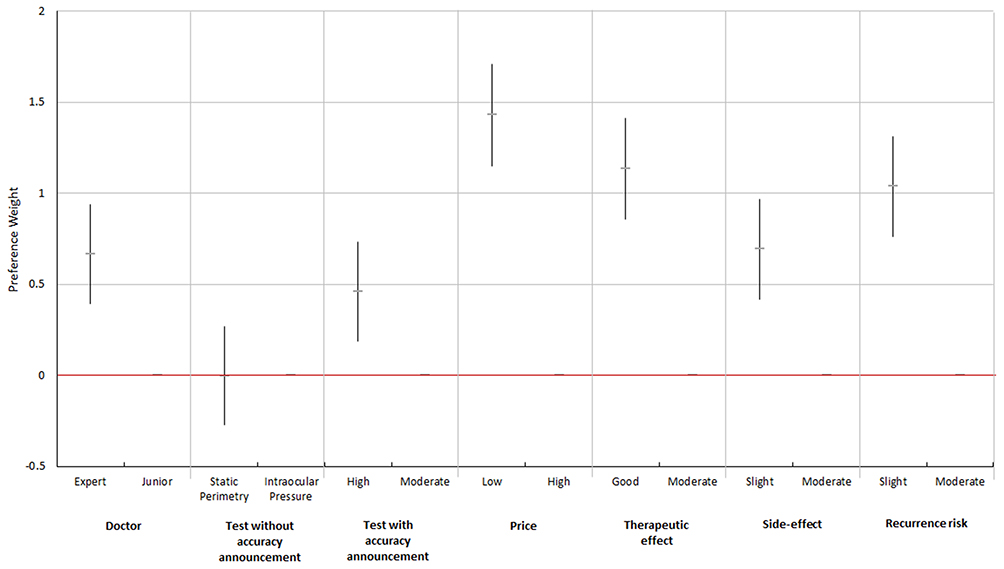 |
Figure 9 Preference weight of patient adherence for the conditional logit model (dummy-coded). |
Discussion
In this study, we have established an original metric framework to find the impacting factors of patients’ adherences. At the beginning, we explore what factors may impact a rational clinical decision, and we find that there are three main factors: the therapeutic and side effects of the treatment, patient’s true disease risk, and diagnostic accuracy. Then, we examined what factors may impact the patient’s decision on whether to accept the rational advices. Inevitably, the three factors above have some impacts, while another factor, patient’s individual perception, is crucial since it may bias the patient’s estimations regarding the three factors. As a result, doctors and patients will have a cognitive gap in the estimation of the disease and the treatment. Only when the gap is narrow does the patient follow the doctor’s advice; Otherwise, the patient will overuse or underuse the healthcare services. In addition to theoretical deduction, we have launched a DCE to test our main point: perception is the key of patients’ adherence. The DCE results indicate that without the necessary information, better clinical techniques may not help to improve patient adherence, which support our theoretical reasoning forcefully.
It should be noticed that perception here is a broad concept, but not limits to formal health knowledge. In fact, according to our framework, what we call perception is the patient’s subjective views of the therapeutic and side effects of the treatment, his/her own true disease risk, and diagnostic accuracy. Just as one study has reported: The most important barriers impacting patients’ adherence to doctors’ advices were patient experiences and lay beliefs of their conditions.17 From the DCE in our study, we can find that even a piece of simple clinical information, “Test A is better than Test B”, may impact the patient adherence dramatically.
Our study is consistent with the experts’ opinions in shared decision-making (SDM), which aims to improve the quality of health decisions by taking both the physicians’ and the patients’ opinions into account. The International Patient Decision Aid Standards (IPDAS) is one of the most important criteria for information communication in SDM, which is obtained via a two-stage evidence-informed Delphi consensus process.18 According to this criteria, patient’s health condition, benefits and negative features of the therapy, probability of positive/negative outcomes, and test sensitivity and specificity are all needed in the decision-making process.18 Our study provides a theoretical explanation to these expert opinions based on the behavioral economics of why the information above is important for patient’s choice and behavior.
Therefore, though only glaucoma was tested in our study for validation, our inference may be universal, but not limited to a particular disease. Several other studies have also confirmed our inference. For example, one study among the tuberculosis patients in Gambia has suggested that the treatment defaulting rate was higher among those who were uncertain about the therapeutic effect in the first 90 days of treatment.19 When it comes to chronic diseases, one cross-sectional questionnaire survey among the elderly with hypertension has successfully tested the effects of perceptions of illness and burden relate to medication adherence.20 Another study among breast cancer patients indicated that patients’ negative expectations would increase the risk of non-adherence.9
Our framework is quite different with the previous healthcare service utilization model, such as Andersen’s model, due to different aims. The Andersen’s model aims to improve the healthcare service utilization in a wide region, so it is a comprehensive macro model including many socioeconomic factors; while our framework focuses more on individual behavior and aims to improve the individual adherence. Though in Andersen’s model, perception is also mentioned as a factor affecting the utilization, Anderson’s model does neither explain in detail why and how perception works nor give suggestions to strengthen patients’ perception. However, we have suggested that the gap of the perceptions about 1) The therapeutic and side effects of the treatment, 2) True disease risk, and 3) Diagnostic accuracy between the doctors and their patients is the main cause of nonadherence.
The most limitation of the model is we assume doctors are totally rational and make advices merely based on patients’ utility. This assumption is a basic model for explaining doctors’ behaviors, though it is not perfect. Doctors may be misguided by their own knowledge, experience, preference, and expectation. However, advanced behavioral economics models will make our framework too complicated to be focused; therefore, in this study, we still use this idealized assumption. Another limitation of this study is that we only included undergraduate students in the DCE since the subjects should have adequate reading and comprehension ability. However, the real patients’ average education level may not be so high. Therefore, an additional study may be needed to confirm whether the patient’s education level would influence the preferences dramatically.
Conclusion
In conclusion, from our framework, we suggest doctors remember that an ordinary patient is not rational but “bounded rational” with limited health knowledge. Therefore, improving patient adherence should be more of a process of empathy and communication rather than a promotion of medical technology. Just as one report has mentioned: “A client-centered approach is the most important component of a health coaching skill set.”21 We suggest the interventions below should be taken into account to improve adherence, including establishing doctor authority, shared decision-making, health education, explanations of the therapy, monitoring, strengthening social support (both financial and emotional), eliminating discrimination, improving therapeutic effect, reducing adverse reactions, and simplifying the treatment process and decreasing the duration.
Acknowledgments
This study was funded by Chinese National Nature Science Foundation (Project numbers 81670898, 81800881); The Chronic Diseases Prevention and Treatment Project of Shanghai Shen Kang Hospital Development Centre (Grant No. SHDC12015315); The Shanghai Three Year Public Health Action Program (Project No.GWIV-3.3); The Shanghai High-level Oversea Training Team Program on Eye Public Health (Project No.GWTD2015S08); The Shanghai Outstanding Academic Leader Program (Project No.16XD1402300); The Science and Technology Commission of Shanghai Municipality (Project No. 17511107901); Shanghai Municipal Education Commission—Gaofeng Clinical Medicine Grant Support (Project No. 20172022); Foundation of Shanghai Municipal Commission of Health and Family Planning (20184Y0217); National Key R&D Program of China (2016YFC0904800, 2019YFC0840607); National Science and Technology Major Project of China (2017ZX09304010); Shanghai Sailing Program (17YF1415400); and the Shanghai Songjiang Science Foundation (No. 19SJKJGG30).
Disclosure
The authors report no conflicts of interest in this work.
References
1. Radha R, Boulware David R. HIV care: ART adherence support and cryptococcal screening. Lancet. 2015;385:2128–2129. doi:10.1016/S0140-6736(15)60455-X
2. de Vries Sophia G, Cremers Anne L, Heuvelings Charlotte C, et al. Barriers and facilitators to the uptake of tuberculosis diagnostic and treatment services by hard-to-reach populations in countries of low and medium tuberculosis incidence: a systematic review of qualitative literature. Lancet Infect Dis. 2017;17:e128–e143. doi:10.1016/S1473-3099(16)30531-X
3. Runowicz Carolyn D, Leach Corinne R, Lynn. HN, et al. American Cancer Society/American Society of Clinical Oncology breast cancer survivorship care guideline. J Clin Oncol. 2016;34:611–635. doi:10.1200/JCO.2015.64.3809
4. Simpson Scot H, Eurich Dean T, Majumdar Sumit R, et al. A meta-analysis of the association between adherence to drug therapy and mortality. BMJ. 2006;333:15. doi:10.1136/bmj.38875.675486.55
5. Mills Edward J, Nachega Jean B, Iain B, et al. Adherence to antiretroviral therapy in sub-Saharan Africa and North America: a meta-analysis. JAMA. 2006;296:679–690. doi:10.1001/jama.296.6.679
6. AIDS Education & Training Center Program. Non-adherence to treatment regimen by adolescents with HIV: a legal guide for clinicians. Available from: https://aidsetc.org/resource/non-adherence-treatment-regimen-adolescents-hiv-legal-guide-clinicians.
7. Kamlesh K, Samuel S, Setor K, et al. Association between adherence to pharmacotherapy and outcomes in type 2 diabetes: a meta-analysis. Diabetes Care. 2017;40:1588–1596. doi:10.2337/dc16-1925
8. McDonald Heather P, Garg Amit X, Brian HR. Interventions to enhance patient adherence to medication prescriptions: scientific review. JAMA. 2002;288:2868–2879. doi:10.1001/jama.288.22.2868
9. Nestoriuc Y, von Blanckenburg P, Schuricht F, et al. Is it best to expect the worst? Influence of patients’ side-effect expectations on endocrine treatment outcome in a 2-year prospective clinical cohort study. Ann Oncol. 2016;27:1909–1915. doi:10.1093/annonc/mdw266
10. Dalal Hasnain M, Anna Z, Kate J, et al. Home based versus centre based cardiac rehabilitation: cochrane systematic review and meta-analysis. BMJ. 2010;340:b5631. doi:10.1136/bmj.b5631
11. Ferdinand Keith C, Fred SF, Helene C-J, et al. Improving medication adherence in cardiometabolic disease: practical and regulatory implications. J Am Coll Cardiol. 2017;69:437–451. doi:10.1016/j.jacc.2016.11.034
12. Munro Salla A, Lewin Simon A, Smith Helen J, et al. Patient adherence to tuberculosis treatment: a systematic review of qualitative research. PloS Med. 2007;4:e238. doi:10.1371/journal.pmed.0040238
13. Yuen Courtney M, Kurbatova Ekaterina V, Thelma T, et al. Association between regimen composition and treatment response in patients with multidrug-resistant tuberculosis: a prospective cohort study. PloS Med. 2015;12:e1001932. doi:10.1371/journal.pmed.1001932
14. M T E P, H A T, Tourangeau A, et al. Factors influencing adherence to cancer treatment in older adults with cancer: a systematic review. Ann Oncol. 2014;25:564–577. doi:10.1093/annonc/mdt433
15. Xiaoqiu L, Lewis James J, Hui Z, et al. Effectiveness of electronic reminders to improve medication adherence in tuberculosis patients: a cluster-randomised trial. PloS Med. 2015;12:e1001876. doi:10.1371/journal.pmed.1001876
16. Tversky A, Kahneman D. The framing of decisions and the psychology of choice. Science. 1981;211:453–458. doi:10.1126/science.7455683
17. Karen S, Alison C, Michael D. Patient and provider barriers to effective management of gout in general practice: a qualitative study. Ann Rheum Dis. 2012;71:1490–1495. doi:10.1136/annrheumdis-2011-200801
18. International Patient Decision Aid Standards Collaboration. 2006: checklist for judging the quality of patient decision aids. Available from: http://ipdas.ohri.ca/IPDAS_checklist.pdf.
19. Hill PC, Stevens W, Hill S, et al. Risk factors for defaulting from tuberculosis treatment: a prospective cohort study of 301 cases in the Gambia. Int J Tuberc Lung Dis. 2005;9:1349–1354.
20. Jigar R, Rajesh N. Medication adherence in a sample of elderly suffering from hypertension: evaluating the influence of illness perceptions, treatment beliefs, and illness burden. J Manag Care Pharm. 2014;20:58–65. doi:10.18553/jmcp.2014.20.1.58
21. Butterworth Susan W. Influencing patient adherence to treatment guidelines. J Manag Care Pharm. 2008;14:21–24. doi:10.18553/jmcp.2008.14.S6-B.21
 © 2020 The Author(s). This work is published and licensed by Dove Medical Press Limited. The
full terms of this license are available at https://www.dovepress.com/terms
and incorporate the Creative Commons Attribution
- Non Commercial (unported, 3.0) License.
By accessing the work you hereby accept the Terms. Non-commercial uses of the work are permitted
without any further permission from Dove Medical Press Limited, provided the work is properly
attributed. For permission for commercial use of this work, please see paragraphs 4.2 and 5 of our Terms.
© 2020 The Author(s). This work is published and licensed by Dove Medical Press Limited. The
full terms of this license are available at https://www.dovepress.com/terms
and incorporate the Creative Commons Attribution
- Non Commercial (unported, 3.0) License.
By accessing the work you hereby accept the Terms. Non-commercial uses of the work are permitted
without any further permission from Dove Medical Press Limited, provided the work is properly
attributed. For permission for commercial use of this work, please see paragraphs 4.2 and 5 of our Terms.