")
Back to Journals » International Journal of Nanomedicine » Volume 11
3-Aminopropylsilane-modified iron oxide nanoparticles for contrast-enhanced magnetic resonance imaging of liver lesions induced by Opisthorchis felineus
Authors Demin A, Pershina A, Ivanov V, Nevskaya K, Shevelev O, Minin A, Byzov I, Sazonov A, Krasnov V, Ogorodova L
Received 3 May 2016
Accepted for publication 10 June 2016
Published 6 September 2016 Volume 2016:11 Pages 4451—4463
DOI https://doi.org/10.2147/IJN.S111880
Checked for plagiarism Yes
Review by Single anonymous peer review
Peer reviewer comments 2
Editor who approved publication: Dr Thomas Webster
Alexander M Demin,1,* Alexandra G Pershina,2,3,* Vladimir V Ivanov,2 Kseniya V Nevskaya,2 Oleg B Shevelev,4 Artyom S Minin,5 Iliya V Byzov,5 Alexey E Sazonov,2 Victor P Krasnov,1 Ludmila M Ogorodova2
1Postovsky Institute of Organic Synthesis of RAS (Ural Branch), Yekaterinburg, 2Siberian State Medical University, 3Russian National Research Tomsk Polytechnic University, Tomsk, 4Institute of Cytology and Genetics SB RAS, Novosibirsk, 5Miheev Institute of Metal Physics of RAS (Ural Branch), Yekaterinburg, Russia
*These authors contributed equally to this work
Purpose: Liver fluke causes severe liver damage in an infected human. However, the infection often remains neglected due to the lack of pathognomonic signs. Nanoparticle-enhanced magnetic resonance imaging (MRI) offers a promising technique for detecting liver lesions induced by parasites.
Materials and methods: Surface modification of iron oxide nanoparticles produced by coprecipitation from a solution of Fe3+ and Fe2+ salts using 3-aminopropylsilane (APS) was carried out. The APS-modified nanoparticles were characterized by transmission electron microscopy, fourier transform infrared spectroscopy, and thermogravimetric analysis . Magnetic resonance properties of MNPs were investigated in vitro and in vivo.
Results: The amount of APS grafted on the surface of nanoparticles (0.60±0.06 mmol g-1) was calculated based on elemental analysis and infrared spectroscopy data. According to transmission electron microscopy data, there were no essential changes in the structure of nanoparticles during the modification. The APS-modified nanoparticles exhibit high magnetic properties; the calculated relaxivity r2 was 271 mmol-1 s-1. To obtain suspension with optimal hydrodynamic characteristics, amino groups on the surface of nanoparticles were converted into an ionic form with HCl. Cellular uptake of modified nanoparticles by rat hepatoma cells and human monocytes in vitro was 74.1±4.5 and 10.0±3.7 pg [Fe] per cell, respectively. Low cytotoxicity of the nanoparticles was confirmed by 3-(4,5-dimethylthiazol-2-yl)-2,5-diphenyltetrazolium bromide and Annexin V/7-aminoactinomycin D flow cytometry assays. For the first time, magnetic nanoparticles were applied for contrast-enhanced MRI of liver lesions induced by Opisthorchis felineus.
Conclusion: The synthesized APS-modified iron oxide nanoparticles showed high efficiency as an MRI contrast agent for the evaluation of opisthorchiasis-related liver damage.
Keywords: magnetic nanoparticles, alkoxysilane, magnetic resonance imaging, liver fluke
Introduction
Opisthorchis felineus is a liver fluke that is widespread in Eastern Europe and Siberia which causes severe liver damage in an infected human.1 Mechanical bile duct obstruction, chronic inflammation, and periductal liver fibrosis are the most common pathologies. The main complication of opisthorchiasis infection is malignancy of infected organ.2 A closely related species Opisthorchis Viverrini, which is endemic in South Asia, is considered carcinogenic (group I) to humans. Most infected people especially in chronic form show no or nonspecific symptoms, which are very difficult to recognize because of the lack of pathognomonic signs, so the infection is frequently neglected.3 Moreover, commonly used liver function tests (alanine transaminase, aspartate aminotransferase, and alkaline phosphatase) often show no difference between healthy and infected people.4 In this way, liver imaging may be helpful for diagnosis.
Currently, magnetic resonance techniques are successfully used for focal liver lesion imaging,5,6 including damages induced by parasitic trematodes such as Clonorchis sinensis, Schistosoma japonicum, and Fasciola hepatica.7 Magnetic resonance imaging (MRI) provides good soft tissue contrast and higher spatial resolution of the anatomy, as opposed to ultrasound and computed tomography. Therefore, it is a method of choice for the diagnosis of liver disease.8 Contrast-enhanced MRI is the most suitable technique for the detection of liver lesion.9 In the meantime, there are few, if any, data about the application of nanoparticle-enhanced MRI for parasitic diseases imaging.
Magnetic nanoparticles (MNPs) are very promising for being used as MRI contrast agents.10 The underlying principle of MNP-enhanced MRI is that the iron core of MNPs induces local magnetic field inhomogeneity, which results in shortening of relaxation time of the surrounding protons.11 The nanoparticles based on Fe3O4 and Fe2O3 are the most widely used MNPs due to their biodegradable properties and negligible toxicity among all magnetic materials based on magnetite, maghemite, cobalt ferrite, gadolinium ferrite, as well as alloys of Ni, Cr, and Co.12 After entering into the bloodstream, MNPs are captured by cells of the reticuloendothelial system (RES) by phagocytosis and accumulated primarily in the liver (in hepatic macrophages) and less in spleen, medulla, and lymph nodes.13,14 Further, MNPs are metabolized in the lysosomes and, as a result, transferred in a nonmagnetic form (eg, ferritin and hemoglobin). MNPs-loaded Kupffer cells are homogeneously distributed in normal hepatic parenchyma and produce a strong T2/T2* signal decrease, whereas pathologic lesions do not lose magnetic resonance (MR) signal due to the lack of Kupffer cells and negligible uptake of nanoparticles.15,16
For biomedical application, stabilization of nanoparticles colloid after synthesis is required, and thereby several approaches are proposed for the surface modification of covalent and noncovalent nanoparticles.17–19 One of the most effective methods of modification is the covalent modification of MNP surface using various alkoxysilane reagents.20 Alkoxysilanes are commercially available reagents that contain various functional groups such as amino,21–28 mercapto,26–29 glycidyloxy,26,30,31 cyano,27,32 carboxylic, aldehyde, and isocyanate27 groups. Following the modification, alkoxysilanes form a cross-linked silicone layer with functional groups covering the surface of nanoparticles. Subsequently, targeting biomolecules or drugs may be easily conjugated with MNPs due to interaction with the surface functional groups.
In the current study, MNPs were applied for contrast-enhanced MRI of liver lesions induced by O. felineus. For this purpose, the Fe3O4-based MNPs were synthesized by coprecipitation from a solution of Fe3+ and Fe2+ salts. Subsequent surface modification was carried out to obtain stable suspension with good magnetic properties and optimal hydrodynamic characteristics to be applied as an MRI contrast agent in vivo.
Materials and methods
Materials
For silanization, (3-aminopropyl)trimethoxysilane (APTMS; 97%; Alfa Aesar, Heysham, UK) was used. All other chemicals were purchased from commercial suppliers and were of the highest purity available. These chemicals were high purity (American Chemical Society grade) or molecular biology grade and were used as received. Deionized (DI) water (18.2 M Ω cm−1) and 95% ethanol (EtOH) were used throughout the experiments.
Surface modification of MNPs
Synthesis of MNPs
MNPs were obtained by coprecipitation from a solution of Fe3+ and Fe2+ salts. The solution of 0.278 g (1.0 mmol) FeSO4·7H2O and 0.541 g (2.0 mmol) FeCl3·6H2O in 10 mL of DI water was constantly agitated on the overhead stirrer and then treated in the ultrasonic bath; 3 mL of a saturated solution of ammonia was added to achieve the pH of 11–12. The solution was stirred for 30 minutes, precipitated on a magnet, and washed with DI water to neutral the pH.
Surface modification of MNPs using APTMS
A solution of 54 μL (0.3 mmol) APTMS in EtOH was added to 50 mL suspension of MNPs in 95% EtOH (containing 100 mg of MNPs) under vigorous mechanical stirring. After 24 hours, the obtained MNPs (MNPs-NH2) were precipitated on a permanent magnet, washed three times with EtOH and water, and resuspended in water using ultrasonic agitation (35 kHz).
Characterization of MNPs
Fourier transform infrared (FTIR) spectra were recorded on an FTIR spectrometer (Nicolet 6700 Thermo) by the attenuated total reflection method on the diamond crystal in the range of 4,000–400 cm−1 with 128 scans and at 4 cm−1 resolution.
The mass fraction of carbon was measured using an automatic analyzer CHN PE 2400 II (PerkinElmer Inc., Waltham, MA, USA). Transmission electron microscopy (TEM) images of the MNPs were obtained using Philips CM30. Thermogravimetric analysis (TGA) was performed on a ~5 mg of sample using TGA/DSC1 Thermogravimetric Analyzer (Mettler Toledo, Columbus, OH, USA) with a heating rate of 10°C min−1 over a temperature range of 30°C–900°C, under compressed Ar (60 mL min−1). The specific magnetization of the powders of modified MNPs was measured at room temperature using a vibration magnetometer in a magnetic field up to 2.2 mA m−1. The relaxivity of 3-aminopropylsilane (APS)-modified MNPs dispersed in water (with the concentration ranging from 0.6 to 82.7 μM) was determined using a relaxometer (ECOTEK Corporation, Houston, TX, USA). The T2 measurements were performed by using the corresponding Carr-Purcell-Meiboom-Gill pulse sequence (90°–echo time [TE]/2–180°–echo) (4.31 MHz, echo 1 ms). To measure T1, a modified saturation recovery pulse sequence (repetition time [TR]i–90°–TE/2–180°–echo, where TRi is the ith value of the time recovery) was used. Relaxivity data were expressed as a slope of the relaxation rate vs concentration. The slope was calculated by best-fit linear regression analysis using the least squares method. Zeta potential (ZP) and dynamic light scattering characterization were carried out using Malvern Zetasizer Nano ZS (Malvern Instruments, Malvern, UK). The concentration of suspension was determined using Faraday balance. The resulting ferromagnetic contribution value was used to calculate the proportion of magnetic cores (ferrite) corresponding to nanoparticles contained in the suspension.
The concentration of iron in the suspension of MNPs was measured by atomic emission spectrometry with inductively coupled plasma (iCAP 6300 Duo; Thermo Fisher Scientific, Waltham, MA, USA).
Experimental animal model
For the experiment, 5-week-old male golden hamsters (Mesocricetus auratus) were infected intragastrically with 50 metacercariae O. felineus per hamster according to the previously described protocol.33 Hamsters were housed three to a cage (OptiRAT) under conventional conditions and were fed with stock diet and water ad libitum. The hamsters at the age of 30 weeks and with the weight of ~100 g were used for the MRI experiments (n=6). Age-matched intact hamsters were used as controls (n=6).
The animals were handled according to the regulations of the Animal Care and Use Committee of the Institute of Cytology and Genetics, Siberian Branch, Russian Academy of Sciences, and kept in a pathogen-free environment. The experimental protocol has been approved by the Bioethics Review Committee of the Institute of Cytology and Genetics (No 24 from October 28, 2014).
MRI in vitro and in vivo
All 1H MRI experiments were performed on an 11.7 T horizontal MRI scanner (Biospec 117/16 USR; Bruker Optik GmbH, Ettlingen, Germany) equipped with transmitter volume (500.3 MHz, with the diameter of 72/89 mm, Biospec; Bruker Optik GmbH) and a receiver surface 1H coils (500.3 MHz, with the size of 123×64×31 mm3, Biospec; Bruker Optik GmbH). The initial MR images of ferrofluid phantoms (slice thickness, 0.5 mm; field of view, 4.0 ×4.0 cm2; matrix, 256×256 dots2, 90°–τ–180°–τ–90°) were obtained by rapid acquisition with relaxation enhancement with the pulse sequence parameters, TR =12.5–5,425 ms, TE =10–80 ms.
To investigate the MRI contrast properties of MNPs in vivo, the hamsters were immobilized with gas anesthesia (Isoflurane; Baxter International Inc., Deerfield, IL, USA) using a Univentor 400 Anesthesia Unit (Univentor, Malta). The animal body temperature was maintained by means of a water circuit installed in the table bed of the scanner; the temperature was 30°C on its surface. A pneumatic respiration sensor (SA Instruments Inc., Stony Brook, NY, USA) was placed under the lower body, which allowed to control the depth of anesthesia. Scanning was performed before and after the administration of MNPs within an hour with an interval of 10 minutes. Approximately 200 μL of 5.2 mM [Fe] nanoparticle suspension in phosphate-buffered saline (PBS; 137 mM NaCl, 2.7 mM KCl, 10 mM Na2HPO4, 1.8 mM KH2PO4, pH 7.4) was administered in the femoral vein. T1- and T2-weighted images of hamster liver (slice thickness, 1 mm; field of view, 6.0×6.0 cm2; matrix, 256×256 dots2) were recorded by rapid acquisition with relaxation enhancement with the pulse sequence parameters, TR =1.5 ms, TE =7.5 ms. The signal intensity was measured in the defined regions of interest and related to external reference. The liver lesions with hyperintense signal in T2-weighted images were manually delineated in each slice, and the lesion area was measured using ImageJ software. The lesion volume was estimated as the sum of the lesion areas of all slices multiplied by slice thickness (0.5 mm).
Histological analysis
Each group of animals after the administration of nanoparticles and MRI scanning during 1 hour was divided into two subgroups. The first subgroup was sacrificed immediately, and the second was sacrificed after 24 hours. The liver was extracted and placed in 10% neutral buffered formalin. Tissue sections were cut into 4–5 μm thick slices. Standard hematoxylin and eosin and Prussian blue staining protocols were used. For differential staining of collagen in the liver samples, Van Gieson method was used. The fibrosis stage was estimated according to METAVIR fibrosis score. The histological analysis was performed using optical microscope Axiostar Plus (Carl Zeiss Meditec AG, Jena, Germany).
Isolation of human monocytes
Peripheral blood mononuclear cells were obtained from the blood of healthy donors using Ficoll (PanEco, Moscow, Russia) density gradient centrifugation at 2,500 rpm for 20 minutes. Monocytes were isolated using Percoll (GE Healthcare Bio-Sciences AB, Uppsala, Sweden) double density gradient centrifugation at 3,400 rpm for 50 minutes at room temperature with subsequently CD14+ cell subset purification using the magnetic-activated cell sorting with human CD14 MicroBeads (Miltenyi Biotec, Bergisch Gladbach, Germany) on an MACS® MS column according to the manufacturer’s protocol. The purity of the isolated monocyte subsets was 90%–95%. The purified human monocytes were cultured in 24-well plates in Roswell Park Memorial Institute 1640 medium supplemented with 10% (vol/vol) fetal bovine serum (FBS; Hyclone Laboratories, Logan, UT, USA) at 37°C in 5% CO2. The experiment was performed according to the guidelines of local Ethics Committee of the Siberian State Medical University (No 4380 from 30.11.2015), written informed patient consents were obtained.
Cellular uptake of MNPs
Hepatoma cells (HTC; rat hepatoma, Institute of Cytology RAS, Russia) were grown in 5% CO2 at 37°C in Dulbecco’s Modified Eagle’s Medium (DMEM) supplemented with 10% (vol/vol) FBS.
MNPs in the concentration of 50 mg L−1 were added to 2×10⁵ cells (HTC or monocytes) and incubated for 1 hour. Then, the cells were washed twice using PBS, detached using trypsin–ethylenediaminetetraacetic acid solution, and lysed using 50 mM NaOH. The iron concentration was determined using colorimetric ferrozine-based assay34 with initial dissolution of nanoparticles in 5 M HCl during 4 hours at 60°C.
For light microscopy analysis, the cells were seeded on a glass coverslip and co-incubated with MNPs. Then, they were washed twice with PBS, fixed in 4% paraformaldehyde for 30 minutes at room temperature, stained with 4% ferrocyanide in 4% hydrochloric acid for 15 minutes (Prussian blue staining), and counterstained using 0.5% buffered neutral red.
In vitro cytotoxicity evaluation
MNPs in Fife concentrations (5–100 μg mL−1) were incubated with HTC for 2, 24, and 48 hours and with human monocytes for 2 and 24 hours. Cell viability was measured by the 3-(4,5-dimethylthiazol-2-yl)-2,5-diphenyltetrazolium bromide (MTT) assay35 and expressed as a fraction of viable cells normalized to the cells without co-incubation with MNPs (blank control). Apoptotic and necrotic cell death was determined using Annexin V/7-aminoactinomycin D kit (BD Biosciences, San Jose, CA, USA) on a BD Accuri-C6 flow cytometer.
Statistical analysis
The obtained data were statistically analyzed using the software package GraphPad Prism Version 5.0 for Windows. Data were tested by Shapiro–Wilk test for normality and presented as mean ± SD. The differences between data groups were calculated using Student’s t-test. Spearman’s rank correlation test was applied to assess the correlation between the calculated volume of liver lesions and the fibrosis stage. The P-values <0.05 were considered significant.
Results
Synthesis, functionalization, and characterization of the prepared MNPs
The MNPs, obtained by the coprecipitation method, had the average diameter of 11 nm and the spinel Fe3O4 phase state according to the TEM (Figure 1A and B). The specific magnetization of MNPs was 81 emu g−1 (Figure 2).
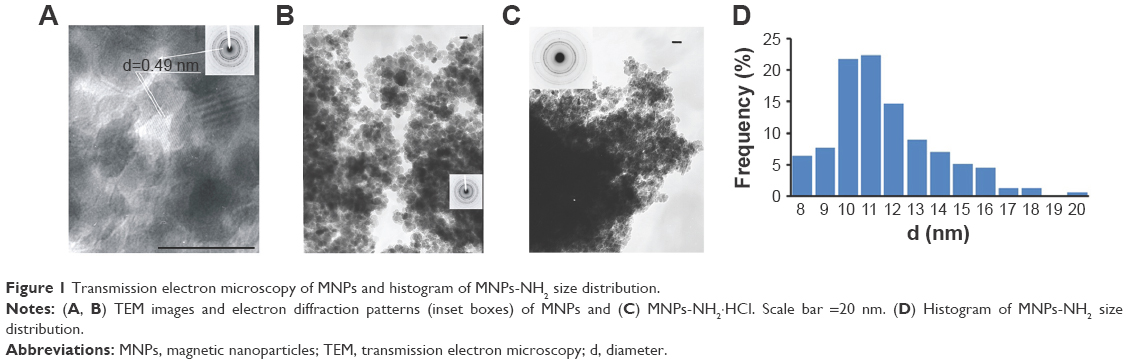 | Figure 1 Transmission electron microscopy of MNPs and histogram of MNPs-NH2 size distribution. |
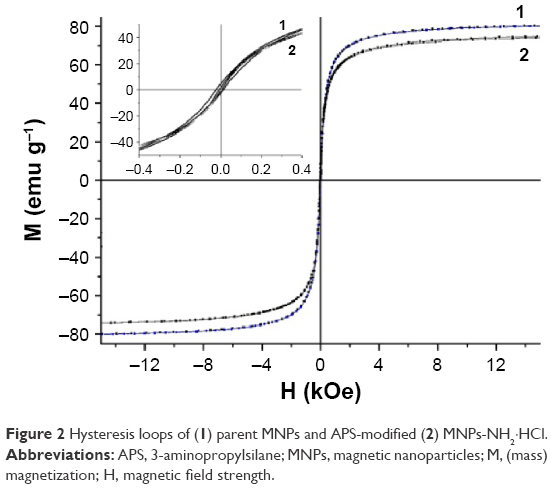 | Figure 2 Hysteresis loops of (1) parent MNPs and APS-modified (2) MNPs-NH2·HCl. |
The surface covalent modification of MNPs using alkoxysilane reagents is a complex reaction which includes reversible hydrolysis with the water absorbed on the surface of nanoparticles in the first step and coupling with the alkoxysilane molecules (with polysiloxane formation) and hydroxyl groups on the surface of MNPs in the second step. In the case of an anhydrous solvent usage, the water adsorbed on the surface of nanoparticles is involved in hydrolysis.36 Currently, alcoholic or aqueous–alcoholic mediums are most frequently used for the immobilization of APS derivatives on the MNPs.21,22 Consequently, the anchoring of polysiloxane on the surface of MNPs due to Si–O–Fe bond formation occurs. The MNPs applied in this research had hydrophilic properties; therefore, their modification with APTMS was carried out in aqueous–alcoholic solution similarly to the previously developed procedure.37,38 As a result, the MNPs containing amino groups on the surface (MNPs-NH2; Figure 3) were obtained.
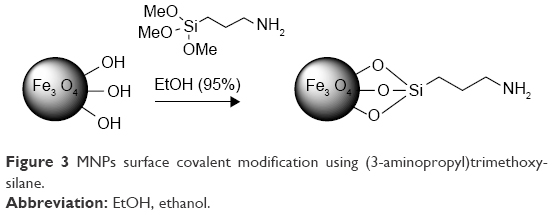 | Figure 3 MNPs surface covalent modification using (3-aminopropyl)trimethoxysilane. |
The immobilization of APS on the MNPs was confirmed by infrared (IR) spectroscopy (Figure 4). The adsorption band at 540 cm−1 in the FTIR spectra corresponded to the stretching vibrations of Fe–O bond. The broad adsorption band of APS-modified MNPs at 997 cm−1 was observed due to the stretching vibrations of Si–O and corresponded to the formation of Si–O–Fe and Si–O–Si bonds in the reaction. In the spectra of MNPs-NH2·HCl, this absorption band underwent a shift (1,074 cm−1) and became more complex probably due to the change in the charge state of the surface Si–O groups. The magnification of the bands at 1,495 and 1,607 cm−1, associated with bending vibrations of C–H and N–H (in particular, NH3+) bond, was also observed in the FTIR spectra of modified MNPs. The presence of these bands confirmed covalent bond formation between the APS and the surface of MNPs. The MNPs, obtained by the co-precipitation method, had average diameter of 11 nm and the spinel Fe3O4 phase state according to the TEM (Figure 1A and B).
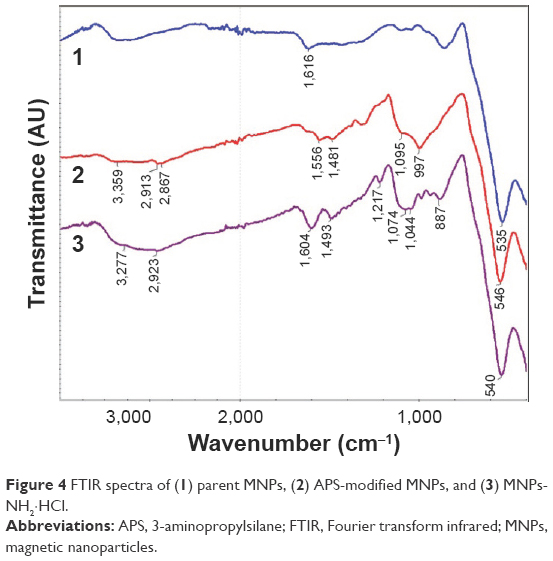 | Figure 4 FTIR spectra of (1) parent MNPs, (2) APS-modified MNPs, and (3) MNPs-NH2·HCl. |
According to TEM data, there are no essential changes in the structure of MNPs during the process of modification (Figure 1C).
The amount of APS immobilized on the surface of MNPs was calculated according to carbon content determination by elemental analysis and IR spectroscopy data, following the previously described method.39 As a result, 0.60±0.06 mmol of APS was grafted on 1 g MNPs.
The thermogravimetric curve of the MNPs-NH2 exhibited two steps (Figure 5). The initial weight loss (3%) of MNPs-NH2 below 130°C corresponded to the expulsion of water from the surface of nanoparticles. The decomposition of APS residues occurred in the second step under heating up to 500°C and led to 7% weight loss. The calculated amount of APS grafted on MNPs was 0.5 mmol per 1 g. The underestimation of the APS value obtained by TGA in comparison with FTIR and elemental analysis data could be attributed to incomplete removal of the degradation impurities from the surface of MNPs in inert atmosphere.
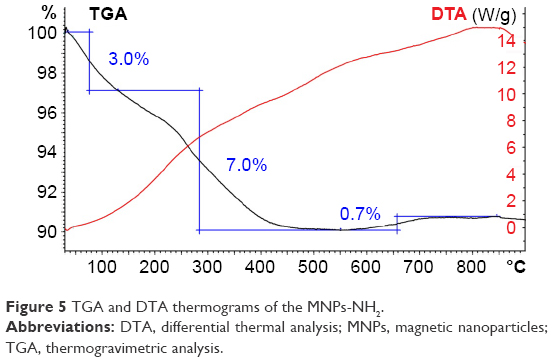 | Figure 5 TGA and DTA thermograms of the MNPs-NH2. |
The magnetization curves of parent and modified MNPs showed that nanoparticles exhibited high magnetic properties (Figure 2). The value of saturation magnetization was 76 emu g−1 for MNPs-NH2·HCl. The result indicated that the prepared MNPs-NH2 retained strong magnetic properties after modification.
Stabilization of APS-modified MNP suspension
To acquire suspensions with optimal characteristics in hydrodynamic diameter (Dh) and ZP, the amino groups of 3-aminosilane (APS) residues were converted into an ionic form using 0.1 M HCl solution.
In the first experiment, the dependence of the Dh of nanoparticles in the suspension on HCl concentration was studied (Figure 6A). Then, 0.5, 1, 1.5, and 5 molar equivalent of 0.1 M HCl solution, 5, 10, 15, and 20 μL, respectively, was added to 5 mL of MNPs-NH2 suspensions with the concentration of 0.5 mg mL−1 containing 1.05 μmol NH2 group. The change of pH from 6.0 to 2.0 led to the increase in ZP from 29 to 41 mV, while Dh and polydispersity index (PDI) remained almost constant, equal to 130 nm and 0.1, respectively. Thus, the addition of 0.5–1.5 molar equivalent of 0.1 M HCl to the suspension of APS-modified MNPs allowed to obtain sedimentationally stable colloid system with pH 5.0–5.5.
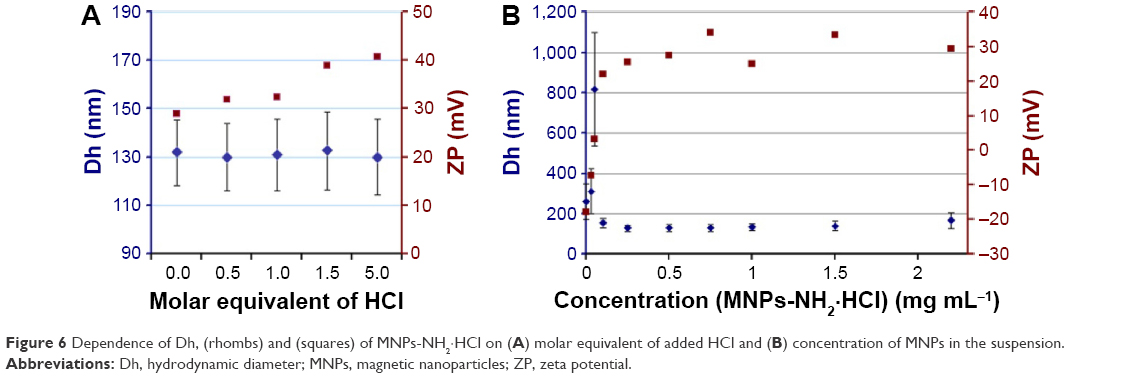 | Figure 6 Dependence of Dh, (rhombs) and (squares) of MNPs-NH2·HCl on (A) molar equivalent of added HCl and (B) concentration of MNPs in the suspension. |
In the second part of the experiment, serial dilution (1.5, 1, 0.75, 0.5, 0.25, 0.1, 0.05, 0.033, and 0.001 mg mL−1) of MNPs-NH2 suspension with the initial concentration of 2.2 mg mL−1 stabilized by 1 molar equivalent of HCl was used to determine the effect of the concentration of nanoparticles on Dh and ZP value (Figure 6B).
The optimal Dh was equal to 130 nm (PDI, 0.1) and was observed in the concentration ranged from 0.2 to 1.0 mg mL−1; the average ZP was +29 mV. The increase in the concentration up to 2.0 mg mL−1 resulted in a slight rise in MNPs Dh. Dilution of suspension to 0.1 mg mL−1 led to drastic enlargement of nanoparticles up to micrometer size and a shift of ZP from +30 to –18 mV. Similar “dilution” effect on the hydrodynamic characteristics of nanoparticles was reported for multi-walled carbon nanotubes and silica and gold nanoparticles.40 Thus, the observed ZP shift in the suspension with the concentration <0.2 mg mL−1 can be explained by an increase in the contribution of the signal from extraneous particulate matter. The rise in the particle size can be attributed to the nature of the homodyne optical configuration of the instrument.
For the following experiments, the suspensions of MNPs-NH2·HCl were stabilized using 1.0 molar equivalent of HCl, centrifuged for 10 minutes at 5,000 rpm to remove the accidental agglomerates, and subsequently diluted to 0.2–1.0 mg mL−1.
To predict the behavior of nanoparticles in physiological conditions, the MNPs-NH2 was diluted with PBS (to the final concentration of 0.4 mg L−1) and then in DMEM (supplemented with 10% FBS) in the ratio of 1:8 and 1:20 (to the final concentration of 0.05 and 0.02 mg mL−1). The suspensions were stable, and the Dh of MNPs was 162 nm (PDI, 0.22) and 140 nm (PDI, 0.29) for 0.05 and 0.02 mg mL−1, respectively. The measured ZP changed from +29 to −10 mV for both tested suspension. The slight enlargement of Dh as well as a change in ZP attributed to protein adsorption on the surface of nanoparticles.
Investigation of magnetic resonance properties of MNPs in vitro and in vivo
The calculated relaxivity r2 of APS-modified MNPs was 270.7 mmol−1 s−1, and 5.87 times higher than relaxivity r1 which was 46.1 mmol−1 s−1 (Figure 7A). For in vivo MRI, the MNPs-NH2·HCl suspension (Dh, 130 nm; PDI, 0.12; ZP, +25.6 mV) was diluted to the final concentration of 0.4 mg mL−1 (equal to 5.2 mM [Fe]) using PBS and T2-weighted images of phantoms were obtained (Figure 7B). Ten minutes after the administration of 0.2 mL of MNPs-NH2, the signal loss in liver parenchyma was detected on T2-weighted images. The maximum MRI signal reduction was attained at 50 minutes after the administration of MNPs-NH2 (Figure 7C).
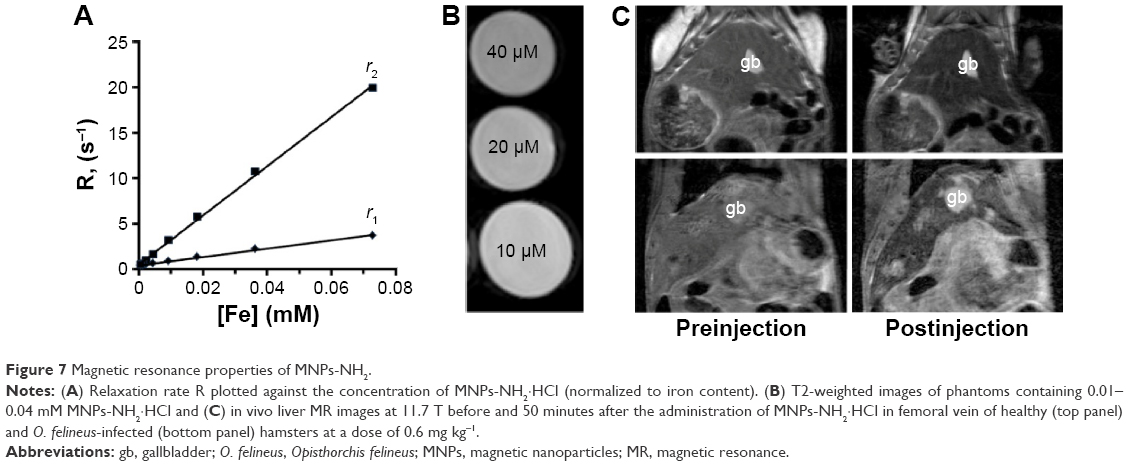 | Figure 7 Magnetic resonance properties of MNPs-NH2. |
After the administration of MNPs-NH2 in O. felineus-infected hamsters, nanoparticles (in hepatic macrophages) rapidly accumulated in undamaged liver tissue, whereas in lesions they did not penetrate (Figure 7C). Therefore, the contrast between damaged and surrounding normal tissues markedly increased. The calculated liver parenchyma signal intensity on T2-weighted images decreased by 27%±2.9% (relative to external reference), while the liver lesions retained their original MR signal intensity and became well distinguished. The calculated volume of the lesions was correlated with fibrosis stage (correlation coefficient was 0.871).
Histological analysis
The liver of healthy hamsters after the administration of MNPs-NH2 demonstrated absolutely normal histological structure without any pathological changes (Figure 8A). O. felineus infection resulted in deranged liver architecture, whereas trabecular pattern mostly remained intact. Acute cholangitis in the portal tract was accompanied by fibrosis with periportal inflammatory cell infiltration and prominent proliferation of small bile ducts (Figure 8B). Adult flukes were found in bile duct lumen. Pronounced periductal fibrosis around small and large bile ducts was detected by Van Gieson staining (Figure 8C). Liver fibrosis was irregular, and in some zones nodular transformation of the liver occurred. The stage of fibrosis in animals varied from 2 to 4 (cirrhosis), according to METAVIR score. One hour after MNPs-NH2 administration to healthy hamster occasional iron loaded cells were found in the Prussian blue stained liver samples (Figure 8D). Simultaneously, the Prussian blue-positive inclusions were found in macrophages in the portal tract of infected hamster (Figure 8E). Twenty four hours after MNPs-NH2 administration to healthy hamster the intense accumulation of iron in the form of granular aggregates was observed in the hepatocyte cytoplasm, which was assumed as ferritin/hemosiderin.41 The accumulation of iron in the liver tissue was irregular and most pronounced in the pericentral zone of the liver acinus (ie, directly around the central veins; Figure 8F). Whereas 24 hours after MNPs-NH2 administration the infected liver, as opposed to the healthy one, had not accumulated iron in hepatocytes, presumably dues to impairment of their function (Figure 8G).
 | Figure 8 Histological analysis of the liver microsection. |
In vitro MNPs-NH2 cellular uptake
The ability of the synthesized MNPs-NH2 to accumulate in cells was demonstrated on rat HTC and primary culture of human monocytes in vitro. Both type of cells effectively captured MNPs-NH2 applied in cultural media to the final concentration of 50 mg L−1. The cellular uptake of MNPs-NH2 by HTC and monocytes for 1 hour of incubation was 74.1±4.5 and 10.0±3.7 pg [Fe] per cell, respectively (Figure 9).
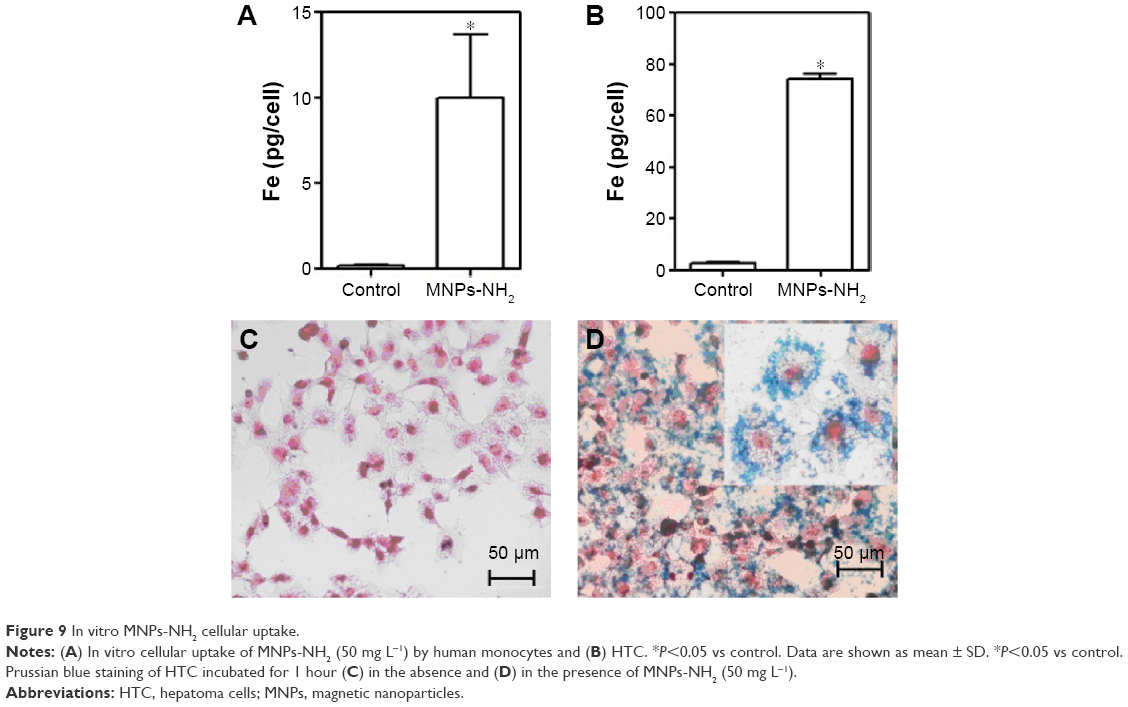 | Figure 9 In vitro MNPs-NH2 cellular uptake. |
MNPs-NH2 cytotoxicity assay
The MTT assay indicated that the MNP-NH2 had a slight adverse effect on HTC after 2 hours of incubation (Figure 10A). After 24 h the viability of cells, incubated in presence of MNP-NH2 in concentration 50 mg L−1, decreased as opposed to the control and was equal to 81.5±5.7%. Importantly, during further incubation for 48 hours, the MNPs showed no cytotoxicity in all tested concentrations. According to Annexin V/7-AAD measurements, MNP treatment does not lead to cell death (Figure 10B). These data suggested that negative impact of MNPs on cells is related to the initial impairment of the mitochondrial function, but these changes are reversible and apoptosis is not induced.
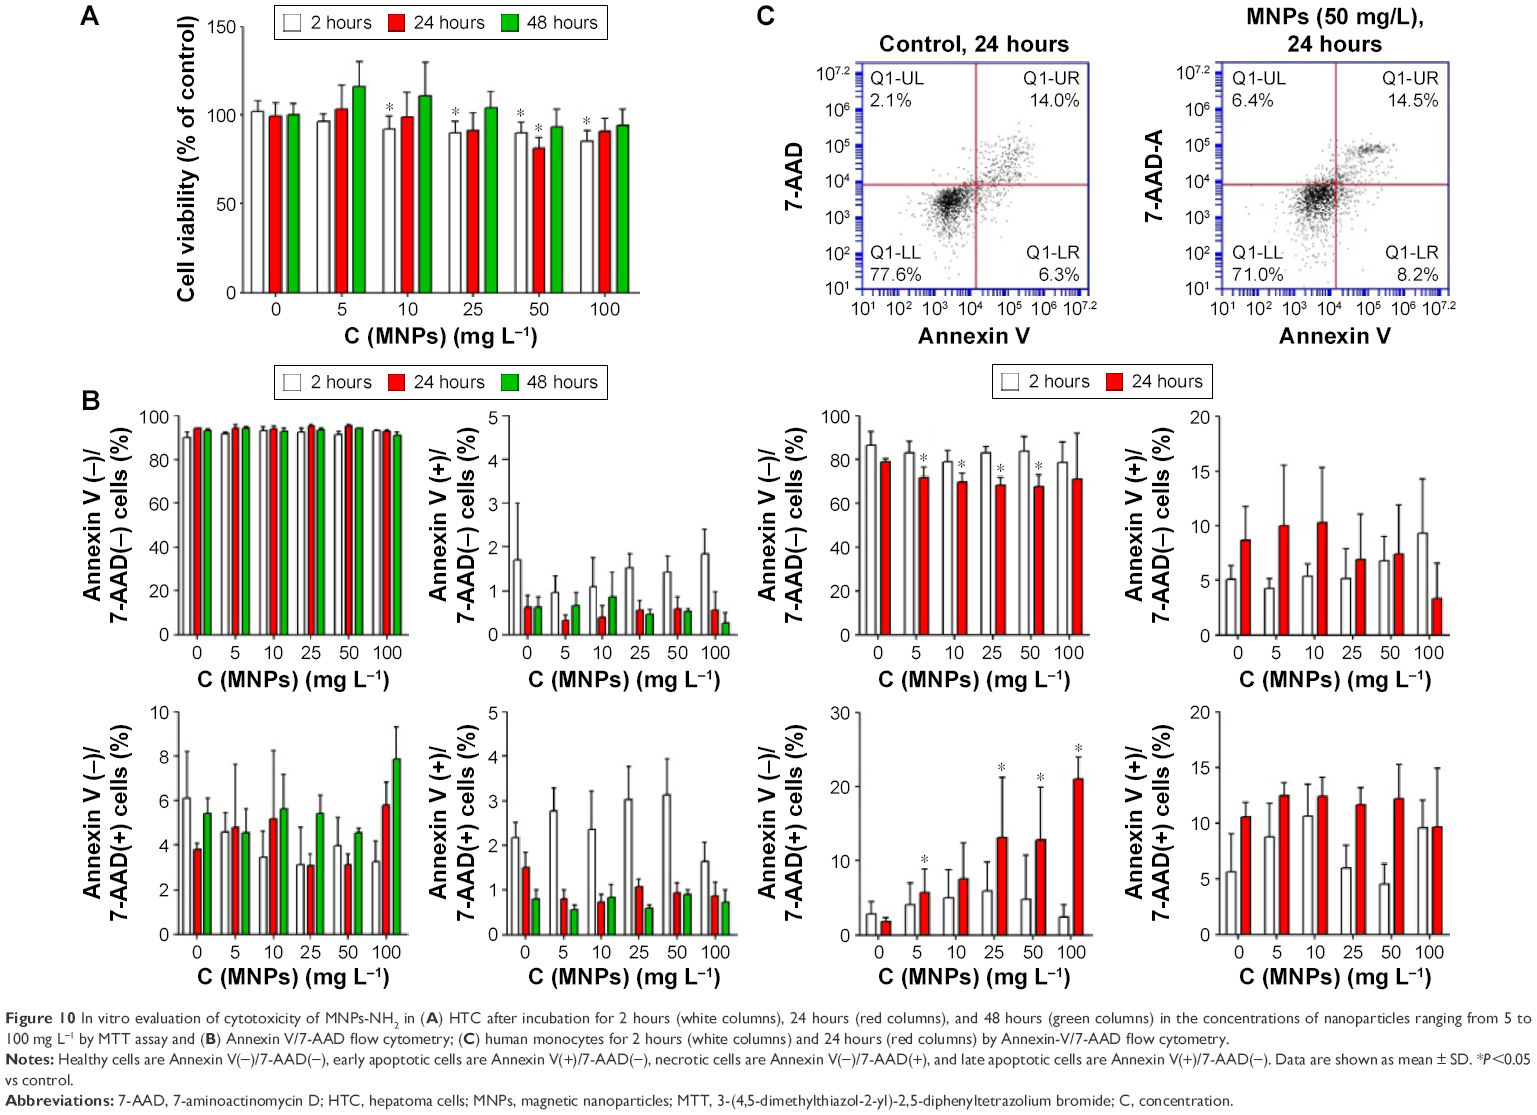 | Figure 10 In vitro evaluation of cytotoxicity of MNPs-NH2 in (A) HTC after incubation for 2 hours (white columns), 24 hours (red columns), and 48 hours (green columns) in the concentrations of nanoparticles ranging from 5 to 100 mg L−1 by MTT assay and (B) Annexin V/7-AAD flow cytometry; (C) human monocytes for 2 hours (white columns) and 24 hours (red columns) by Annexin-V/7-AAD flow cytometry. |
The potential negative impact of MNPs-NH2 was further investigated on primary culture of human monocytes using Annexin V/7-AAD flow cytometric analysis. After 2 hours of incubation, no cytotoxic effect was occurred (Figure 10C). During 24 hours of incubation with MNPs-NH2, the amount of 7-AAD-positive cells increased in comparison with the control. However, total monocyte viability after 24 hours of incubation was not <67.5% and was comparable to cell viability in the control −79.0%.
Discussion
Commonly, in the MR images obtained using conventional MRI protocols, the contrast between normal and diseased liver tissues is insufficient and requires providing of contrast-enhanced MRI.42 MNPs are successfully used as a T2 contrast agent in MRI due to its ability to shorten T2/T2* relaxation time of surrounding protons. Iron oxide nanoparticles significantly increase tumor-to-liver contrast and allow detecting of more lesions than unenhanced MRI.43
The key feature of MNPs used for MRI is relaxivity r2. The r2 of the synthesized MNPs-NH2 is higher than relaxivity r2 for a variety of commercial drugs, for example, ferumoxides (AMI-25/Endorem® [Guerbet, Lanester, France]/Feridex® [Bayer HealthCare Pharmaceuticals Inc., Wayne, NJ, USA]) with 98.3 mmol−1 s−1 (r2/r1, 4.11), ferucarbotran (SHU 555 A/Resovist® [Bayer Pharma AG, Berlin, Germany]) 151.0 mmol−1 s−1 (r2/r1, 5.94), as well as ferumoxsil (Lumirem® [Guerbet], GastroMARK® [St Louis, MO, USA]), a negative oral contrast agent for abdominal structure visualization based on siloxane-coated MNPs with a Dh of ~300 nm and r2 of 72 mmol−1 s−1 (r2/r1, 22.5).6,13,14,44,45 The higher relaxivity and good r1/r2 ratio allow injecting of less amount of nanoparticles for MRI. Thus, the administrated dose of synthesized MNPs-NH2 was similar to that of Resovist® (8–10 μmol kg−1) and lower than the recommended dose of Feridex® (15 μmol kg−1).46
Dextran-coated MNPs including the abovementioned ferumoxides, MNPs with low molecular weight dextran coating and a particle size of 120–180 nm, and ferucarbotran, carboxydextran-coated MNPs with a particle size of 45–60 nm, are commonly used for MRI if liver lesions. It is widely accepted that dextran is nontoxic; however, the study by Berry et al47 showed that dextran-derivatized iron oxide MNPs caused negative effects on fibroblasts similar to bare nanoparticles. The authors supposed that the negative impact on cell can be realized due to the breakdown of dextran shell from the surface of nanoparticles and following the aggregation of nanoparticles. Conversely, in the case of APS-modified MNPs, the covalent binding of coating prevents the risk of the aggregation of MNPs and interaction of cells or biomolecules with the surface of bare nanoparticles.
Generally, MNPs are RES contrast agents. After intravenous injection, plasma proteins immediately interact with MNPs and its opsonization occurs.18 The opsonized nanoparticles undergo rapid clearance from the bloodstream by RES cells, foremost by monocytes and macrophages of the liver, of the spleen, and of the bone marrow.46 However, the biodistribution of MNPs is strongly dependent on size and surface coating.48 The nanoparticles >50 nm in diameter are rapidly sequestered by hepatic and splenic macrophages. The size ~100 nm is optimal for accumulation in liver, whereas nanoparticles >200 nm in size undergo filtration in the spleen.17 It is well accepted, that positively charged nanoparticles rapidly accumulated in organs of RES, while the neutral ones have a longer half-life in blood.49,50 In the work by Souris et al,51 it was shown that positively charged near-IR fluorescent mesoporous silica nanoparticles demonstrate more rapid hepatobiliary excretion, opposite to negatively charged one. Taking into account the issue of body clearance from contrast agent, the application of positively charged nanoparticles, such as APS-modified MNPs, for liver MRI seems to be very attractive.
The MNPs-NH2 demonstrated effective uptake by both HTC and monocytes in in vitro experiments. The rapid liver uptake is undesirable for most of the nanomedicine application devoted to magnetic targeting of non-RES organs and tissues; for shielding of nanoparticles from RES clearance, PEG coating is the most appropriate.17 However, this circumstance has benefit in the case of MRI of liver lesions. For instance, Kupffer cells loaded by nanoparticles migrate through normal liver tissue and cause hypointense signal on T2-weighted images, whereas due to the lack of Kupffer cells in the tumor, malignant regions retain their original intensity and can be easily distinguished.5,52 In the case of liver lesion induced by O. felineus, the same situation occurs. The damaged liver zones, formed predominantly around bile ducts, did not accumulated nanoparticles. The lack of the accumulation of nanoparticles in lesions was supposed to have been caused by RES dysfunction. Indeed, resident liver macrophages undergo phenotypic and functional changes in damaged liver zones.53 Furthermore, biliary obstruction is followed by impaired phagocytosis activity of Kupffer cells.54
Previously, Hanpanicha et al55 applied non-enhanced MRI for the evaluation of liver infected by closely related liver fluke species O. viverrini. In the work by Hanpanicha et al, MRI grading was based on the number of liver segments that showed increased signal intensity of the bile duct in an MRI and correlated with fibrosis stage. The nanoparticle-enhanced MRI allowed to substantially increase the contrast of liver lesions caused by O. felineus and improved the diagnostic potential of magnetic resonance techniques for parasitic disease imaging. The strong correlation between lesion area evaluated according to MRI data analysis and fibrosis stage provides new approach for the estimation of opisthorchiasis-related liver damage.
Conclusion
The surface modification of iron oxide nanoparticles produced by coprecipitation from a solution of Fe3+ and Fe2+ salts using APS was carried out. Modified MNPs-NH2 exhibited strong MR contrast properties, and the estimated relaxivity r2 was higher than relaxivity r2 of several commercial drugs approved by the US Food and Drug Administration. The MNPs-NH2 showed great efficacy as an MRI contrast agent for the evaluation of opisthorchiasis-related liver damages and had negligible cytotoxicity effect on the cells in the working concentration. The whole set of data provides future application of APS-modified MNPs-NH2 obtained in this work as a platform for designing multimodal agents for biomedical diagnostics and target therapy.
Acknowledgments
This work was partially supported by the Russian Foundation for Basic Research (project No 14-03-00146), the State Program for the Support of Leading Scientific Schools (grant No NSh 5505.2012.3) (synthesis of nanoparticles), and the Russian Science Foundation (project No 14-15-00247; in vitro and in vivo experiments). Animal MRI was conducted at the Centre for Genetic Resources of Animal Laboratory, Institute of Cytology and Genetics, Siberian Branch, Russian Academy of Sciences (RFMEFI61914X0005 and RFMEFI61914X0010). The authors thank Nina N Shchegoleva for providing the TEM analysis, Mikhail A Uimin for characterizing the magnetic properties of nanoparticles, Sergey V Vtorushin for performing the histological analysis, Raisa I Pleshko for assisting in cell microscopy, and Darya O Ashcheulova for English proofreading.
Author contributions
Conceived and designed the experiments, analyzed the data, and co-wrote the article: AMD and AGP. Synthesized and modified nanoparticles, carried out FTIR spectroscopy investigations, and summarized the results of physical–chemical methods of investigation: AMD. Studied the cellular uptake of nanoparticles, coordinated and summarized the results of biological experiments: AGP. Conducted animal experiments: VVI. Evaluated the cytotoxicity of MNPs in vitro: KVN. Provided MRI scanning: OBS. Carried out the dynamic light scattering investigations: ASM. Evaluated the relaxivity r2 of MNPs: IVB. Contributed to conception and revised the manuscript critically for important intellectual content: VPK, AES, and LMO. Supervised the project: LMO. All authors contributed toward data analysis, drafting, and critically revising the paper and agree to be accountable for all aspects of the work. All authors have given approval to the final version of the manuscript.
Disclosure
The authors report no conflicts of interest in this work.
References
Ogorodova LM, Fedorova OS, Sripa B, et al. Opisthorchiasis: an overlooked danger. PLoS Negl Trop Dis. 2015;9(4):e0003563. | ||
Infection with liver flukes (Opisthorchis viverrini, Opisthorchis felineus and Clonorchis sinensis). IARC Monogr Eval Carcinog Risks Hum. 1994;61:121–175. | ||
Melling N, Hohenberger W, Yedibela S. Opisthorchiasis mimicking primary biliary cirrhosis as an indication for liver transplantation. J Hepatol. 2009;50(5):1057–1059. | ||
Sripa B, Mairiang E, Thinkhamrop B, et al. Advanced periductal fibrosis from infection with the carcinogenic human liver fluke Opisthorchis viverrini correlates with elevated levels of IL-6. Hepatology. 2009;50(4):1273–1281. | ||
Heilmaier C, Lutz AM, Bolog N, Weishaupt D, Seifert B, Willmann JK. Focal liver lesions: detection and characterization at double-contrast liver MR imaging with ferucarbotran and gadobutrol versus single-contrast liver MR imaging. Radiology. 2009;253(3):724–733. | ||
Geraldes CF, Laurent S. Classification and basic properties of contrast agents for magnetic resonance imaging. Contrast Media Mol Imaging. 2009;4(1):1–23. | ||
Haddad MC, Abd EI, Bagi ME, Tamraz JE. Imaging of Parasitic Diseases. Berlin, Heidelberg: Springer-Verlag; 2008. | ||
Noone TC, Semelka RC, Chaney DM, Reinhold C. Abdominal imaging studies: comparison of diagnostic accuracies resulting from ultrasound, computed tomography, and magnetic resonance imaging in the same individual. Magn Reson Imaging. 2004;22(1):19–24. | ||
Gandhi SN, Brown MA, Wong JG, Aguirre DA, Sirlin SB. MRI contrast agents for liver imaging: what, when, how. Radiographics. 2006;26(6):1621–1636. | ||
Xie J, Liu G, Eden H, Ai H, Chen X. Surface-engineered magnetic nanoparticle platforms for cancer imaging and therapy. Acc Chem Res. 2011;44(10):883–892. | ||
Faria SC, Ganesan K, Mwangi I, et al. MR imaging of liver fibrosis: current state of the art. Radiographics. 2009;29(6):1615–1635. | ||
Singh N, Jenkins GJS, Asadi R, Doak SH. Potential toxicity of superparamagnetic iron oxide nanoparticles (SPION). Nano Rev. 2010;1. | ||
Jin R, Lin B, Li D, Ai H. Superparamagnetic iron oxide nanoparticles for MR imaging and therapy: design considerations and clinical applications. Curr Opin Pharmacol. 2014;18:18–27. | ||
Wang YX. Superparamagnetic iron oxide based MRI contrast agents: current status of clinical application. Quant Imaging Med Surg. 2011;1(1):35–40. | ||
Estelrich J, Sánchez-Martín MJ, Busquets MA. Nanoparticles in magnetic resonance imaging: from simple to dual contrast agents. Int J Nanomedicine. 2015;10:1727–1741. | ||
Wang YX, Xuan S, Port M, Idee J-M. Recent advances in superparamagnetic iron oxide nanoparticles for cellular imaging and targeted therapy research. Curr Pharm Des. 2013;19(37):6575–6593. | ||
Reddy LH, Arias JL, Nicolas J, Couvreur P. Magnetic nanoparticles: design and characterization, toxicity and biocompatibility, pharmaceutical and biomedical applications. Chem Rev. 2012;112: 5818–5878. | ||
Laurent S, Forge D, Port M, et al. Magnetic iron oxide nanoparticles: synthesis, stabilization, vectorization, physicochemical characterizations, and biological applications. Chem Rev. 2008;108:2064–2110. | ||
Veiseh O, Gunn JW, Zhang M. Design and fabrication of magnetic nanoparticles for targeted drug delivery and imaging. Adv Drug Deliv Rev. 2010;62(3):284–304. | ||
Sanchez C, Belleville P, Popall M, Nicole L. Applications of advanced hybrid organic–inorganic nanomaterials: from laboratory to market. Chem Soc Rev. 2011;40(2):696–753. | ||
Yamaura M, Camilo RL, Sampaio LC, Macêdo MA, Nakamurad M, Toma HE. Preparation and characterization of (3-aminopropyl)triethoxysilane-coated magnetite nanoparticles. J Magn Magn Mater. 2004;279(2–3):210–217. | ||
Bini RA, Marques RFC, Santos FJ, Chaker A, Jafelicci M Jr. Synthesis and functionalization of magnetite nanoparticles with different amino-functional alkoxysilanes. J Magn Magn Mater. 2012;324(4):534–539. | ||
Galeotti F, Bertini F, Scavia G, Bolognesi A. A controlled approach to iron oxide nanoparticles functionalization for magnetic polymer brushes. J Colloid Interface Sci. 2011;360(2):540–547. | ||
del Campo A, Sen T, Lellouche J, Bruce IJ. Multifunctional magnetite and silica-magnetite nanoparticles: synthesis, surface activation and applications in life sciences. J Magn Magn Mater. 2005;293(1):33–40. | ||
Rümenapp C, Gleich B, Mannherz HG, Haase A. Detection of molecules and cells using nuclear magnetic resonance with magnetic nanoparticles. J Magn Magn Mater. 2015;380:271–275. | ||
Demin AM, Krasnov VP, Charushin VN. Covalent surface modification of Fe3O4 magnetic nanoparticles with alkoxy silanes and amino acids. Mendeleev Commun. 2013;23(1):1–3. | ||
De Palma R, Peeters S, Van Bael MJ, et al. Silane ligand exchange to make hydrophobic superparamagnetic nanoparticles water-dispersible. Chem Mater. 2007;19:1821–1831. | ||
Kalidasan V, Liu XL, Herng TS, Yang Y, Ding J. Bovine serum albumin-conjugated ferrimagnetic iron oxide nanoparticles to enhance the biocompatibility and magnetic hyperthermia performance. Nano Micro Lett. 2016;8(1):80–93. | ||
Lee SY, Ahn CY, Lee J, Lee JH, Chang JH. Rapid and selective separation for mixed proteins with thiol functionalized magnetic nanoparticles. Nanoscale Res Lett. 2012;7(1):279–284. | ||
Park JO, Rhee KY, Park SJ. Silane treatment of Fe3O4 and its effect on the magnetic and wear properties of Fe3O4/epoxy nanocomposites. Appl Surf Sci. 2010;256(23):6945–6950. | ||
Frickel N, Messing R, Gelbrich T, Schmidt AM. Functional silanes as surface modifying primers for the preparation of highly stable and well-defined magnetic polymer hybrids. Langmuir. 2010;26(4):2839–2846. | ||
Forge D, Laurent S, Gossuin Y, Roch A, Vander Elst L, Muller RN. An original route to stabilize and functionalize magnetite nanoparticles for theranosis application. J Magn Magn Mater. 2011;323(5):410–415. | ||
Pershina AG, Saltykova IV, Ivanov VV, et al. Hemozoin “knobs” in Opisthorchis felineus infected liver. Parasit Vectors. 2015;8:459. | ||
Riemer J, Hoepken HH, Czerwinska H, Robinson SR, Dringen R. Colorimetric ferrozine-based assay for the quantitation of iron in cultured cells. Anal Biochem. 2004;331(2):370–375. | ||
Mosmann T. Rapid colorimetric assay for cellular growth and survival: application to proliferation and cytotoxicity assays. J Immunol Methods. 1983;65(1–2):55–63. | ||
Chaimberg M, Cohen Y. Note on the silylation of inorganic oxide supports. J Colloid Interface Sci. 1990;134(2):576–579. | ||
Demin AM, Uimin MA, Shchegoleva NN, Yermakov AE, Krasnov VP. Surface modification of Fe3O4 magnetic nanoparticles with (S)-naproxen. Nanotechnol Russ. 2012;7(3):132–139. | ||
Demin AM, Vigorov AY, Nizova IA, et al. Functionalization of Fe3O4 magnetic nanoparticles with RGD peptide derivatives. Mendeleev Commun. 2014;24(1):20–22. | ||
Demin AM, Koryakova OV, Krasnov VP. Quantitatively determination of 3-aminopropylsilane on the surface of Fe3O4 nanoparticles by attenuated total reflection infrared spectroscopy. J Appl Spectrosc. 2014;81(4):565–569. | ||
Tantra R, Schulze P, Quincey P. Effect of nanoparticle concentration on zeta-potential measurement results and reproducibility. Particuology. 2010;8(3):279–285. | ||
Briley-Saebo K, Bjørnerud A, Grant D, Ahlstrom H, Berg T, Kindberg GM. Hepatic cellular distribution and degradation of iron oxide nanoparticles following single intravenous injection in rats: implications for magnetic resonance imaging. Cell Tissue Res. 2004;316(3):315–323. | ||
Albiin N. MRI of focal liver lesions. Curr Med Imaging Rev. 2012;8(2):107–116. | ||
Reimer P, Tombach B. Hepatic MRI with SPIO: detection and characterization of focal liver lesions. Eur Radiol. 1998;8(7):1198–1204. | ||
Jun YW, Lee JH, Cheon J. Chemical design of nanoparticle probes for high-performance magnetic resonance imaging. Angew Chem Int Ed Engl. 2008;47(28):5122–5135. | ||
Hahn PF, Stark DD, Lewis JM, et al. First clinical trial of a new superparamagnetic iron oxide for use as an oral gastrointestinal contrast agent in MR imaging. Radiology. 1990;175(3):695–700. | ||
Wang YX, Hussain SM, Krestin GP. Superparamagnetic iron oxide contrast agents: physicochemical characteristics and applications in MR imaging. Eur Radiol. 2001;11(11):2319–2331. | ||
Berry CC, Wells S, Charles S, Curtis AS. Dextran and albumin derivatised iron oxide nanoparticles: influence on fibroblasts in vitro. Biomaterials. 2003;24(25):4551–4557. | ||
Kalambur VS. Biotransport of Iron Oxide Magnetic Nanoparticles for Biomedical Applications. Ann Arbor, MI: ProQuest; 2007. | ||
Jaganathan H, Hugar DL, Ivanisevic A. Examining MRI contrast in three-dimensional cell culture phantoms with DNA-templated nanoparticle chains. ACS Appl Mater Interfaces. 2011;3(4):1282–1288. | ||
Goodman CM, McCusker CD, Yilmaz T, Rotello VM. Toxicity of gold nanoparticles functionalized with cationic and anionic side chains. Bioconjug Chem. 2004;15(4):897–900. | ||
Souris JS, Lee C-H, Cheng S-H, et al. Surface charge-mediated rapid hepatobiliary excretion of mesoporous silica nanoparticles. Biomaterials. 2010;31(21):5564–5574. | ||
Vogl TJ, Hammerstingl R, Schwarz W, et al. Superparamagnetic iron oxide-enhanced versus gadolinium-enhanced MR imaging for differential diagnosis of focal liver lesions. Radiology. 1996;198(3):881–887. | ||
Wynn TA, Vannella KM. Macrophages in tissue repair, regeneration, and fibrosis. Immunity. 2016;44(3):450–462. | ||
Tomioka M, Iinuma H, Okinaga K. Impaired Kupffer cell function and effect of immunotherapy in obstructive jaundice. J Surg Res. 2000;92(2):276–282. | ||
Hanpanicha P, Pinlaorb S, Charoensuk L, et al. MRI and 1H MRS evaluation for the serial bile duct changes in hamsters after infection with Opisthorchis viverrini. Magn Res Imag. 2013;31(8):1418–1425. |
 © 2016 The Author(s). This work is published and licensed by Dove Medical Press Limited. The full terms of this license are available at https://www.dovepress.com/terms.php and incorporate the Creative Commons Attribution - Non Commercial (unported, v3.0) License.
By accessing the work you hereby accept the Terms. Non-commercial uses of the work are permitted without any further permission from Dove Medical Press Limited, provided the work is properly attributed. For permission for commercial use of this work, please see paragraphs 4.2 and 5 of our Terms.
© 2016 The Author(s). This work is published and licensed by Dove Medical Press Limited. The full terms of this license are available at https://www.dovepress.com/terms.php and incorporate the Creative Commons Attribution - Non Commercial (unported, v3.0) License.
By accessing the work you hereby accept the Terms. Non-commercial uses of the work are permitted without any further permission from Dove Medical Press Limited, provided the work is properly attributed. For permission for commercial use of this work, please see paragraphs 4.2 and 5 of our Terms.