Back to Journals » Cancer Management and Research » Volume 14
1H-NMR Based Metabolomics Technology Identifies Potential Serum Biomarkers of Colorectal Cancer Lung Metastasis in a Mouse Model
Authors Zhang J, Du Y, Zhang Y, Xu Y, Fan Y, Li Y ![]()
Received 22 November 2021
Accepted for publication 28 March 2022
Published 14 April 2022 Volume 2022:14 Pages 1457—1469
DOI https://doi.org/10.2147/CMAR.S348981
Checked for plagiarism Yes
Review by Single anonymous peer review
Peer reviewer comments 2
Editor who approved publication: Dr Sanjeev K. Srivastava
Junfei Zhang,1,* Yuanxin Du,2,3,* Yongcai Zhang,4 Yanan Xu,5 Yanying Fan,2,3 Yan Li2,3
1Shanxi Provincial People’s Hospital Affiliated to Shanxi Medical University, Taiyuan, 030001, People’s Republic of China; 2Department of Pharmacology, Basic Medical Sciences Center, Shanxi Medical University, Taiyuan, 030001, People’s Republic of China; 3Key Laboratory of Cellular Physiology, Ministry of Education, Shanxi Medical University, Taiyuan, 030001, People’s Republic of China; 4First Hospital of Shanxi Medical University, Taiyuan, 030001, People’s Republic of China; 5Medical Imaging Department of Shanxi Medical University, Taiyuan, 030001, People’s Republic of China
*These authors contributed equally to this work
Correspondence: Yan Li; Yanying Fan, Department of Pharmacology, Basic Medical Sciences Center, Key Laboratory of Cellular Physiology, Ministry of Education, Shanxi Medical University, 56#, Xin Jian South Road, Taiyuan, Shanxi Province, 030001, People’s Republic of China, Email [email protected]; [email protected]
Background: Lung metastasis is a common metastasis site of colorectal cancer which largely reduces the quality of life and survival rates of patients. The discovery of potential novel diagnostic biomarkers is very meaningful for the early diagnosis of colorectal cancer with lung metastasis.
Methods: In the present study, the metabonomic profiling of serum samples of lung metastasis mice was analyzed by 1H-nuclear magnetic resonance (1H-NMR). Principal component analysis (PCA), partial least squares discriminant analysis (PLS-DA), and orthogonal partial least squares discriminant analysis (OPLS-DA) were used to elucidate the distinguishing metabolites between different groups, and all achieved excellent separations, which indicated that metastatic mice could be differentiated from control mice based on the metabolic profiles at serum levels. Furthermore, during lung metastasis of colorectal cancer, metabolic phenotypes changed significantly, and some of metabolites were identified.
Results: Among these metabolites, approximately 15 were closely associated with the lung metastasis process. Pathway enrichment analysis results showed deregulation of metabolic pathways participating in the process of lung metastasis, such as synthesis and degradation of ketone bodies pathway, amino acid metabolism pathway and pyruvate metabolism pathway.
Conclusion: The present study demonstrated the metabolic disturbances of serum samples of mice during the lung metastasis process of colorectal cancer and provides potential diagnostic biomarkers for the disease.
Keywords: colorectal cancer, metastasis, metabolomics, biomarkers, 1H-NMR
Introduction
Colorectal cancer is the third most common cancer and the third leading cause of cancer-related deaths globally.1 Most advanced colorectal cancer patients developed metastasis, and a large part eventually develop lung metastasis.2 Early detection of lung metastasis is critical for improving the treatment effect and survival rate of colorectal cancer patients, as the early spread of cancer cells is usually not detected by traditional imaging technologies. Thus, the discovery of novel and reliable biomarkers during the lung metastasis process of colorectal cancer patients may be an effective means to diagnose early cancer metastasis.
A reliable diagnostic biomarker is a characteristic that hints the presence of a disease or indicates an individual with a subtype of the disease.3 Blood is a type of body fluid in which blood-based biomarkers are most suitable for the early diagnosis and surveillance of cancer because samples can be obtained easily with little damage to the patient.4 Therefore, many studies have focused on the discovery of blood biomarkers for cancer diagnosis. Using a combination of 1H NMR and DI-LC-MS/MS, the serum levels of DL-carnitine, PC-aa-C40:3, ethanol, octanoyl-L-carnitine, and methylmalonyl-L-carnitine were found to be related to melanoma progression.5 Yang et al identified 18 metabolites closely related to ovarian cancer, and these biomarker enrichment in fatty acid β-oxidation pathway, phospholipid metabolism pathway, and bile acid metabolism pathway.6 Yu et al analyzed 127 colorectal cancer serum samples and 90 normal serum samples using mass spectrometry, and found serine/threonine kinase 4 (MST1) was down regulated in CRC patients’ samples compared to the control group.7 They further proved that MST1 is a potential marker for distant metastasis of CRC.7 Fan et al found that serum levels of SERPINA1 (alpha-1-antitrypsin, A1AT), SERPINA3 (alpha-1-antichymotrypsin, AACT), and SERPINC1 (antithrombin-3, AT-III) could be good biomarkers to distinguish adenomatous polyps and colorectal carcinomas.8 In conclusion, the identification of serum biomarkers related to cancer progression would benefit the diagnosis and treatment of cancer.
Metabolomics, is a discipline which developed rapidly in recent years.9 It mainly investigated the quantities, types and changes of endogenous metabolites in biological systems such as blood, urine, and tissues by the application of newly developed analytical methods.10 Metabolomics is now widely used in the diagnosis of disease11,12 and biomarker screening.13,14 Nuclear magnetic resonance (NMR) is a kind of analytical methods which is a noninvasive technique15 and an invaluable tool for determining the structure, composition and function of complex biological molecules.16 NMR analytics have high sensitivity, good reproducibility and simple sample processing,17 which has been used for biomarker detection in several human tumors including lung cancer,18,19 oral squamous cell carcinoma,20,21 and gastric cancer.22,23 Using NMR-based metabolomics, hippurate and trigonelline were found to be downregulated in lung cancer patients, while α-hydroxyisobutyrate, β-hydroxyisovalerate, creatinine and N-acetylglutamine were upregulated.24 Additionally, 2-Hydroxyisobutyrate, 3-indoxylsulfate, and alanine were shown to be diagnostic biomarkers for gastric cancer, benign gastric disease and healthy patients.23 In addition, NMR-based serum metabolomics reveals 8 differentially expressed biomarkers such as glutamine, acetate, propionate, acetone, and choline could discriminate oral cancer from healthy people.21 This research indicated the valuable potential of NMR-based metabolomics for cancer diagnosis and treatment.
Although we previously detected differential metabolites in lung tissue from a lung metastasis model of colorectal cancer,25 it is still difficult to extract tumor tissues for early biomarker identification. Blood from patients is more readily available and less invasive than tumor tissues, and furthermore research is necessary and reliable serum biomarkers need to be discovered as soon as possible. In our study, we performed serum metabolomics of a murine colorectal cancer with lung metastasis model using 1H-NMR. We found that some metabolites were closely related to tumor metastasis progression such as lactate, creatine, acetate, and glutamate. The altered serum metabolites were mainly involved in glycerophospholipid metabolism, amino acid metabolism and glycolysis. Therefore, research which investigated these potential serum biomarkers will benefit the diagnosis of colorectal patients with lung metastasis.
Materials and Methods
Chemical Reagents
Deionized water was prepared by a Milli-Q purification system. Sodium 3-(trimethylsilyl)-1-propanesulfonate (TSP) was purchased from Sigma-Aldrich (St. Louis, MO, USA). Chloroform (CDCl3) and methanol were purchased from Fisher Scientific (Fairlawn, NJ, USA). Deuterium oxide (99.8% D2O) was obtained from CIL (Cambridge Isotope Laboratories, USA).
Cell Culture
The mouse CT26 cell (colorectal cancer cell line) was purchased from the American Type Culture Collection (ATCC; Manassas, VA, USA). Cells were cultured in RPMI-1640 media supplemented with 10% fetal bovine serum (HyClone), 100 μg/mL streptomycin (Sigma-Aldrich, USA) and 100 U/mL penicillin (Sigma-Aldrich, USA) at 37°C in a humidified atmosphere containing 5% CO2.
Animals and Lung Metastasis Model
A total of 40 Female BALB/c mice were purchased from the Beijing Animal Center (Beijing, China). The age of the mice was about 6–8 weeks and all were SPF grade. The animals were kept at 21°C and 55% humidity, on a 12 h of light and 12 h of darkness cycle. All animals were free to take food and water and kept in standard conditions allowing free activity. All procedures were carried out in accordance with the “Chinese Guiding Principles in the Care and Use of Animals” and were approved by the Animal Ethics Committee of Shanxi Medical University (P2018-166). CT26 need to be passaged 3 to 4 times stably before use. Mice were randomized into several groups: control group, 7 days metastasis group, 14 days metastasis group and 21 days metastasis group. Each mice of control group were injected with saline through the tail vein. Mice in the experimental group were injected with tumor cells (2x10⁶ cells/mouse). The PBS buffer solution was used to suspend the CT26 cells for injection. Animal health and weight were monitored every 3 days. Ultimately, 33 mice were successfully modeled for the experiment. At the end of experiment, there were 8 animals in control group, 10 animals in 7 days metastasis group, 9 in 14 days metastasis group and 6 mice in 21 days metastasis group.
Sample Collection and Preparation
Animals were anesthetized with chloral hydrate and blood samples were collected by eyeball method. About 100 μL blood of each animal was sampled from mice eyes and then stored separately at room temperature for 30 min before coagulation. Mice were sacrificed by cervical dislocation at 0, 7, 14 and 21 days after cell injection separately, and the lung tissues were dissected and preserved in 4% paraformaldehyde for H&E staining. Clotted blood samples were centrifuged at 4°C, 3000 × g for 20 min, and the supernatant was immediately frozen in liquid nitrogen for subsequent experiments. Serum samples were thawed at 4°C for 2 h and kept at room temperature for 1 h. Then, 300 µL of samples were mixed with 600 µL of PBS (pH = 7.4) containing 10% D2O and 0.01 mg/mL sodium TSP as internal standard. Finally, the samples were centrifuged at 12,000× g at 4°C for 5 min. Then, the supernatant was taken to a new NMR tube for spectroscopy.
1H-NMR spectroscopic analysis
1H-NMR spectroscopy analysis of serum samples was carried out by Bruker Avance II 600 spectrometer (Bruker BioSpin, Rheinstetten, Germany) at 300 K. To suppress the water signal, a one-dimensional spectrum was acquired using a standard (1D) Carr-Purcell-Meiboom-Gill (CPMG) pulse sequence. Spectral width was 12,335.5-Hz, acquisition time was 2.66 sec and a total pulse recycle delay was 7.66 sec. 64 free induction decays (FIDs) were collected into 64 K data points. The FIDs were weighted by a Gaussian function with a line-broadening factor of 20.3 Hz, Gaussian maximum position 0.1, prior to Fourier transformation.
1H-NMR spectral data processing
NMR data were manually Fourier transformed for spectroscopy using MestReNova software to reduce the complexity of data and benefit pattern recognition. Then, the phase and baseline distortions were corrected in MestReNova software, and the TSP resonance of δ0.0 was referenced. The spectrum ranges from 9.5 to 0.5 ppm and was divided into 4500 segments. To exclude the water signal, the region from 5.1 ppm to 4.7 ppm was removed. Due to the different weights of the samples, the data were normalized before pattern recognition analysis.
Pattern Recognition (PR) Analysis
The normalized NMR spectrum data were imported into SIMCA-P (version 11, Umetrics AB) for analysis. Principal component analysis (PCA) was applied to analyze the NMR data and separate the serum samples from the lung metastasis groups and the normal group. Supervised PR methods such as orthogonal partial least squares discriminant analysis (OPLS-DA) and partial least squares discriminant analysis (PLS-DA) were used to detect the separation of different groups. The PLS-DA models were validated 200 times by a permutation analysis. To guard against overfitting, the default 7-round of cross-validation was used, with 1/7 of the samples excluded from the mathematical model in each round. R2 and Q2 values were obtained from the PLS-DA models. To determine the variables assigned between metastasis and normal groups, the variable-importance (VIP) values of all peaks obtained from the OPLS-DA model were analyzed. In addition, we used the unpaired Student’s t-test to determine the significance of the metabolites. Metabolites were identified according to the Human Metabolome Database (HMDB, http://www.hmdb.ca/) and previous literature. The standard one-dimensional spectrum was applied to provide an overview of metabolites between different groups. MetaboAnalyst was used to discover the changing metabolic pathways.
Histological Analysis and H&E Staining
The remaining lung tissue specimens were preserved in 4% paraformaldehyde and hematoxylin and eosin (H&E) staining was used for routine histological analysis to observe micro-morphology of tumor in lungs.
Results
Metabolic Profiling of Serum Samples
CT26 cells were injected into the tail vein of BALB/c mice of treated groups to construct the metastasis model, while the normal group was injected with saline. At the first day of the experiment, lung specimens of the normal group were collected. The lung tissues of treated groups were collected separately at 7, 14 and 21 days after cell injection. The results showed lung metastasis model was successfully constructed (Supplementary Figure). The collected serum samples were extracted and the water phase components were investigated. The representative 1H-NMR spectra of serum samples of different groups are shown in Figure 1. As shown in Figure 1, a series of metabolites were changed in the metastatic group compared to the normal group. Distinguished metabolites include acetate, lactate, choline, glycine, arginine, pyruvate, isoleucine, creatine, glutamate, and alanine, which are major components of metabolic processes such as glycolysis pathway and amino acid metabolism pathway.
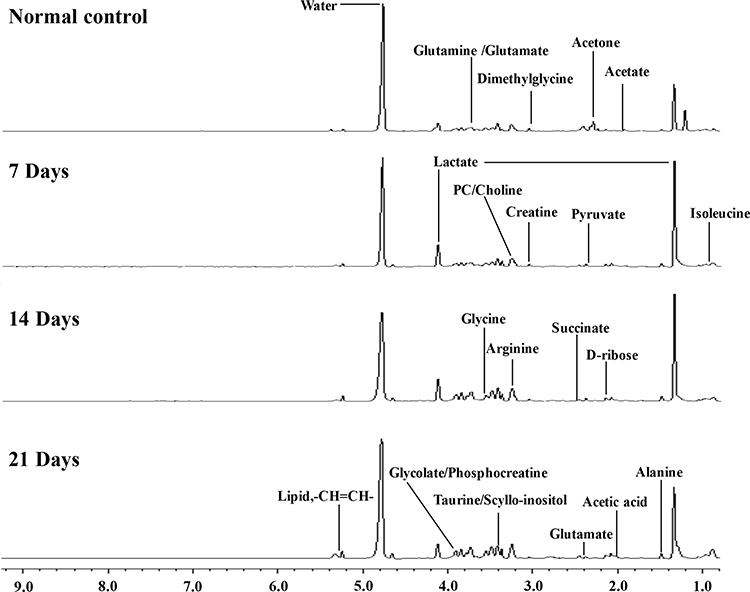 |
Figure 1 Representative 1H-NMR spectra (δ9.5-δ0.5) of serum samples of different groups at 600 MHz Normal control; 7 days after administration; 14 days after administration; 21 days after administration. |
PR Analysis of Normal and Metastasis Groups
To identify the differential metabolites between the normal and metastatic groups, PCA was utilized to perform 1H-NMR data analysis. The score plot of PCA indicated that the 7, 14, and 21 days metastatic groups were significantly distinguished from the normal group (Figure 2A). To optimize the separation between the normal and metastasis groups, PLS-DA analysis and OPLS-DA analysis were utilized to visualize the metabolic differences. The score plot of PC1 and PC2 of PLS-DA and OPLS-DA analysis indicated the normal group was well separated from the metastatic groups (Figure 2B and C). In addition, the PLS-DA model was used for permutation analysis to obtain statistical validation. The R2 value represents the explained variation of the model, while the Q2 value represents the predictive capability. We found the R2 (0.80) and Q2 (0.72) values were high, which demonstrated that the model possessed good predictive ability or the ability to identify differential metabolites (Figure 2D).
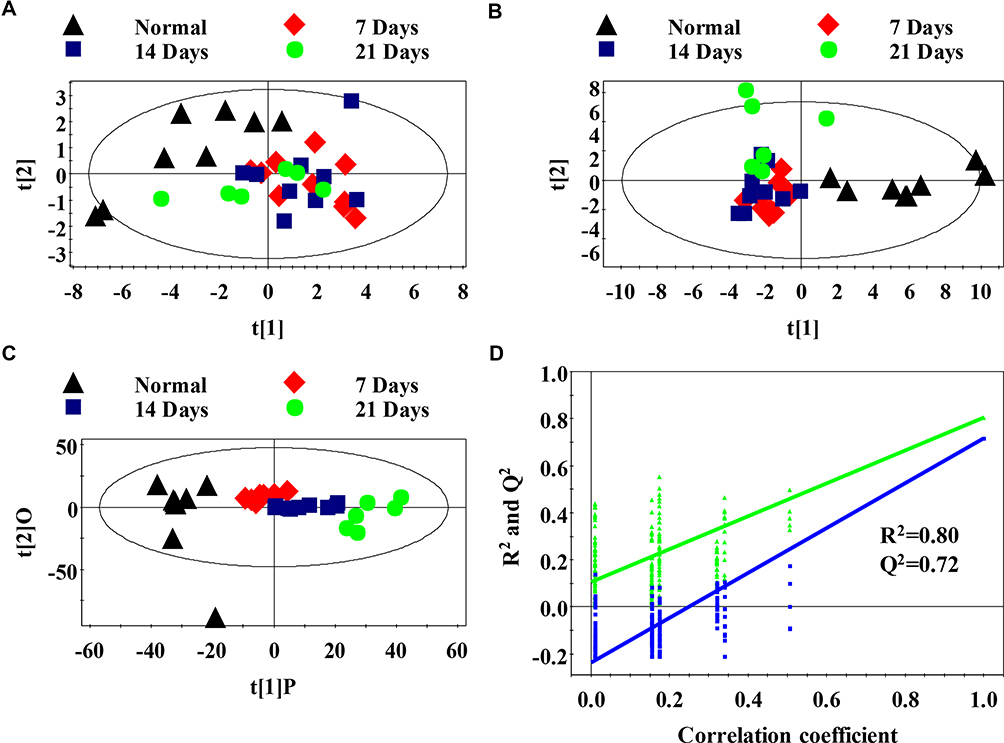 |
Figure 2 Metabolomics analysis of serum samples of the normal and metastasis groups (A) PCA scores plot between the metastatic groups and normal control; (B) PLS-DA scores plot between the metastatic groups and normal control; (C) OPLS-DA scores plot between the metastatic groups and normal control; (D) The PLS-DA model was statistically verified by permutation analysis (200 times). R2 represents explained variance, and Q2 represents the predictive ability of the model. |
Furthermore, OPLS-DA analysis was utilized to distinguish the metabolite differences between the normal group and the metastatic groups. As shown in Figure 3A, the score plots of metastatic groups were clearly distinguished from those of the normal group. The parameters of the different metastatic groups compared with the normal group were as follows: 7 days, R2=0.98, Q2=0.89; 14 days, R2=0.97, Q2=0.90; 21 days, R2=0.94, Q2=0.86 (Figure 3B). These results showed that the model was suitable for data analysis.
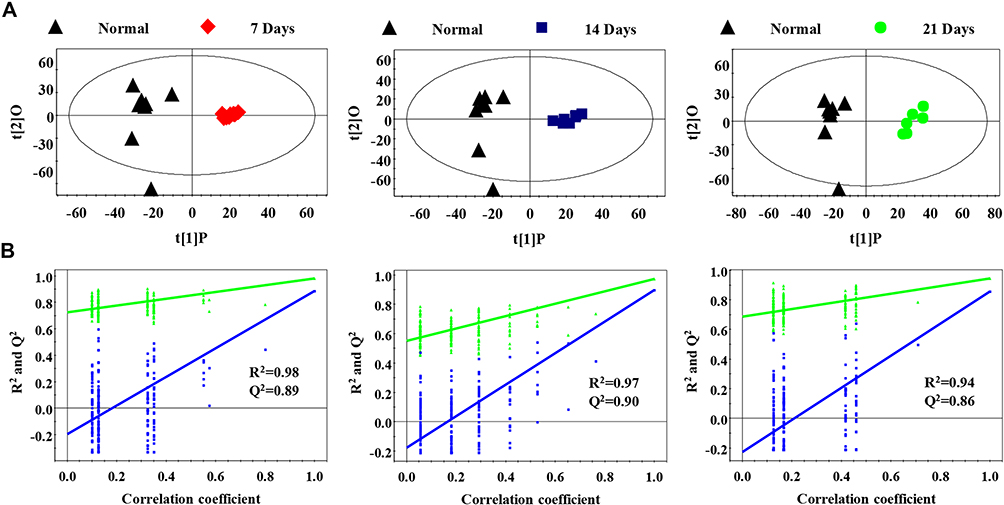 |
Figure 3 Serum PR analysis of different metastasis groups and normal control group (A) OPLS-DA model was used to process score plots based on the normal group and each metastasis group; (B) statistical validation of PLS-DA model by permutation analysis (200 times). R2 represents explained variance, and Q2 represents the predictive ability of the model. |
In order to identify distinguish metabolites between the normal and metastatic groups, OPLS-DA analysis was performed to obtain scores and loading plots with correlation coefficients based on the NMR data of serum samples. Then, significant differences of each metabolite were determined by unpaired Student’s t-test. The levels of acetic acid, VLDL: CH3-(CH2)n-, lactate, lipids,-CH=CH- and methylmalonate were significantly upregulated in the metastatic groups compared with the normal group (Table 1). The concentrations of acetate, creatine, D-ribose, phosphocreatine, succinate, and taurine were downregulated in the metastatic groups (Table 1).
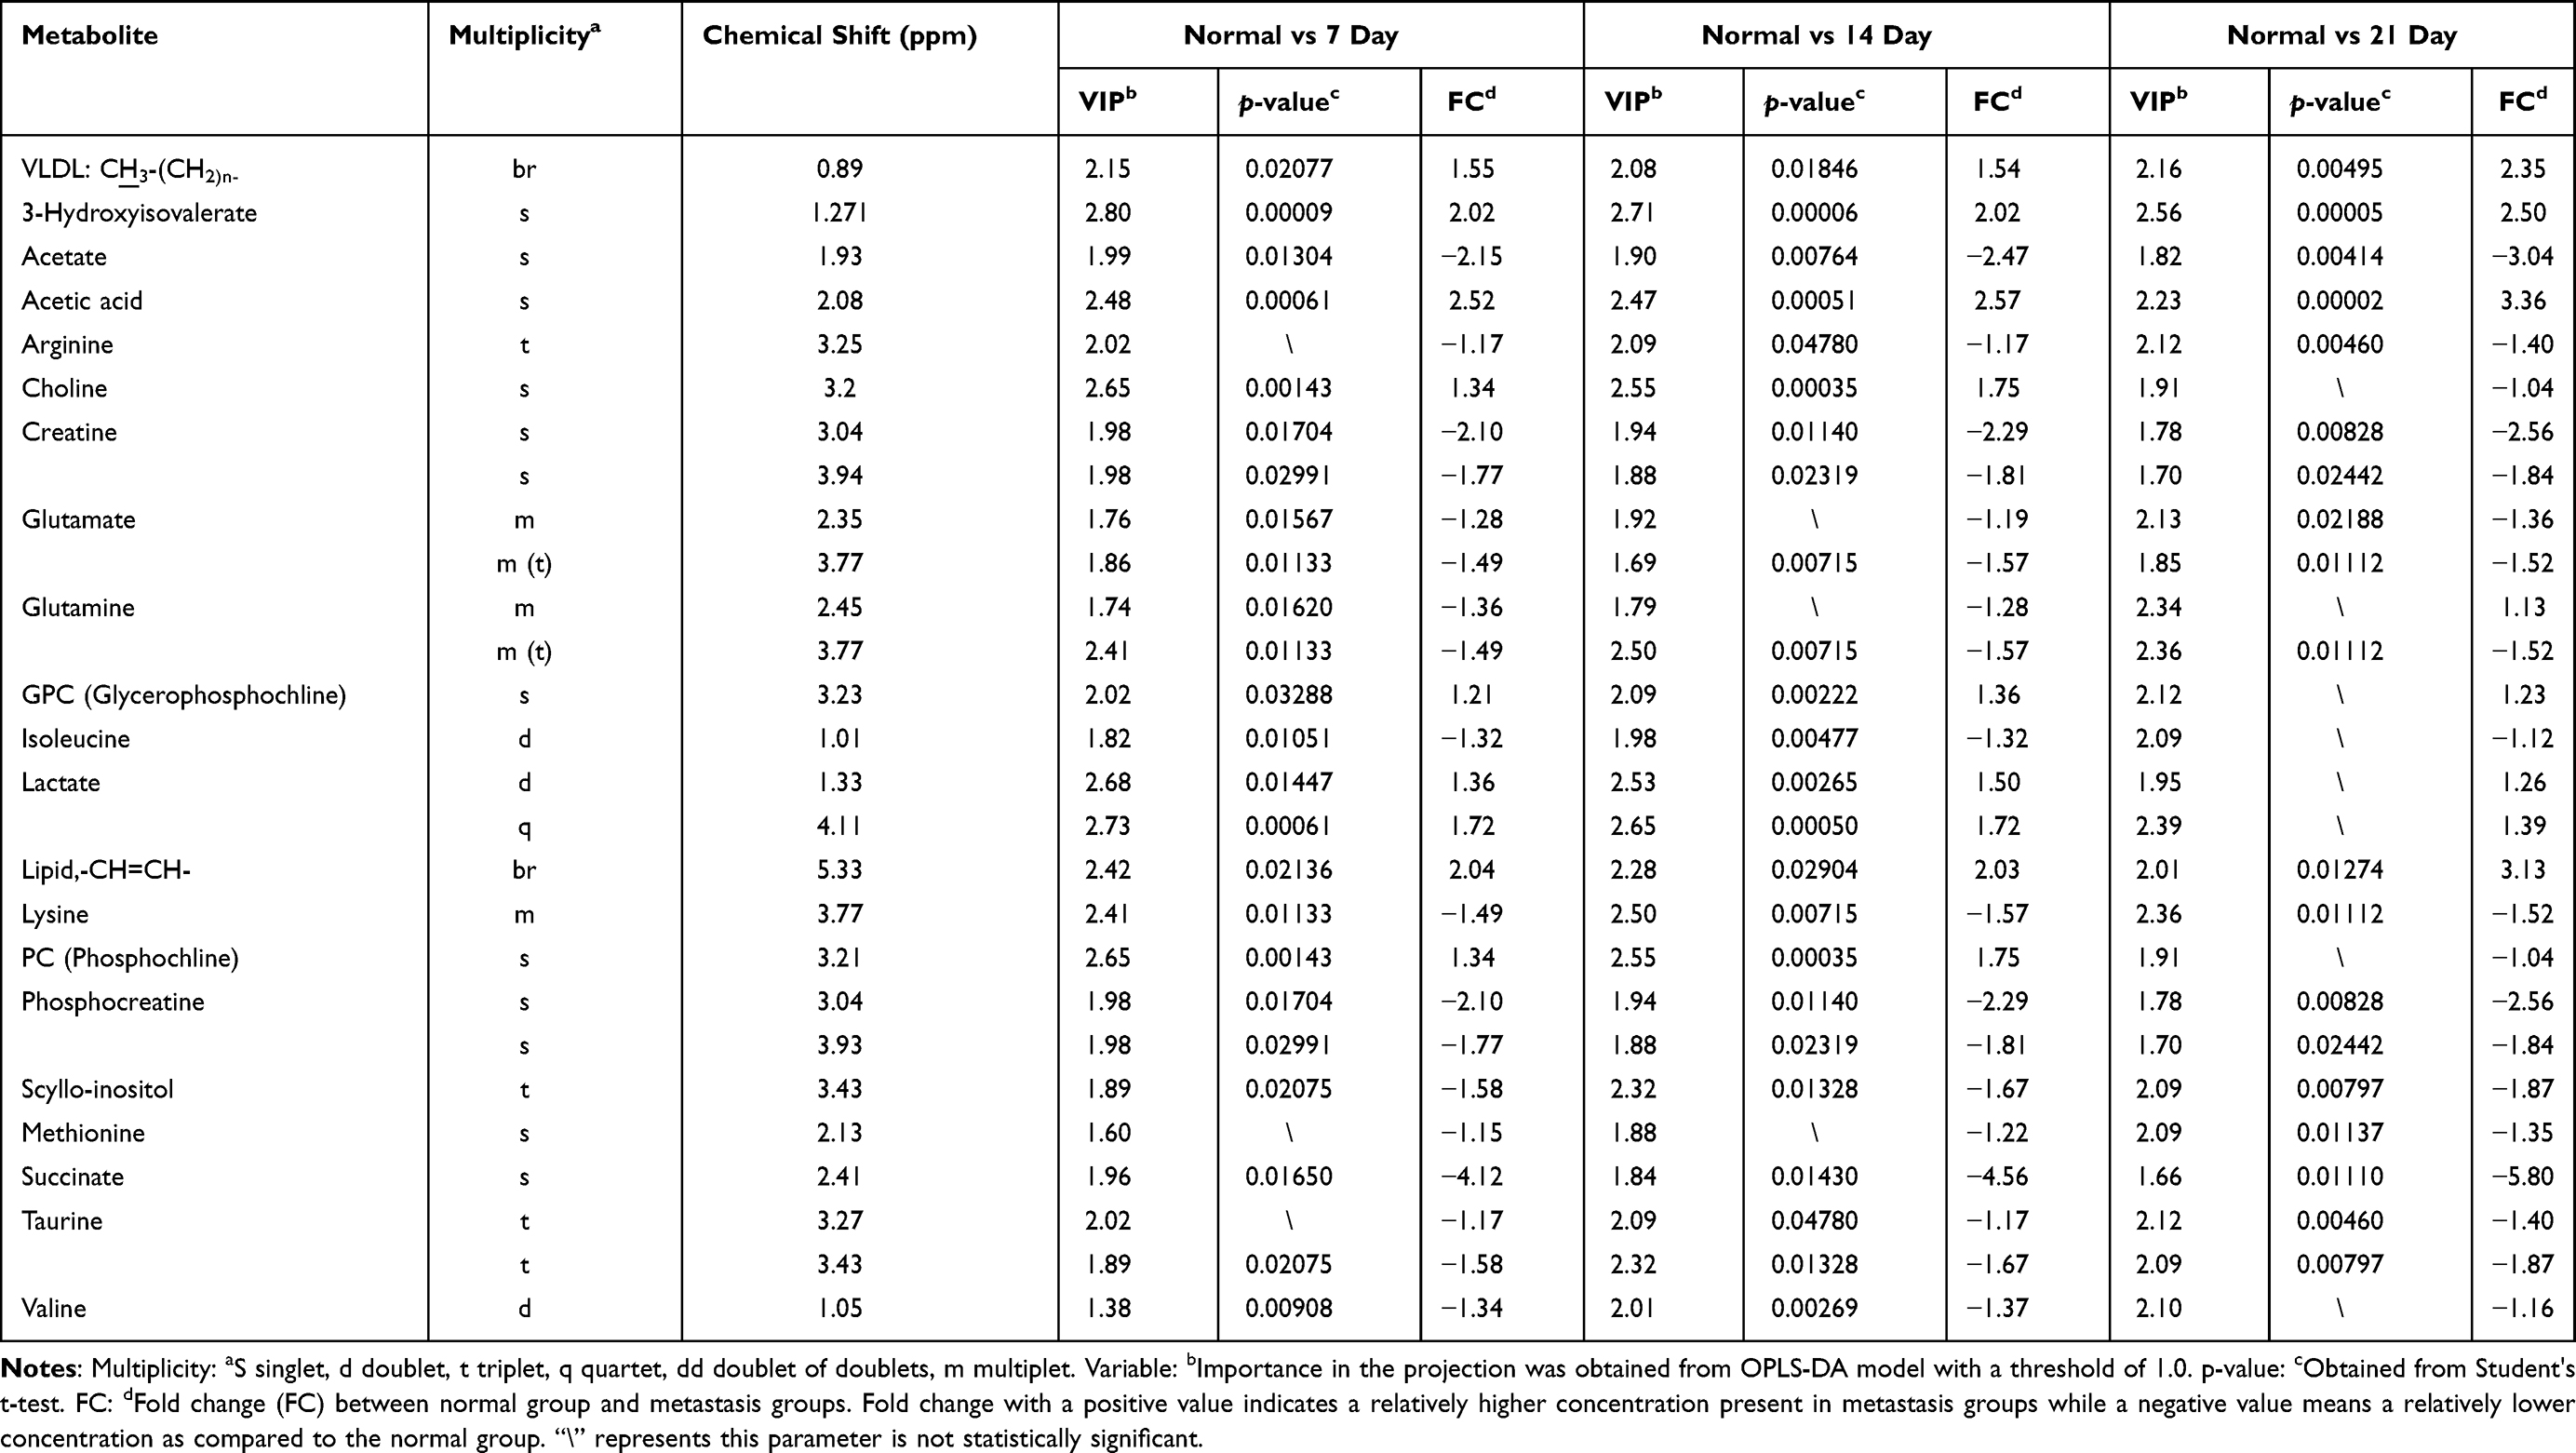 |
Table 1 Summary of Different Serum Metabolites Between Metastasis Groups and Normal Group |
Trending Markers and Dysregulated Pathways
Biomarkers are important molecules that could indicate abnormal processes taking place in your body. Thus, identifying biomarkers that are critical for the colorectal cancer metastasis process will benefit the diagnosis of cancer metastasis patients. To summarize main biomarkers affecting pathological process of lung metastasis of colorectal cancer, we used box-and-whisker plots including the extremes, concentration ranges and median quartiles to show representative differential metabolites between the normal and metastatic groups (Figure 4), and unpaired Student’s t-test was used to perform statistic difference. We found the lactate and acetic acid level increased significantly, while the creatine, acetate, lysine, phosphocreatine, glutamate and succinate level decreased (Figure 4).
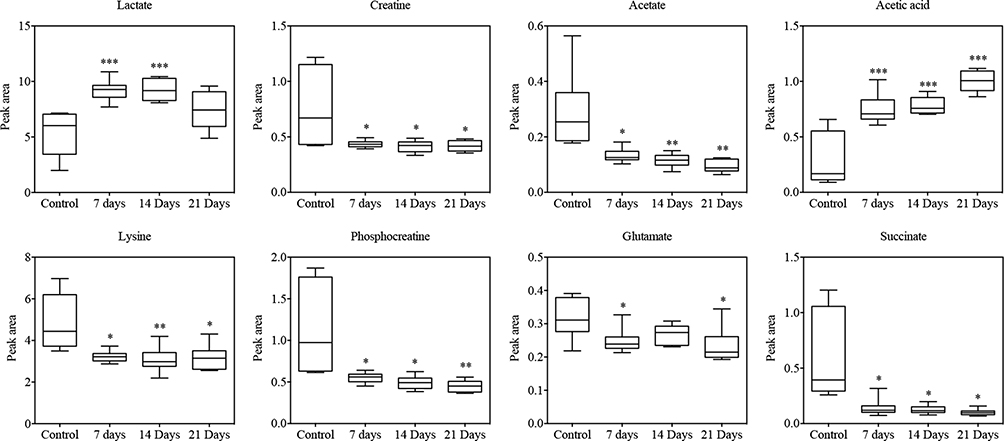 |
Figure 4 Box-and-whisker plots show differences between the normal control group and the metastatic groups. The Y-axis shows the relative abundance of the NMR signal (normalized to the total peak); median: horizontal line in the middle portion of the box; lower and upper quartile: bottom and top boundaries of boxes; whiskers, 5th and 95th percentiles; outliers: open circles; *p < 0.05, **p < 0.01, ***p < 0.001, unpaired Student’s t-test. |
We analyzed serum metabolomics by 1H-NMR techniques and then performed enrichment analysis using MetaboAnalyst online. We summarized the dysregulated pathways and the altered metabolites during the metastasis process (Table 2). Pathway analysis of those distinguishable metabolites (Table 1) indicated that significant dysregulated pathways included glycine, serine and threonine metabolism, pyruvate metabolism, starch and sucrose metabolism and alanine, synthesis and degradation of ketone bodies, aspartate and glutamate metabolism were associated with colorectal cancer lung metastasis (Figure 5). Among these altered pathways, we found eight compounds were involved in glycine, serine and threonine metabolism pathway, indicating that amino acid metabolism may be a critical pathway for colorectal cancer metastasis. In addition, glyoxylate and dicarboxylate metabolism pathway, alanine, aspartate and glutamate metabolism pathway and arginine and proline metabolism pathway may also be important pathways for metastasis.
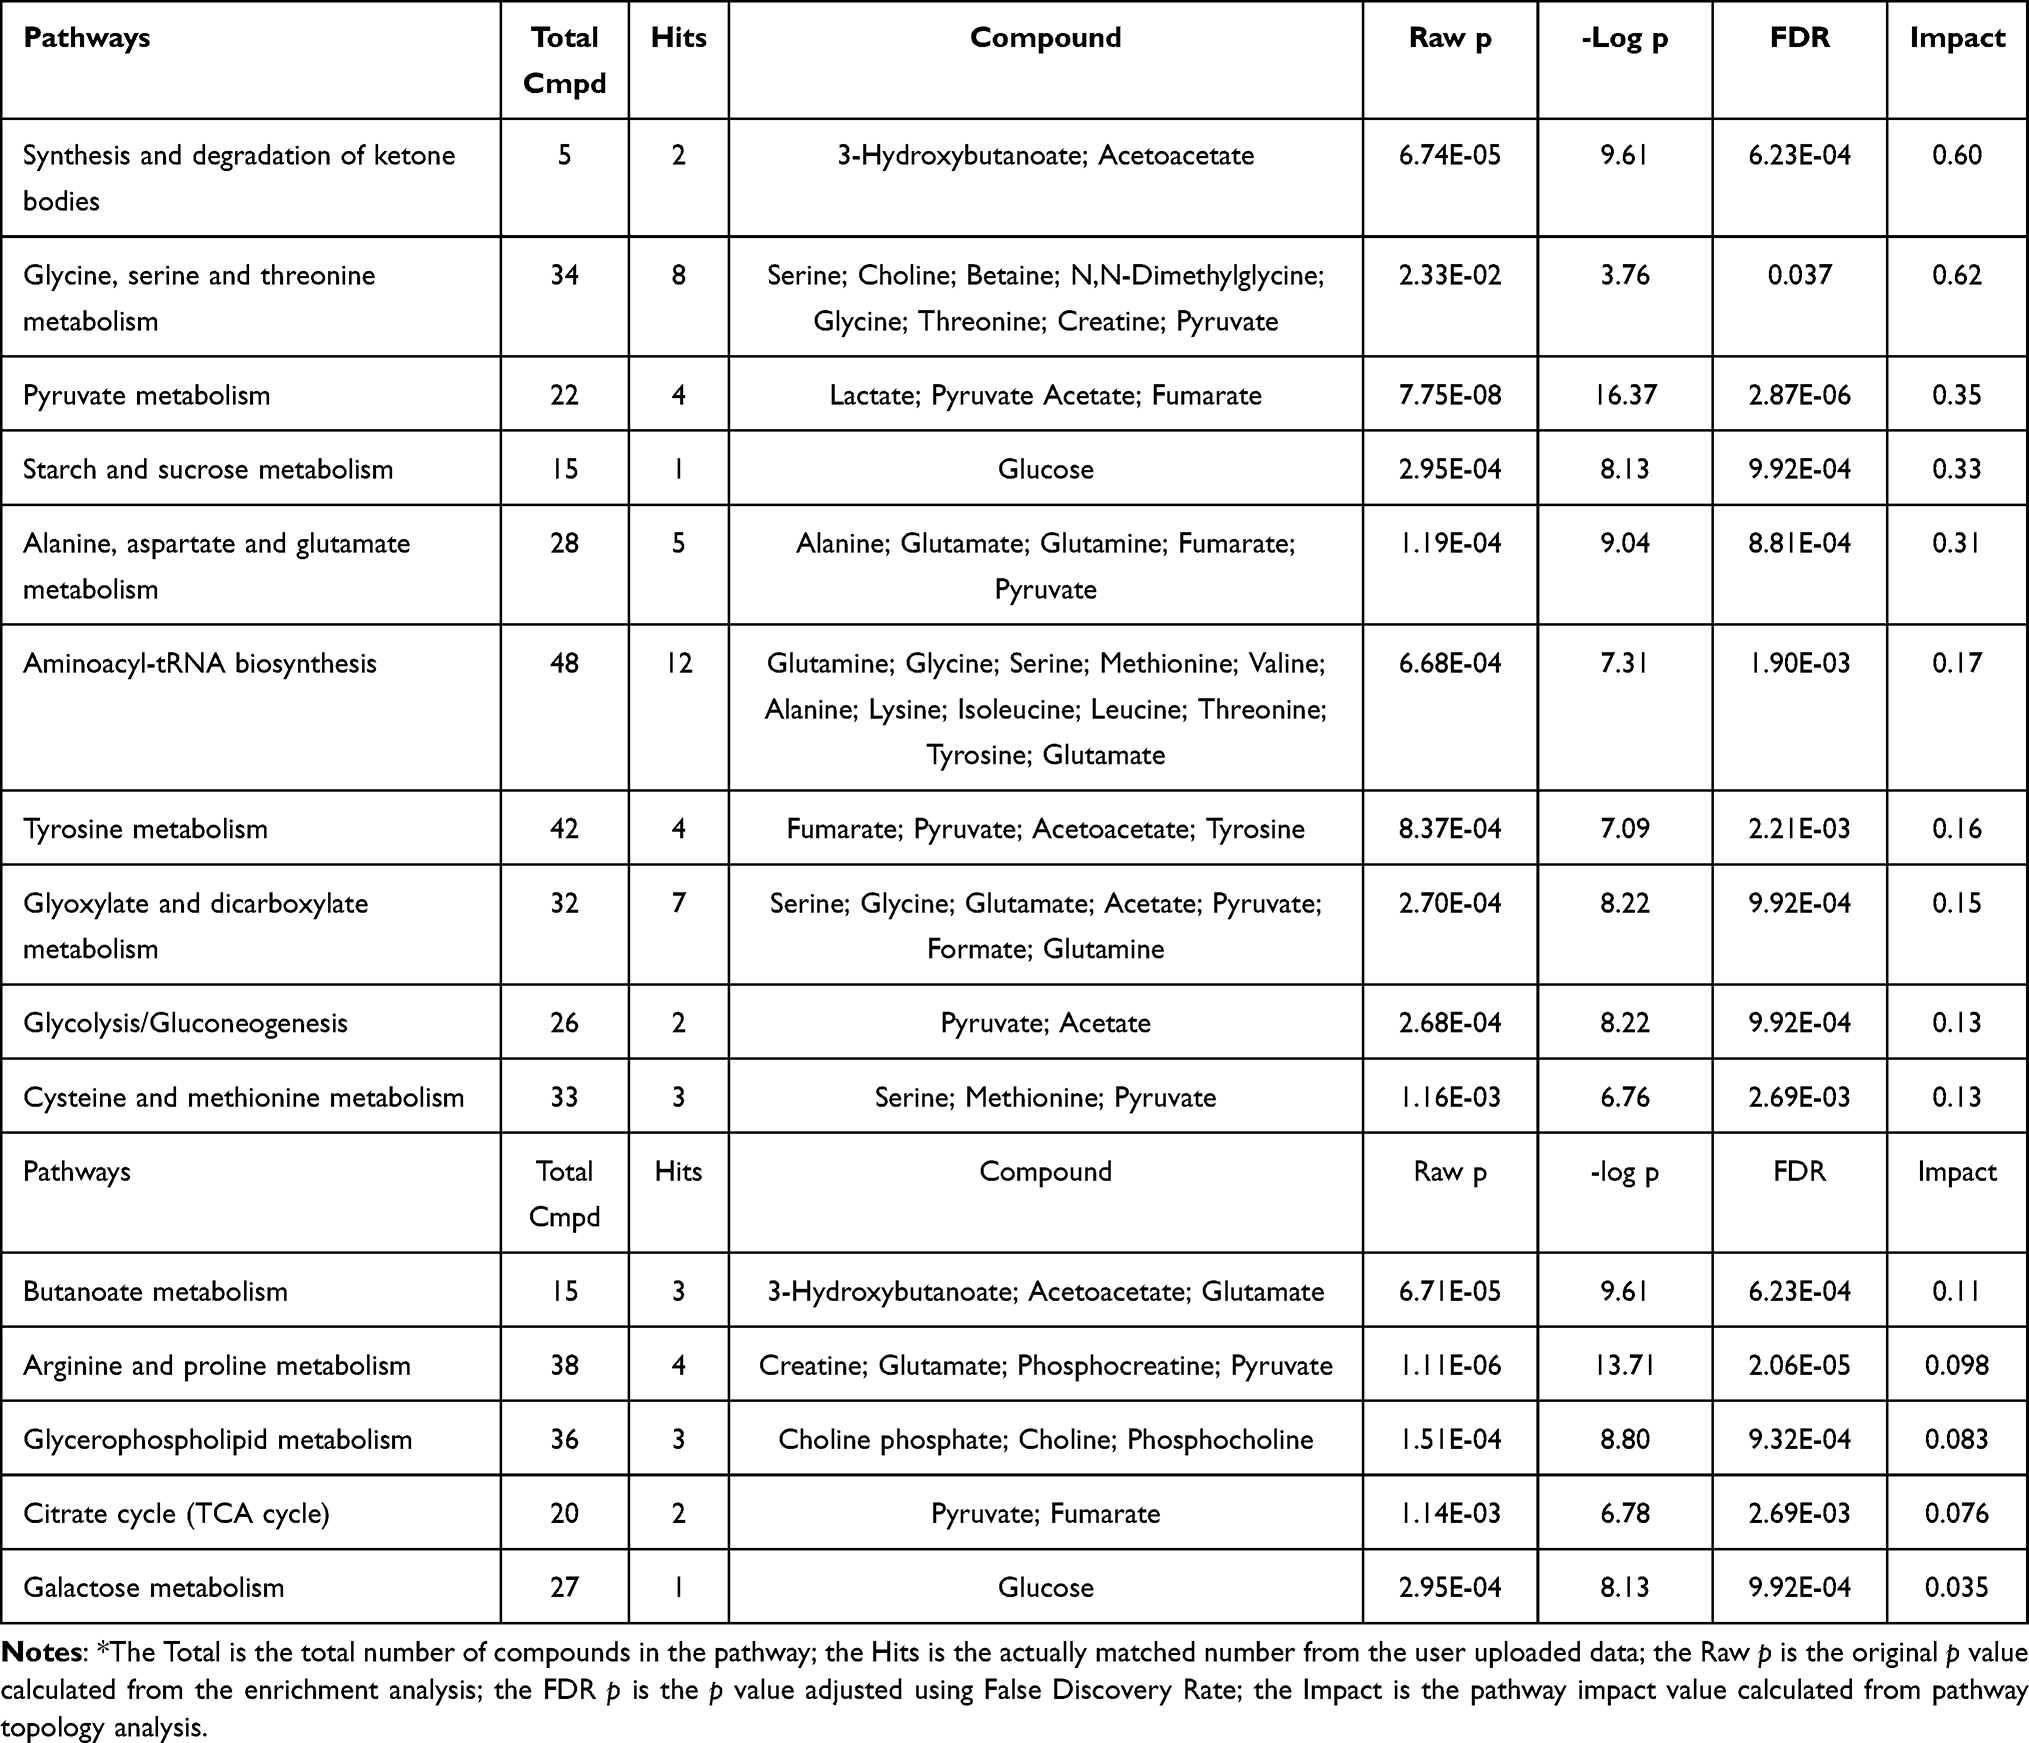 |
Table 2 Pathway Enrichment |
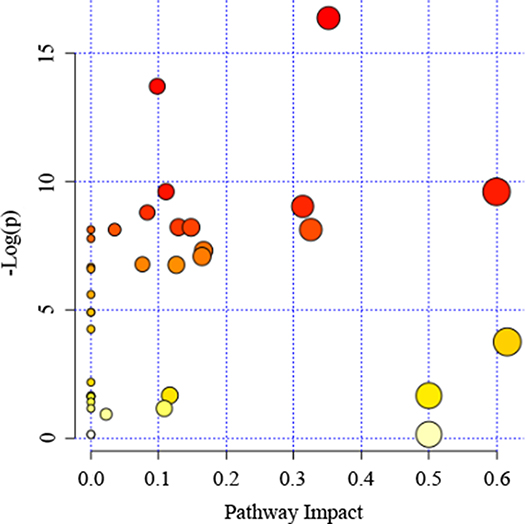 |
Figure 5 Summary of pathway analysis by Metaboanalyst online. The further its location is from the (0,0), the more significant the pathway is. |
Discussion
Different from genomics and proteomics technologies, metabolomics studies endogenous metabolites (intermediate or end products of metabolism). By analyzing the change rules of these metabolites in body fluids and tissues, the influences of internal and external factors such as gene expression and protein regulation on the body state can be analyzed from the whole organism. Any changes in physiological, pathological or other factors in the body will affect the concentration of metabolites or change the metabolic flow, so metabolomics technology can more accurately reflect the actual situation of the body. The serum metabolomic profile of colorectal cancer metastasis has been reported previously.26,27 Farshad et al demonstrated that the serum metabolomics associated with local colorectal cancer differed from those associated with simple liver metastases using gas chromatography-mass spectroscopy and 1H-NMR spectroscopy.26 Zhang et al found that 17 metabolites, including abscisic acid, calcitroic acid and glucosylsphingosine, could distinguish colorectal cancer patients with or without lymph node metastasis.27 Lung metastasis is an important prognostic factor affecting the prognosis of patients with colorectal cancer. Patients with lung metastasis had a poorer overall survival than non-metastasis patients.1 However, there is no research focused on serum profiling of colorectal cancer lung metastasis. In this study, we analyzed serum metabolic profiles during the lung metastasis process of colorectal cancer and identified 34 differential metabolites between the normal group and the metastatic groups. Some of them, such as lactate, creatine, acetate, acetic acid, lysine, phosphocreatine, glutamate and succinate, were significantly changed in the serum specimens of the colorectal cancer lung metastasis group. Then, we used MetaboAnalyst to summarize the changed metabolic pathways based on the Kyoto Encyclopedia of Genes and Genomes (KEGG), and the results showed that energy supplies and amino acid metabolism pathways were mainly disturbed (Table 2). Although we detected differential metabolites in lung tissues from mice with colorectal cancer metastasis,25 little research focused on differential serum metabolites related to cancer metastasis.
In the metabolic profile, elevated level of lactate were observed in the metastatic groups compared to the control group, consistent with previous reports.28 The conversion of glucose to lactic acid in the presence of oxygen is called aerobic glycolysis (Warburg effect). Increased aerobic glycolysis has been observed in most cancers; therefore, elevated level of lactate in serum samples of metastatic groups was not surprising.29 Increased lactate may be the result of enhanced glycolysis in the metastasis process. Metabolic conversion from oxidative phosphorylation to glycolysis in pancreatic cancer cells modulated the invasion-metastasis cascade by promoting epithelial-mesenchymal transformation, tumor angiogenesis, and metastatic colonization of distant organs.30 Even under normal conditions, increased glucose uptake and lactic acid accumulation are still common features of cancer cells, suggesting that the main purpose of glycolysis is not only to provide energy, but also for some other uses.31 The addition of lactate was thought to increase migration of various cell lines,32 which was transported in and out of cells by a group of monocarboxylic acid transporters (MCTs) with different isoforms,33 so elevated serum concentrations of lactate may be caused by increased expression of MCTs during metastasis. Indeed, many studies reported upregulation of MCTs in the cancer metastasis process.34 For example, MCT1 and MCT14 were overexpressed in liver metastases from colorectal cancer compared with non-neoplastic tissues.35 Inhibition of MCT1 reduced the burden of metastatic disease in patient-derived xenotransplantation and melanoma in mice, and MCT1 highly expressed cells formed more metastases after intravenous administration.36 In conclusion, lactic acid can be used as a biomarker for the diagnosis of colorectal cancer metastasis.
Serum creatine levels were significantly lower in the metastatic groups than in the normal group (Figure 4). Although elevated serum creatine levels have been reported in patients with early renal cell carcinoma,37 Lu et al found plasma creatine levels were reduced in patients with pancreatic cancer.38 To date, little research has demonstrated changes in serum creatine levels in the cancer metastasis process. Our research found that decreased serum creatine levels could be a characteristic of colorectal cancer lung metastasis. Acetate is a bioenergy substrate for human glioblastoma and brain metastases, and using 13C-NMR analysis of brain tumors, researchers found that acetate may be an important carbon source for the production of citric acid cycle intermediates such as acetyl-coA.39 Thus, it was not surprising that the serum acetate levels of the metastatic animals were lower than those of the control group due to the large amount of carbon sources required for tumor metastasis.
Phosphocreatine is a high-energy reserve substance in coupled reactions, which can anaerobically provide a phosphate group to ADP to form ATP. Sullivan et al demonstrated that in order to colonize the liver, colon cancer cells up-regulated the expression of cerebral creatine kinase (CKB) and secreted it into extracellular space, where CKB catalyzes the formation of creatine phosphate. Finally, phosphocreatine is imported into cells and used to regenerate ATP for cancer cell functions.40 In our results, serum phosphocreatine was reduced in the metastatic group compared to the normal group (Figure 4), suggesting that the metastatic cells may also require a metabolic program to survive metabolic stress at the initial colonization site. Cancer patients with metastasis will benefit from targeting phosphocreatine metabolism.
Glutamate is a carbon source of the TCA cycle and can promote anabolism. Morandi et al reported that increased intracellular glutamate levels maintain the aggressive phenotype of cancer cells in endocrine therapy-resistant breast cancer,41 suggesting that glutamate plays an important role in cancer progression. Overexpression of glutaminase 1 (GLS1), a mitochondrial enzyme that hydrolyzes glutamine to glutamate, is associated with cancer metastasis.42 However, in our study, serum glutamate levels were generally reduced in the metastatic group compared to the control group, which was consistent with previous studies showing that extracellular glutamate levels in glioblastoma cell lines were higher than in metastasis cell lines.43 We hypothesized that this was due to elevated glutamate levels in the metastatic group. SLC1A3 was overexpressed in some solid tumors, such as prostate cancer,44 which can transport glutamate into cells, and SCL1A3 inhibition could attenuate the metastatic potential of cancer cells.
The “seed and soil” hypothesis was put forward by Paget early in 1889.45 It has been proved that the site of metastasis depends not only on the characteristics of the primary tumor cells, but also on the microenvironment of the host tissue. Patients with colorectal cancer often develop liver and lung metastases, possibly because the lung and liver provide “fertile soil” for colorectal cancer cells. Similarly, tumor metabolism can promote tumor cell metastasis by influencing the tissue microenvironment.46 Lactic acid produced by colorectal cancer cells could induce apoptosis and result in mitochondrial dysfunction of liver-resident natural killer cells, thus promoting metastasis.46 In our current study, we also found that serum lactic acid levels in the metastatic group were higher than those in the normal group (Figure 4), indicating that lactic acid played a critical role in the metastasis process. It was confirmed that the polarization of macrophages could promote cancer progression, including metastasis.47 Tumor microenvironment can actively reprogram macrophage metabolism through direct exchange of metabolites.48 Lactic acid, glutamine, succinic acid, a-ketoglutarate (a-KG) and adenosine are the key metabolites that regulate the polarization of macrophages.48 For example, Liu et al confirmed that a high lactate concentration could promote an M2-like pro-tumour tumor associated macrophage phenotype by activating mTORC1-mediating signaling.49 In our present study, the increasing serum level of lactate may facilitate tumor metastasis by promoting macrophage polarization.
We have detected differential metabolites of lung tissues25 and serum samples from mice with colorectal cancer lung metastasis. Some metabolites including acetic acid, arginine, choline, glutamine, lactate, phosphocholine, succinate and taurine showed the same change tendency, while some metabolites including VLDL:CH3-(CH2)n-, acetate, creatine, glutamate, isoleucine, lysine, phosphocreatine and valine possessed the opposite trend. In lung tissues and serum samples, lactic acid level was up-regulated and succinic acid level was down-regulated, indicating active glycolysis and inhibition of aerobic respiration during cancer metastasis. We also found that the level of creatine, glutamate, isoleucine, phosphocreatine and valine decreased in serum samples, while increased in lung tissues, which may be due to the high nutrient requirements of the tissue during metastasis process.
Taken together, 1H-NMR spectroscopy was used to analyze serum metabolic profiles in a mouse model of colorectal cancer with lung metastasis. Several identified metabolites have been implicated in lung metastasis progression of colorectal cancer. However, the use of only one colorectal cancer cell line is a limitation of this study and further research is needed. In conclusion, the results demonstrate that serum metabolites may serve as potential diagnostic biomarkers for tumor metastasis.
Abbreviations
PCA, principal component analysis; OPLS-DA, orthogonal partial least squares discriminant analysis; PLS-DA, partial least squares discriminant analysis; NMR, nuclear magnetic resonance; TCA, tricarboxylic acid cycle.
Data Sharing Statement
The data set analyzed in this study is available in the figshare database (https://doi.org/10.6084/m9.figshare.16880542.v1).
Acknowledgments
This work was supported by Shanxi Provincial Natural Science Foundation (20210302124008).
Author Contributions
All authors made a significant contribution to the work reported, whether that is in the conception, study design, execution, acquisition of data, analysis and interpretation, or in all these areas; took part in drafting, revising or critically reviewing the article; gave final approval of the version to be published; have agreed on the journal to which the article has been submitted; and agree to be accountable for all aspects of the work.
Disclosure
The authors declare no conflicts of interest in this work.
References
1. Siegel RL, Miller KD, Jemal A. Cancer statistics. CA Cancer J Clin. 2019;69(1):7–34. doi:10.3322/caac.21551
2. Lukacs B, Cornu JN, Aout M, et al. Management of lower urinary tract symptoms related to benign prostatic hyperplasia in real-life practice in France: a comprehensive population study. Eur Urol. 2013;64(3):493–501. doi:10.1016/j.eururo.2013.02.026
3. Califf RM. Biomarker definitions and their applications. Exp Biol Med. 2018;243(3):213–221. doi:10.1177/1535370217750088
4. Ganepola GA, Nizin J, Rutledge JR, Chang DH. Use of blood-based biomarkers for early diagnosis and surveillance of colorectal cancer. World J Gastrointest Oncol. 2014;6(4):83–97. doi:10.4251/wjgo.v6.i4.83
5. Bayci AWL, Baker DA, Somerset AE, et al. Metabolomic identification of diagnostic serum-based biomarkers for advanced stage melanoma. Metabolomics. 2018;14(8):105. doi:10.1007/s11306-018-1398-9
6. Yang W, Mu T, Jiang J, et al. Identification of potential biomarkers and metabolic profiling of serum in ovarian cancer patients using UPLC/Q-TOF MS. Cell Physiol Biochem. 2018;51(3):1134–1148. doi:10.1159/000495492
7. Yu J, Zhai X, Li X, et al. Identification of MST1 as a potential early detection biomarker for colorectal cancer through a proteomic approach. Sci Rep. 2017;7(1):14265. doi:10.1038/s41598-017-14539-x
8. Fan NJ, Chen HM, Song W, et al. Macrophage mannose receptor 1 and S100A9 were identified as serum diagnostic biomarkers for colorectal cancer through a label-free quantitative proteomic analysis. Cancer Biomark. 2016;16(2):235–243. doi:10.3233/CBM-150560
9. Michonneau D, Latis E, Curis E, et al. Metabolomics analysis of human acute graft-versus-host disease reveals changes in host and microbiota-derived metabolites. Nat Commun. 2019;10(1):5695. doi:10.1038/s41467-019-13498-3
10. Jaurila H, Koivukangas V, Koskela M, et al. (1)H NMR based metabolomics in human sepsis and healthy serum. Metabolites. 2020;10(2):70. doi:10.3390/metabo10020070
11. Wojtowicz W, Zabek A, Deja S, et al. Serum and urine (1)H NMR-based metabolomics in the diagnosis of selected thyroid diseases. Sci Rep. 2017;7(1):9108. doi:10.1038/s41598-017-09203-3
12. Trilla-Fuertes L, Gamez-Pozo A, Lopez-Camacho E, et al. Computational models applied to metabolomics data hints at the relevance of glutamine metabolism in breast cancer. BMC Cancer. 2020;20(1):307. doi:10.1186/s12885-020-06764-x
13. Peng B, Li H, Peng XX. Functional metabolomics: from biomarker discovery to metabolome reprogramming. Protein Cell. 2015;6(9):628–637. doi:10.1007/s13238-015-0185-x
14. Denkert C, Bucher E, Hilvo M, et al. Metabolomics of human breast cancer: new approaches for tumor typing and biomarker discovery. Genome Med. 2012;4(4):37. doi:10.1186/gm336
15. Kouril K, Kourilova H, Bartram S, Levitt MH, Meier B. Scalable dissolution-dynamic nuclear polarization with rapid transfer of a polarized solid. Nat Commun. 2019;10(1):1733. doi:10.1038/s41467-019-09726-5
16. Kehayias P, Jarmola A, Mosavian N, et al. Solution nuclear magnetic resonance spectroscopy on a nanostructured diamond chip. Nat Commun. 2017;8(1):188. doi:10.1038/s41467-017-00266-4
17. Yang B, Liao GQ, Wen XF, et al. Nuclear magnetic resonance spectroscopy as a new approach for improvement of early diagnosis and risk stratification of prostate cancer. J Zhejiang Univ Sci B. 2017;18(11):921–933. doi:10.1631/jzus.B1600441
18. Ahmed N, Kidane B, Wang L, et al. Non-invasive exploration of metabolic profile of lung cancer with magnetic resonance spectroscopy and mass spectrometry. Contemp Clin Trials Commun. 2019;16:100445. doi:10.1016/j.conctc.2019.100445
19. Deja S, Porebska I, Kowal A, et al. Metabolomics provide new insights on lung cancer staging and discrimination from chronic obstructive pulmonary disease. J Pharm Biomed Anal. 2014;100:369–380. doi:10.1016/j.jpba.2014.08.020
20. Sant’Anna-Silva ACB, Santos GC, Campos SPC, Oliveira Gomes AM, Perez-Valencia JA, Rumjanek FD. Metabolic profile of oral squamous carcinoma cell lines relies on a higher demand of lipid metabolism in metastatic cells. Front Oncol. 2018;8:13. doi:10.3389/fonc.2018.00013
21. Gupta A, Gupta S, Mahdi AA. (1)H NMR-derived serum metabolomics of leukoplakia and squamous cell carcinoma. Clin Chim Acta. 2015;441:47–55. doi:10.1016/j.cca.2014.12.003
22. Wang H, Zhang H, Deng P, et al. Tissue metabolic profiling of human gastric cancer assessed by (1)H NMR. BMC Cancer. 2016;16(1):371. doi:10.1186/s12885-016-2356-4
23. Chan AW, Mercier P, Schiller D, et al. (1)H-NMR urinary metabolomic profiling for diagnosis of gastric cancer. Br J cancer. 2016;114(1):59–62. doi:10.1038/bjc.2015.414
24. Carrola J, Rocha CM, Barros AS, et al. Metabolic signatures of lung cancer in biofluids: NMR-based metabonomics of urine. J Proteome Res. 2011;10(1):221–230. doi:10.1021/pr100899x
25. Li Y, Wang C, Li D, et al. 1H-NMR-based metabolic profiling of a colorectal cancer CT-26 lung metastasis model in mice. Oncol Rep. 2017;38:3044–3054.
26. Farshidfar F, Weljie AM, Kopciuk K, et al. Serum metabolomic profile as a means to distinguish stage of colorectal cancer. Genome Med. 2012;4(5):42. doi:10.1186/gm341
27. Zhang Y, Du Y, Song Z, et al. Profiling of serum metabolites in advanced colon cancer using liquid chromatography-mass spectrometry. Oncol Lett. 2020;19(6):4002–4010. doi:10.3892/ol.2020.11510
28. Lu J, Tan M, Cai Q. The Warburg effect in tumor progression: mitochondrial oxidative metabolism as an anti-metastasis mechanism. Cancer Lett. 2015;356(2):156–164. doi:10.1016/j.canlet.2014.04.001
29. Beckers A, Organe S, Timmermans L, et al. Chemical inhibition of acetyl-CoA carboxylase induces growth arrest and cytotoxicity selectively in cancer cells. Cancer Res. 2007;67(17):8180–8187. doi:10.1158/0008-5472.CAN-07-0389
30. Yang J, Ren B, Yang G, et al. The enhancement of glycolysis regulates pancreatic cancer metastasis. Cell Mol Life Sci. 2020;77(2):305–321. doi:10.1007/s00018-019-03278-z
31. Hirschhaeuser F, Sattler UG, Mueller-Klieser W. Lactate: a metabolic key player in cancer. Cancer Res. 2011;71(22):6921–6925. doi:10.1158/0008-5472.CAN-11-1457
32. Goetze K, Walenta S, Ksiazkiewicz M, Kunz-Schughart LA, Mueller-Klieser W. Lactate enhances motility of tumor cells and inhibits monocyte migration and cytokine release. Int J Oncol. 2011;39(2):453–463. doi:10.3892/ijo.2011.1055
33. Halestrap AP. The monocarboxylate transporter family–Structure and functional characterization. IUBMB Life. 2012;64:1–9. doi:10.1002/iub.573
34. Payen VL, Mina E, Van Hee VF, Porporato PE, Sonveaux P. Monocarboxylate transporters in cancer. Mol Metab. 2020;33:48–66. doi:10.1016/j.molmet.2019.07.006
35. Martins SF, Amorim R, Viana-Pereira M, et al. Significance of glycolytic metabolism-related protein expression in colorectal cancer, lymph node and hepatic metastasis. BMC Cancer. 2016;16(1):535. doi:10.1186/s12885-016-2566-9
36. Tasdogan A, Faubert B, Ramesh V, et al. Metabolic heterogeneity confers differences in melanoma metastatic potential. Nature. 2020;577(7788):115–120. doi:10.1038/s41586-019-1847-2
37. Zheng H, Ji J, Zhao L, et al. Prediction and diagnosis of renal cell carcinoma using nuclear magnetic resonance-based serum metabolomics and self-organizing maps. Oncotarget. 2016;7(37):59189–59198. doi:10.18632/oncotarget.10830
38. Luo X, Liu J, Wang H, Lu H. Metabolomics identified new biomarkers for the precise diagnosis of pancreatic cancer and associated tissue metastasis. Pharmacol Res. 2020;156:104805. doi:10.1016/j.phrs.2020.104805
39. Mashimo T, Pichumani K, Vemireddy V, et al. Acetate is a bioenergetic substrate for human glioblastoma and brain metastases. Cell. 2014;159(1603–1614):1603–1614. doi:10.1016/j.cell.2014.11.025
40. Sullivan WJ, Christofk HR. The metabolic milieu of metastases. Cell. 2015;160(3):363–364. doi:10.1016/j.cell.2015.01.023
41. Bacci M, Lorito N, Ippolito L, et al. Reprogramming of amino acid transporters to support aspartate and glutamate dependency sustains endocrine resistance in breast cancer. Cell Rep. 2019;28(1):104–118 e108. doi:10.1016/j.celrep.2019.06.010
42. Xiang L, Mou J, Shao B, et al. Glutaminase 1 expression in colorectal cancer cells is induced by hypoxia and required for tumor growth, invasion, and metastatic colonization. Cell Death Dis. 2019;10(2):40. doi:10.1038/s41419-018-1291-5
43. Lange F, Wesslau K, Porath K, et al. AMPA receptor antagonist perampanel affects glioblastoma cell growth and glutamate release in vitro. PLoS One. 2019;14(2):e0211644. doi:10.1371/journal.pone.0211644
44. Sun J, Nagel R, Zaal EA, et al. SLC 1A3 contributes to L-asparaginase resistance in solid tumors. EMBO J. 2019;38(21):e102147. doi:10.15252/embj.2019102147
45. Paget S. The distribution of secondary growths in cancer of the breast. 1889. Cancer Metastasis Rev. 1989;8(2):98–101.
46. Harmon C, Robinson MW, Hand F, et al. Lactate-mediated acidification of tumor microenvironment induces apoptosis of liver-resident NK cells in colorectal liver metastasis. Cancer Immunol Res. 2019;7(2):335–346. doi:10.1158/2326-6066.CIR-18-0481
47. Takeuchi H, Tanaka M, Tanaka A, Tsunemi A, Yamamoto H. Predominance of M2-polarized macrophages in bladder cancer affects angiogenesis, tumor grade and invasiveness. Oncol Lett. 2016;11(5):3403–3408. doi:10.3892/ol.2016.4392
48. Mehla K, Singh PK. Metabolic regulation of macrophage polarization in cancer. Trends Cancer. 2019;5:822–834. doi:10.1016/j.trecan.2019.10.007
49. Liu N, Luo J, Kuang D, et al. Lactate inhibits ATP6V0d2 expression in tumor-associated macrophages to promote HIF-2alpha-mediated tumor progression. J Clin Invest. 2019;129(2):631–646. doi:10.1172/JCI123027
 © 2022 The Author(s). This work is published and licensed by Dove Medical Press Limited. The
full terms of this license are available at https://www.dovepress.com/terms
and incorporate the Creative Commons Attribution
- Non Commercial (unported, 3.0) License.
By accessing the work you hereby accept the Terms. Non-commercial uses of the work are permitted
without any further permission from Dove Medical Press Limited, provided the work is properly
attributed. For permission for commercial use of this work, please see paragraphs 4.2 and 5 of our Terms.
© 2022 The Author(s). This work is published and licensed by Dove Medical Press Limited. The
full terms of this license are available at https://www.dovepress.com/terms
and incorporate the Creative Commons Attribution
- Non Commercial (unported, 3.0) License.
By accessing the work you hereby accept the Terms. Non-commercial uses of the work are permitted
without any further permission from Dove Medical Press Limited, provided the work is properly
attributed. For permission for commercial use of this work, please see paragraphs 4.2 and 5 of our Terms.