Back to Journals » Drug Design, Development and Therapy » Volume 14
Are Laboratory Parameter (Biomarker) Values Similar to the Healthy Volunteer Reference Range in Individuals with Diabetes
Authors Brott DA, Goodman MJ, Hermann RP, Anderson I, Kiazand A
Received 1 November 2019
Accepted for publication 18 May 2020
Published 24 June 2020 Volume 2020:14 Pages 2473—2486
DOI https://doi.org/10.2147/DDDT.S236944
Checked for plagiarism Yes
Review by Single anonymous peer review
Peer reviewer comments 3
Editor who approved publication: Dr Sukesh Voruganti
David A Brott,1 Michael J Goodman,1 Richard P Hermann,1 Isobel Anderson,2 Alexandre Kiazand1
1Patient Safety Center of Excellence, Chief Medical Office Organization, AstraZeneca Pharmaceuticals, Gaithersburg, MD, USA; 2Patient Safety Center of Excellence, Chief Medical Office Organization, AstraZeneca Pharmaceuticals, Macclesfield, UK
Correspondence: David A Brott
Takeda Pharmaceuticals, 300 Massachusetts Avenue, Cambridge, MA, USA
Tel +1 3042408302
Email [email protected]
Background: Identification of laboratory parameter clinical safety signals depends on the terminology and scoring criteria. Grade 1 scoring criteria in the Common Terminology Criteria for Adverse Events (CTCAE) is typically based on the healthy volunteer reference range (HVRR). The objectives of this study were to determine 1) what laboratory parameters in individuals with diabetes are potentially different from the HVRR and 2) what fold change from baseline should be expected in this population.
Materials and Methods: Baseline data from the individuals with diabetes clinical trial data (TransCelerate dataset) were compared to the HVRR using a 10% threshold above HVRR to classify laboratory parameters as potentially different from the HVRR. These parameters were then evaluated longitudinally to determine the expected x-baseline values for individuals with diabetes for potential use in identifying drug-induced changes.
Results: The baseline data determined that 28% of the laboratory parameters evaluated were potentially different from the HVRR. Longitudinal data analysis determined 1) thresholds for 13 of these laboratory parameters with the subjects above the threshold having greater variability than those below the threshold, and 2) the expected upper limits (x-baseline) were calculated for the laboratory parameters. For example, a 1.8– 2.6 x-baseline value for alanine aminotransferase, depending on how the baseline is calculated, is expected in individuals with diabetes.
Conclusion: It is not uncommon for laboratory parameters in individuals with diabetes clinical trials to be potentially different from the HVRR, and the x-baseline criteria for 13 of these laboratory biomarkers was determined for this population. This suggests consideration in modifying the current CTCAE grade 1 criteria of > 1.5– 3.0 x-baseline should be further investigated as to if the current criteria detects too many false-positive signals in this population.
Keywords: diabetes, biomarkers, reference range, laboratory parameter, pharmacovigilance
Introduction
Identification of potential clinical safety signals (adverse event: AE) is imperative during the clinical development of investigational new drugs/molecules to ensure the safety of the individuals and to determine the risk–benefit balance of the molecule. Safety signals are typically recorded using Medical Dictionary for Regulatory Activities (MedDRA) terms with laboratory parameters under the System Organ Classification of “Investigational” and each AE is based on a laboratory parameter being the preferred term (PT). For example, activated partial thromboplastin time prolonged, alanine aminotransferase increased, cholesterol high and CPK increased are the PT AE terms for some laboratory parameters.
The severity score for the laboratory parameters is based on the Common Terminology Criteria for Adverse Event (CTCAE) or similar scoring criteria. The lowest CTCAE severity is grade 1 with the definition of “mild; asymptomatic or mild symptoms; clinical or diagnostic observations only; intervention not indicated”. Table 1 shows the CTCAE grade 1 criteria differences for some of the laboratory parameters between version 4.03 and version 5.0.1,2 In version 4.03 the grade 1 criteria were based solely on the healthy volunteer reference range (HVRR) upper limits of normal (ULN). However, these definitions were modified in CTCAE version 5.0 for the liver function laboratory parameters to also include fold change from baseline, if the baseline value (prior to subject getting the drug) was above the HVRR ULN. This change in the grade 1 criteria was to help identify potential clinical safety signals in individuals that had elevated liver function tests at baseline, such as patients with NASH or liver metastases. However, based on a pilot study recently reported, we know that liver function laboratory parameters are not the only laboratory parameters above the HVRR ULN at baseline, but rather approximately 25% of the laboratory parameters across various patient populations evaluated were above the HVRR ULN.3
 |
Table 1 Common Terminology Criteria for Adverse Event (CTCAE Grade 1 Scoring Definitions) |
Based on general medical knowledge it is already known that liver function tests and pancreatic enzymes are abnormal in individuals with diabetes: alanine aminotransferase, aspartate aminotransferase, alkaline phosphatase, amylase, gamma-glutamyl transferase, and lipase are elevated in 9–18%, 3–10%, 3–9%, 3–12%, 6–19% and 11–20% of the individuals, respectively.4–7
Determining if a change in CTCAE grade 1 criteria was needed for laboratory parameters, in addition to the liver function parameters and pancreatic enzymes, a large dataset of longitudinal data points was necessary. The objective of this study was to use the individuals with diabetes dataset from the TransCelerate Placebo Standard of Care (PSoC) project to determine if laboratory parameters are potentially different from the HVRR and based on the within-subject variability, what fold change from baseline should be expected in PSoC individuals with diabetes.
Materials and Methods
Dataset
Individuals with diabetes data were selected from batch 6 of the TransCelerate BioPharma PSoC products. A full description of the PSoC dataset is contained in the White Paper published by the collaborative8 Briefly, companies within the consortium contribute data from PSoC arms of their studies in the standard format. All subjects were deidentified. Institutional review board (IRB) or ethics committee review was done by each individual company before initiating their clinical trial and so no additional IRB or ethics committee review was necessary for this specific manuscript. All consortia member companies have access to the full dataset, but it is not freely accessible to the scientific community.
Therefore, the PSoC database incorporates a large volume of Good Clinical Practices (GCP)-compliant clinical trial data (comprised of both placebo and standard of care) to facilitate the development of innovative drug products. There were 15 clinical trials in the individuals with diabetes TransCelerate database, batch 6 (Table 2). The protocols for each clinical trial were reviewed in ClinTrials.gov to ensure only data from similar populations were evaluated. Study 000001 consisted of patients with anemia in chronic kidney disease and study 12450048 were individuals with diabetes and hypertensive disorder and were thereby excluded from further analysis. In addition, the data from study 12180036 were excluded from further analysis due to technical issues. The total number of subjects analyzed with laboratory parameter values were 2825.
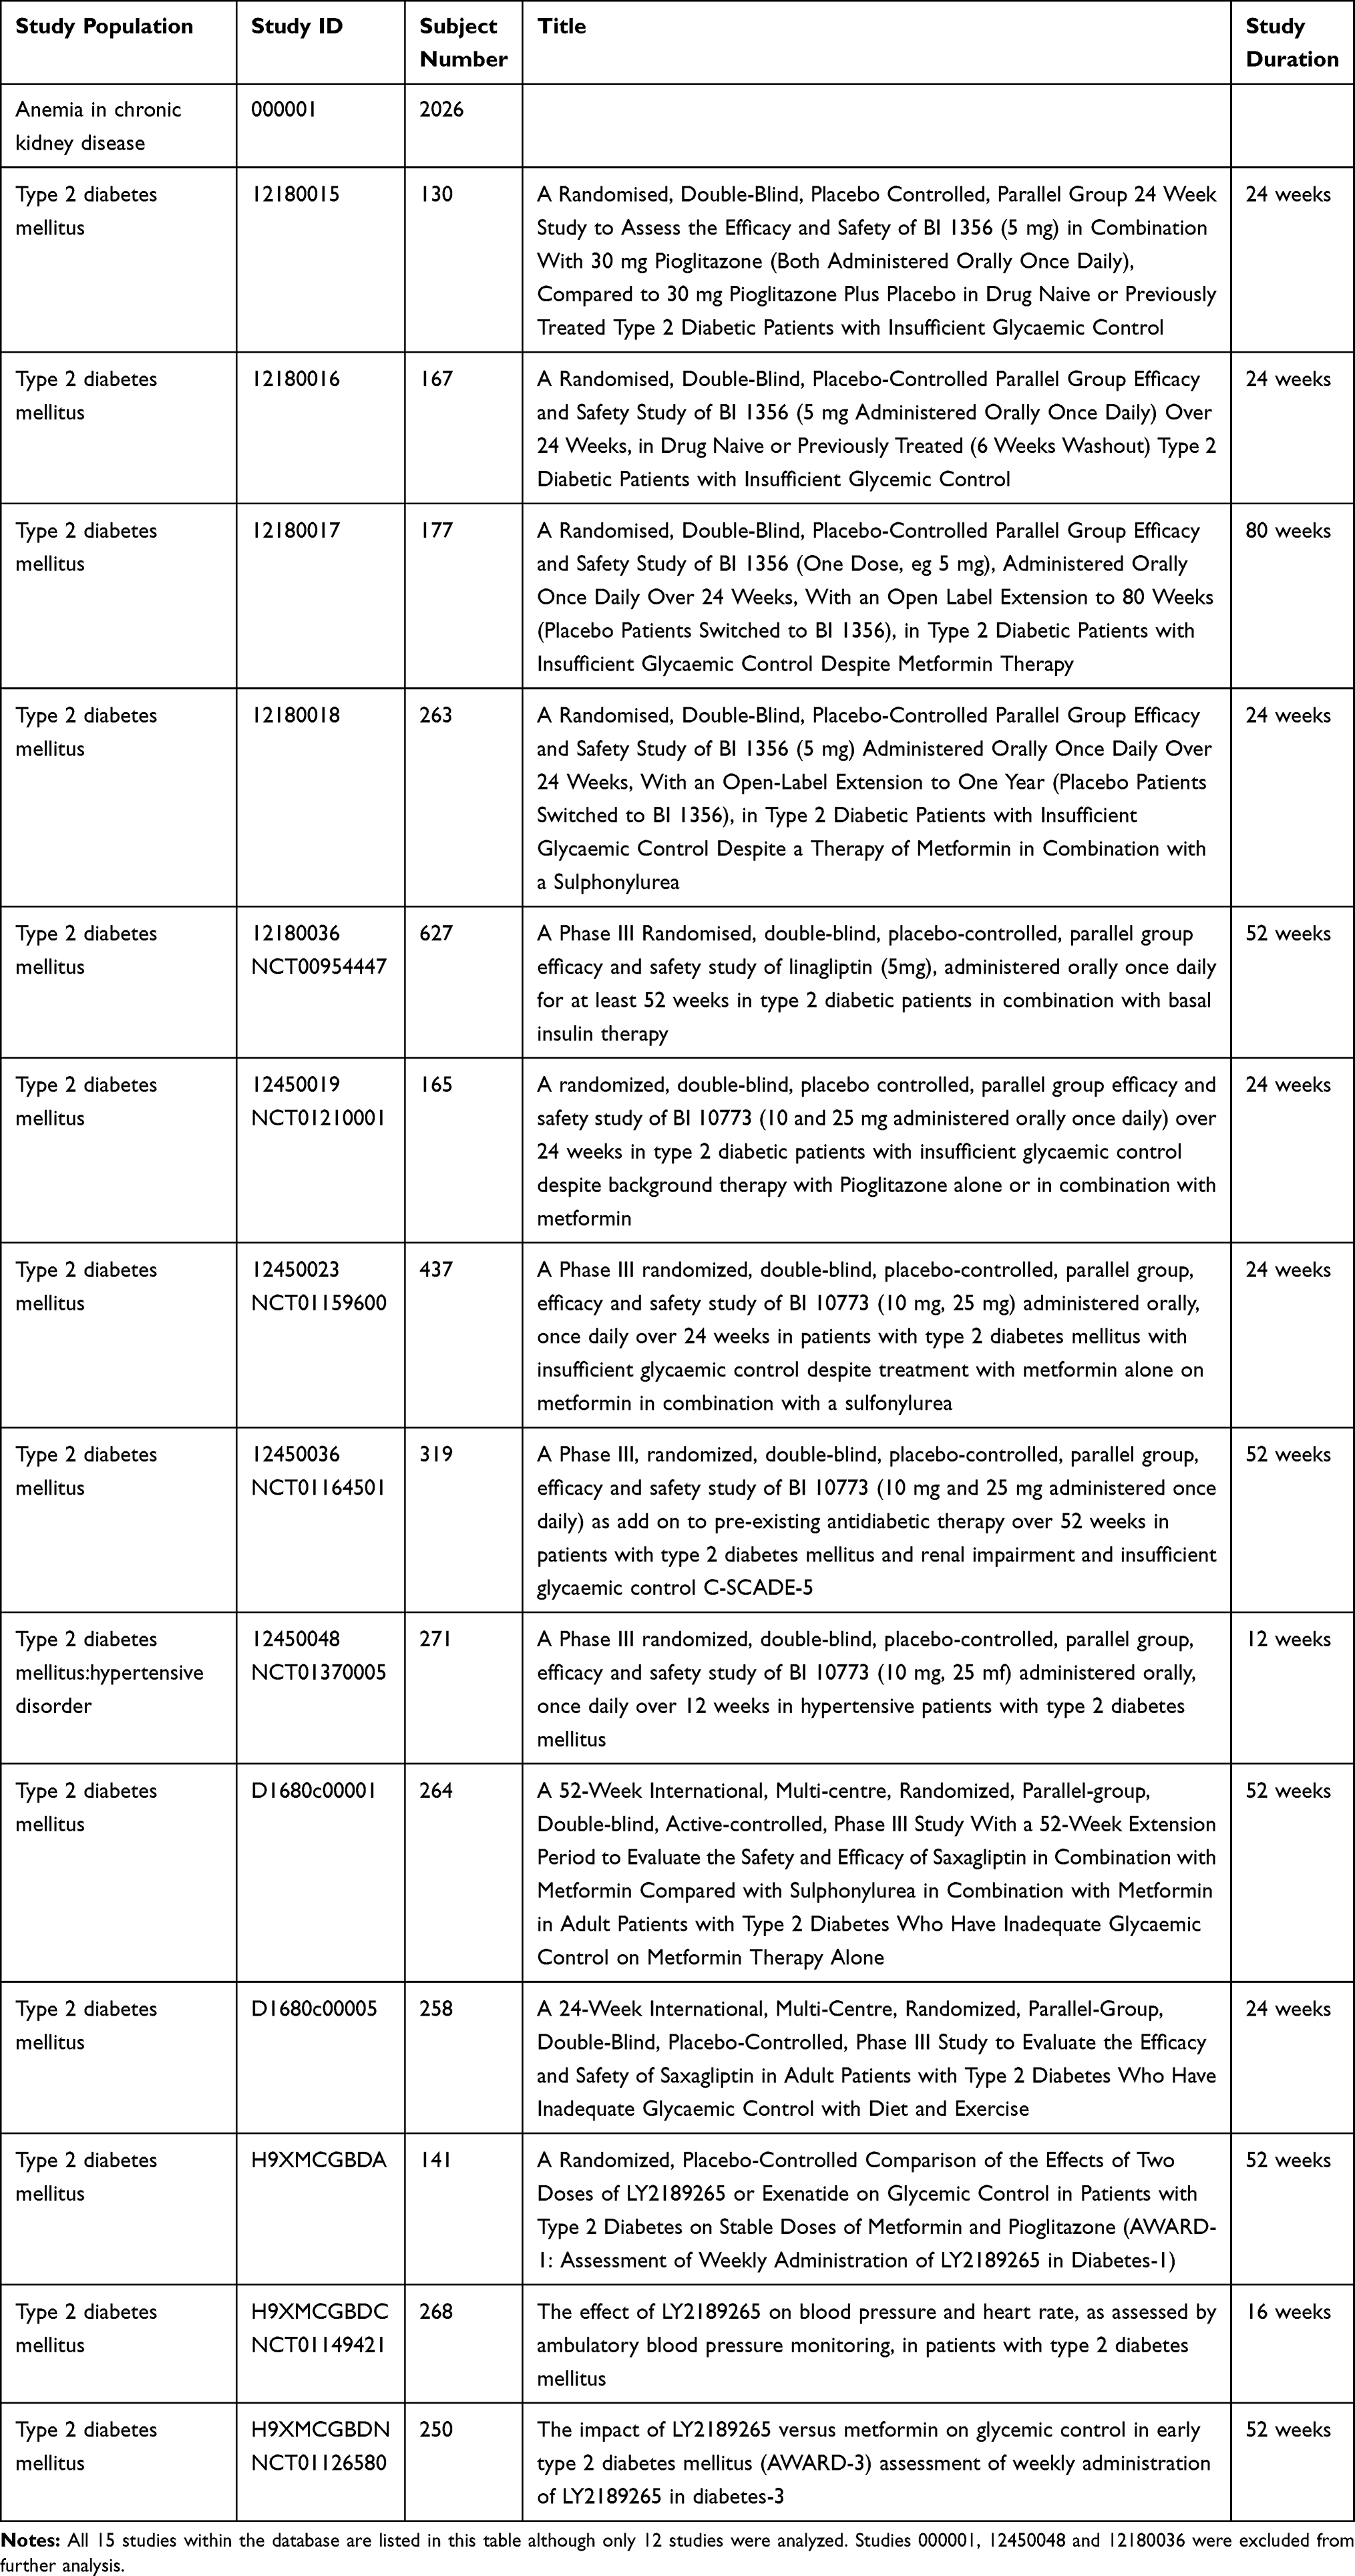 |
Table 2 Studies |
Baseline data was defined as the minimum laboratory day (lbdy) in a study data tabulation model (SDTM). If an individual had more than one value for a specific test on the baseline date, one of the values was randomly selected by assigning a random number from a uniform distribution and choosing the minimum random number.
Longitudinal data was all lbdy in the study tabulation model (SDTM) and all laboratory parameter values were analyzed for each subject.
Data Analysis
Data for this paper comes from two SDTM tables: LB (laboratory) and DM (demographics). The healthy volunteer reference ranges may be different within and between studies as they are determined at the laboratory doing the sample analysis. To eliminate the influence of different reference ranges, all laboratory values were normalized to the ULN by dividing the value by the ULN, on an individual sample basis. Most data processing was done in SAS Enterprise Guide Version 7.15 on the AZ SAS Grid installation.
Laboratory parameters with at least 400 subjects were analyzed and interpreted, based on the average number (between 300 and 500) of subjects recommended for a reference interval.9
A laboratory parameter in a population was deemed potentially different from the HVRR if greater than 10% of the laboratory values from the population were above the ULN. The 10% threshold is four times higher than the expected percentage (2.5%), based on the definition of HVRR and was selected as a clinically meaningful difference to minimize the risk of false positives (classifying a laboratory parameter as different from the HVRR).
Longitudinal data analysis was based on the normalization of the data at each time point to the first (baseline) value for that subject and reported as x-baseline. An estimate of the maximum x-baseline expected for PSoC individuals with diabetes was determined using the following formula with the 95%upper limits (UL) of coefficient of variation (CV) being the mean within-subject percent coefficient of variation plus two times the standard error of the mean: (baseline value + (baseline values * 95%UL of STD * z))/baseline with z = 1.96. This formula assumed the baseline value was roughly the mean for the subject, which would be accurate if using multiple values for determining the baseline. However, when only one baseline value was measured, this baseline value could be the minimal expected value and so for single baseline measurements the following formula was used to determine the x-baseline upper limit: (baseline value + (baseline value * 95%UL of CV * 1.96 * 2))/baseline, since the minimum value would be two standard deviations below the actual mean value.
Results
Studies
The distribution of sample numbers across the remaining studies ranged from 130 to 437 individuals in each study. Therefore, it is unlikely that data in one clinical trial should have a disproportionate impact on the final data interpretation.
Demographics
Demographics of the 12 studies being evaluated from the individuals with diabetes dataset shows some differences between studies (Table 3). Subject age cannot be evaluated as this demographic is missing from most studies, probably due to the method used by companies for de-identification. As expected, individuals with diabetes were roughly 50% female (35% to 55%). Of interest, the ethnicity varied greatly between the studies: most studies were majority white (n=6 studies), two studies were split between white and other, and four studies had higher levels of Asian (36% to 100%).
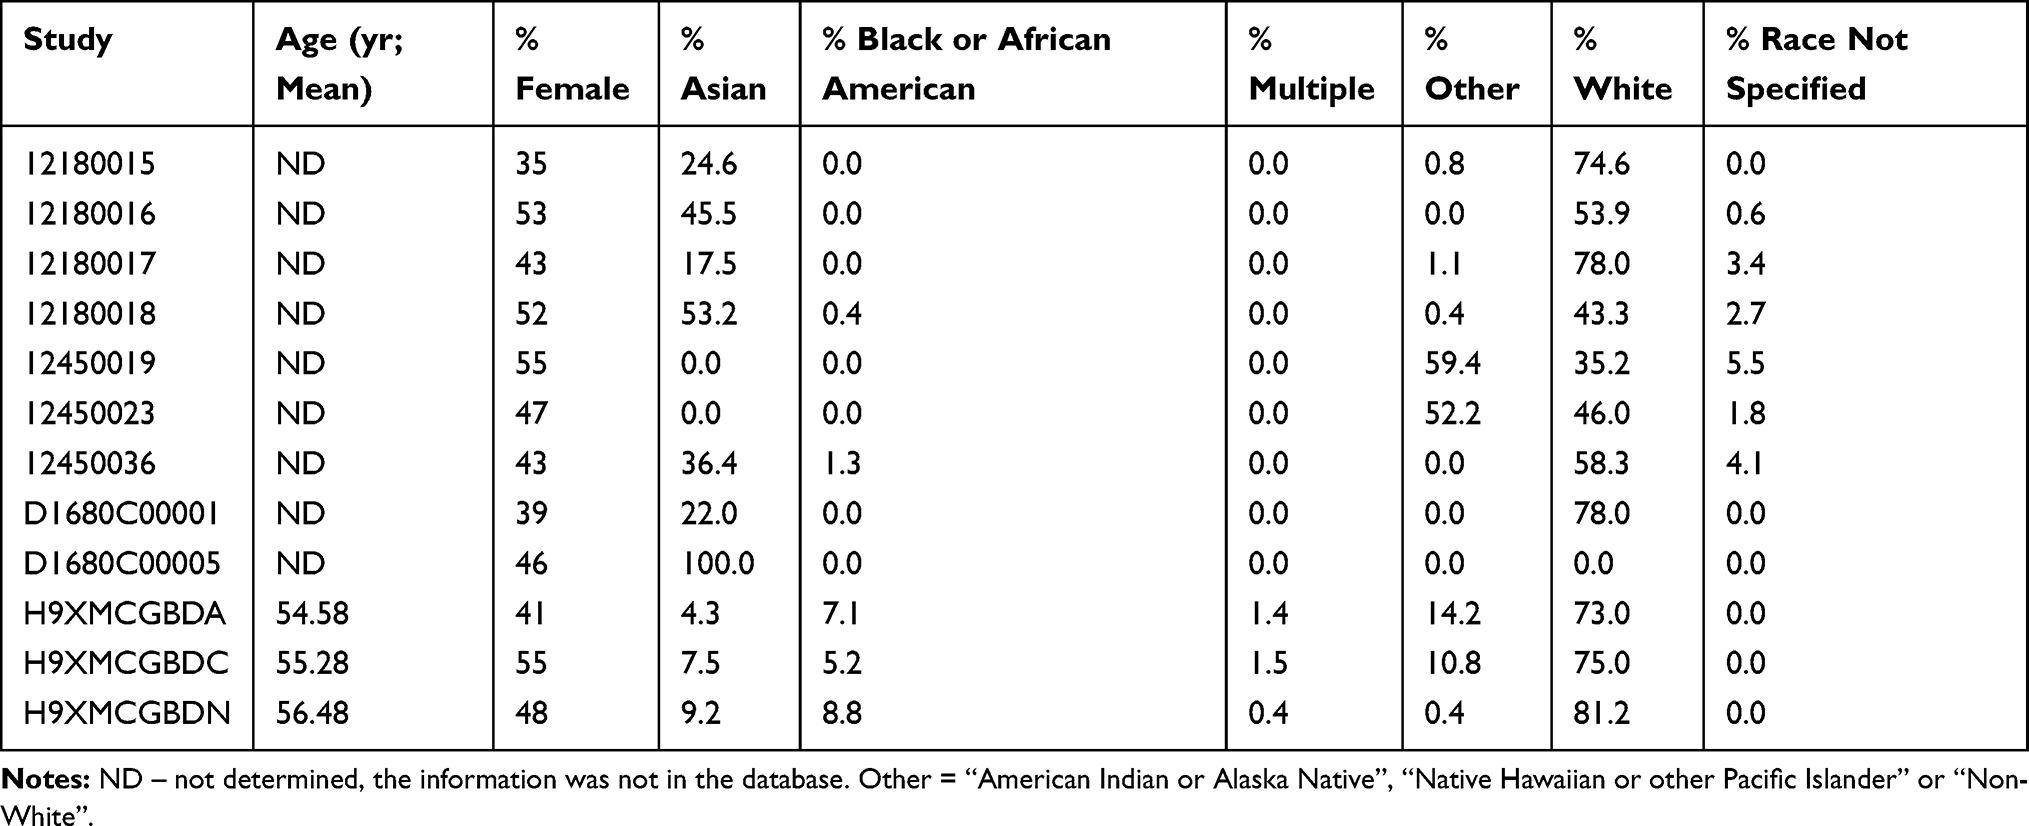 |
Table 3 Demographics of the Subject in the Twelve Studies |
Baseline
All of the laboratory parameters evaluated for each of the twelve studies are listed in Tables 4 and 5. The results for the laboratory parameters with baseline values in less than 400 subjects or any results evaluated in just one study are shown in Table 4 but due to the limited datapoints were not interpreted as to a laboratory parameter being potentially different from the HVRR.
 |
Table 4 Laboratory Parameters Reported in <400 Subjects or in Only One Study |
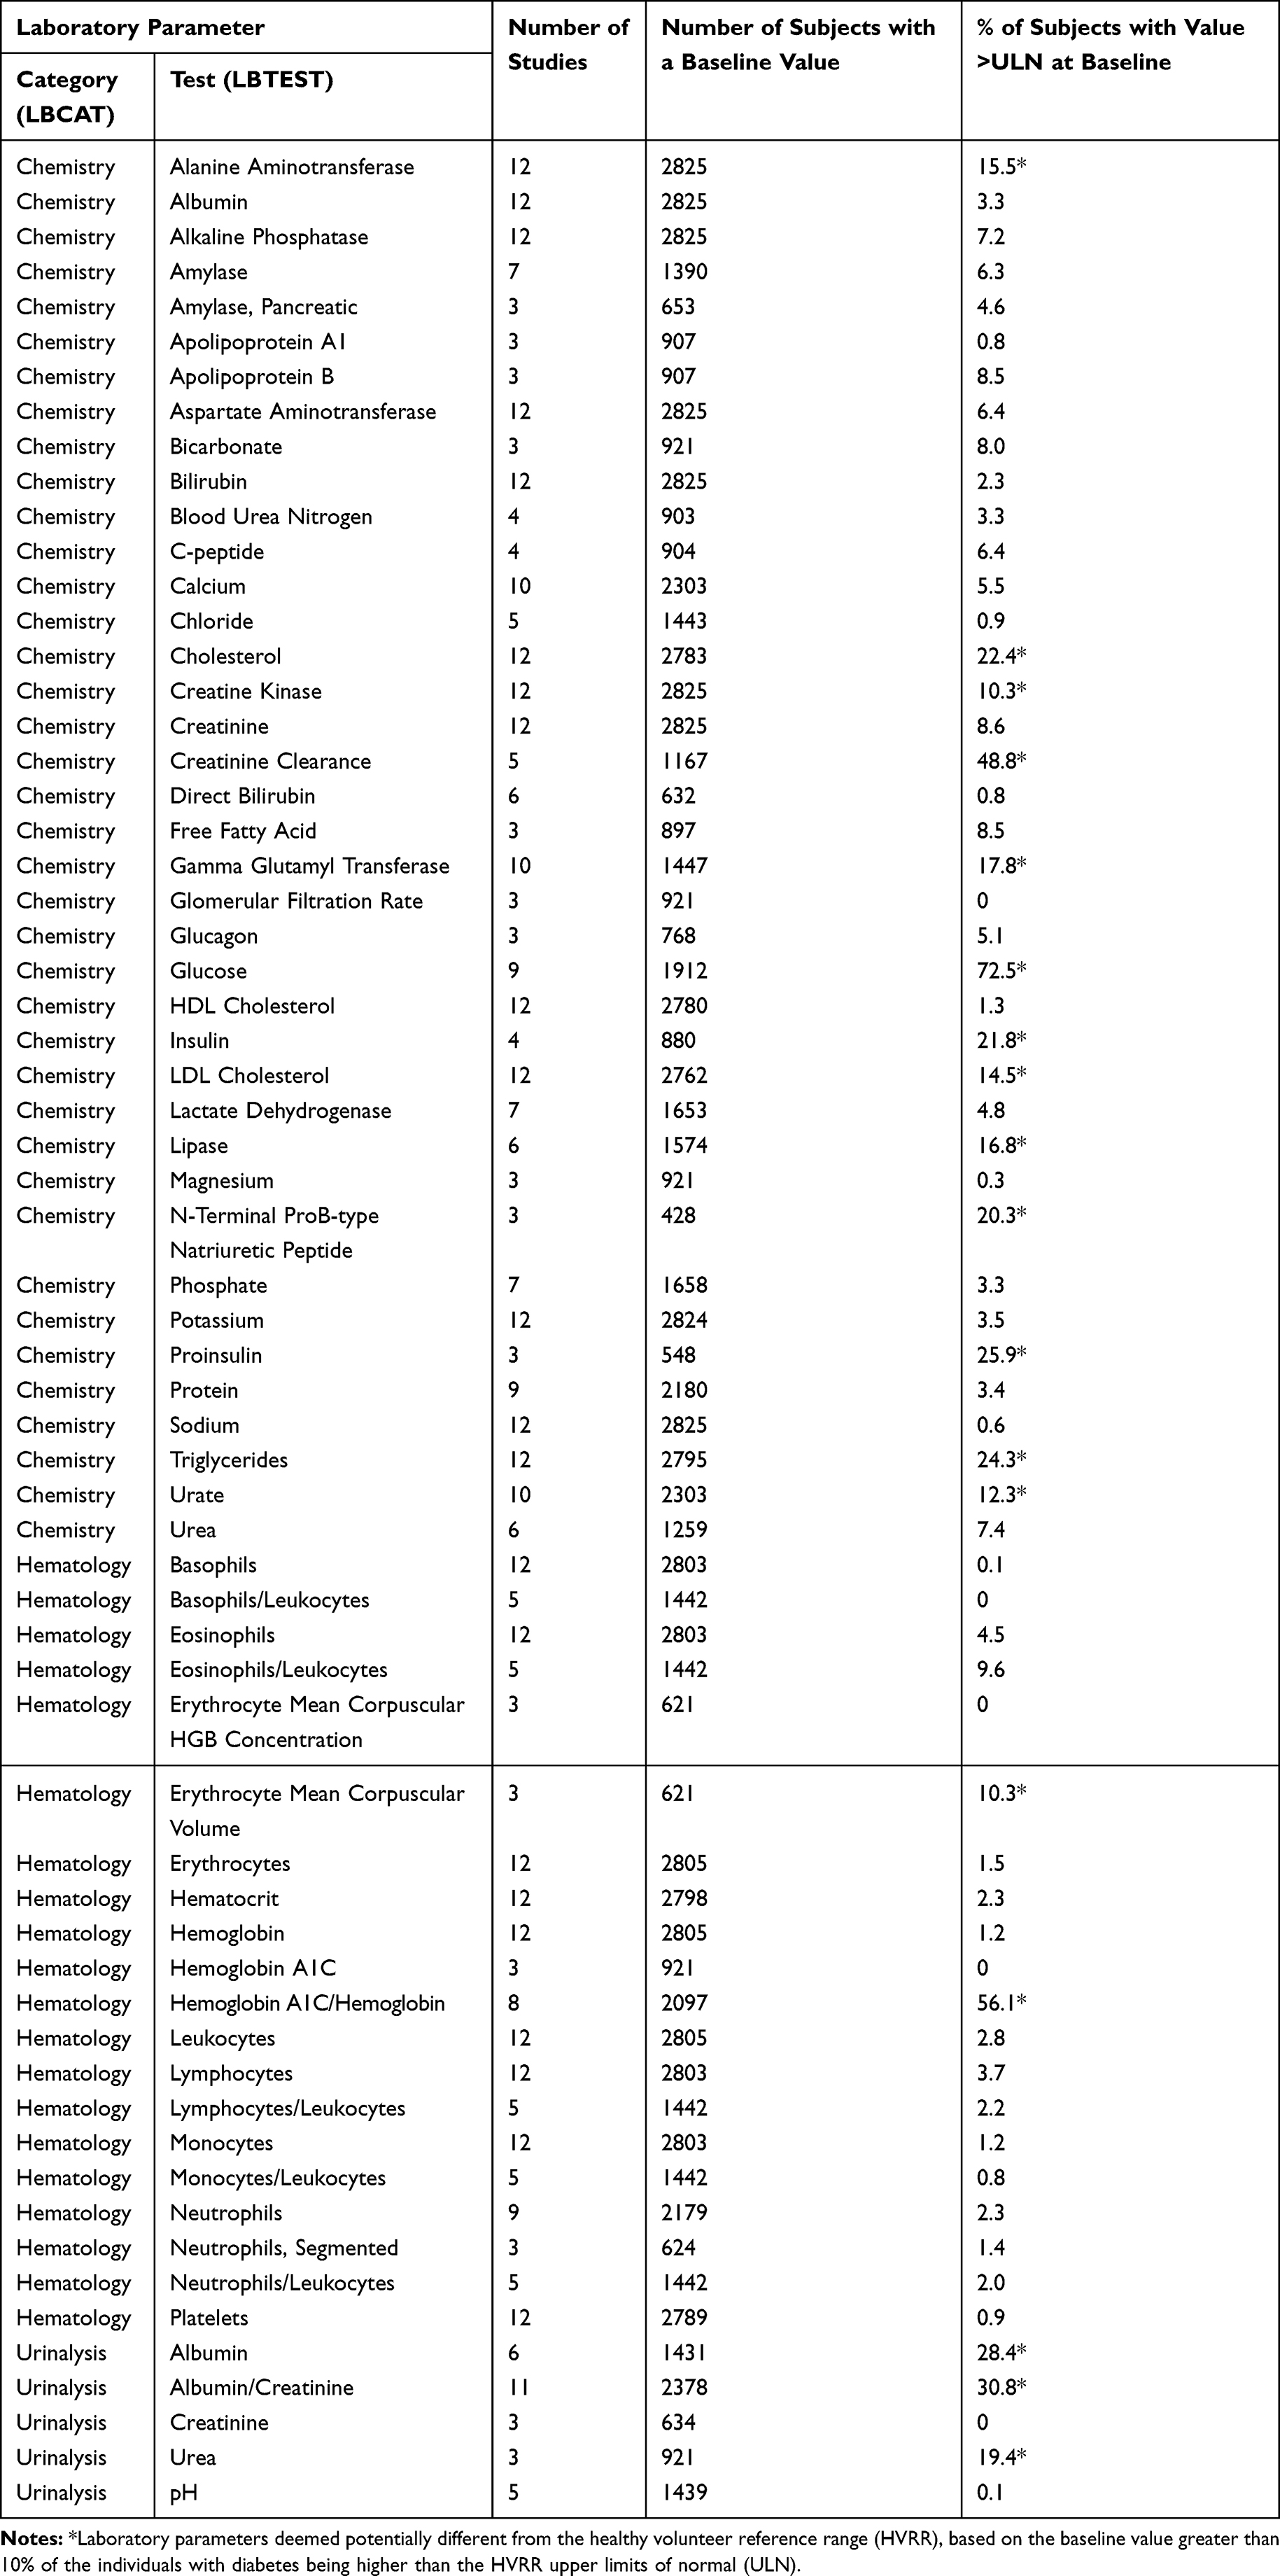 |
Table 5 Laboratory Parameters Reported in >400 Subjects and in at Least Two Studies |
The list and results of the laboratory parameters evaluated in at least 400 individuals and in at least two studies are in Table 5. As expected, the glucose levels in most individuals with diabetes (72.5%) were above the HVRR ULN. In total, approximately 28% of these laboratory parameters (Glucose along with 17 others) were potentially different from the HVRR.
Longitudinal
All laboratory parameters that were evaluated in at least 400 subjects, at a minimum of two timepoints per subject and in at least two studies were evaluated longitudinally to determine the number of laboratory values (tests) that were above the HVRR ULN (Table 6). There were 32 laboratory parameters in which none of the studies had more than 10% of the values above the HVRR ULN (Table 6 footnote). The other 32 laboratory parameters evaluated had greater than 10% of the tests above the HVRR ULN in at least one of the studies. Evaluating the total tests, approximately 33% (21 out of 64) of the laboratory parameters were potentially different from the HVRR.
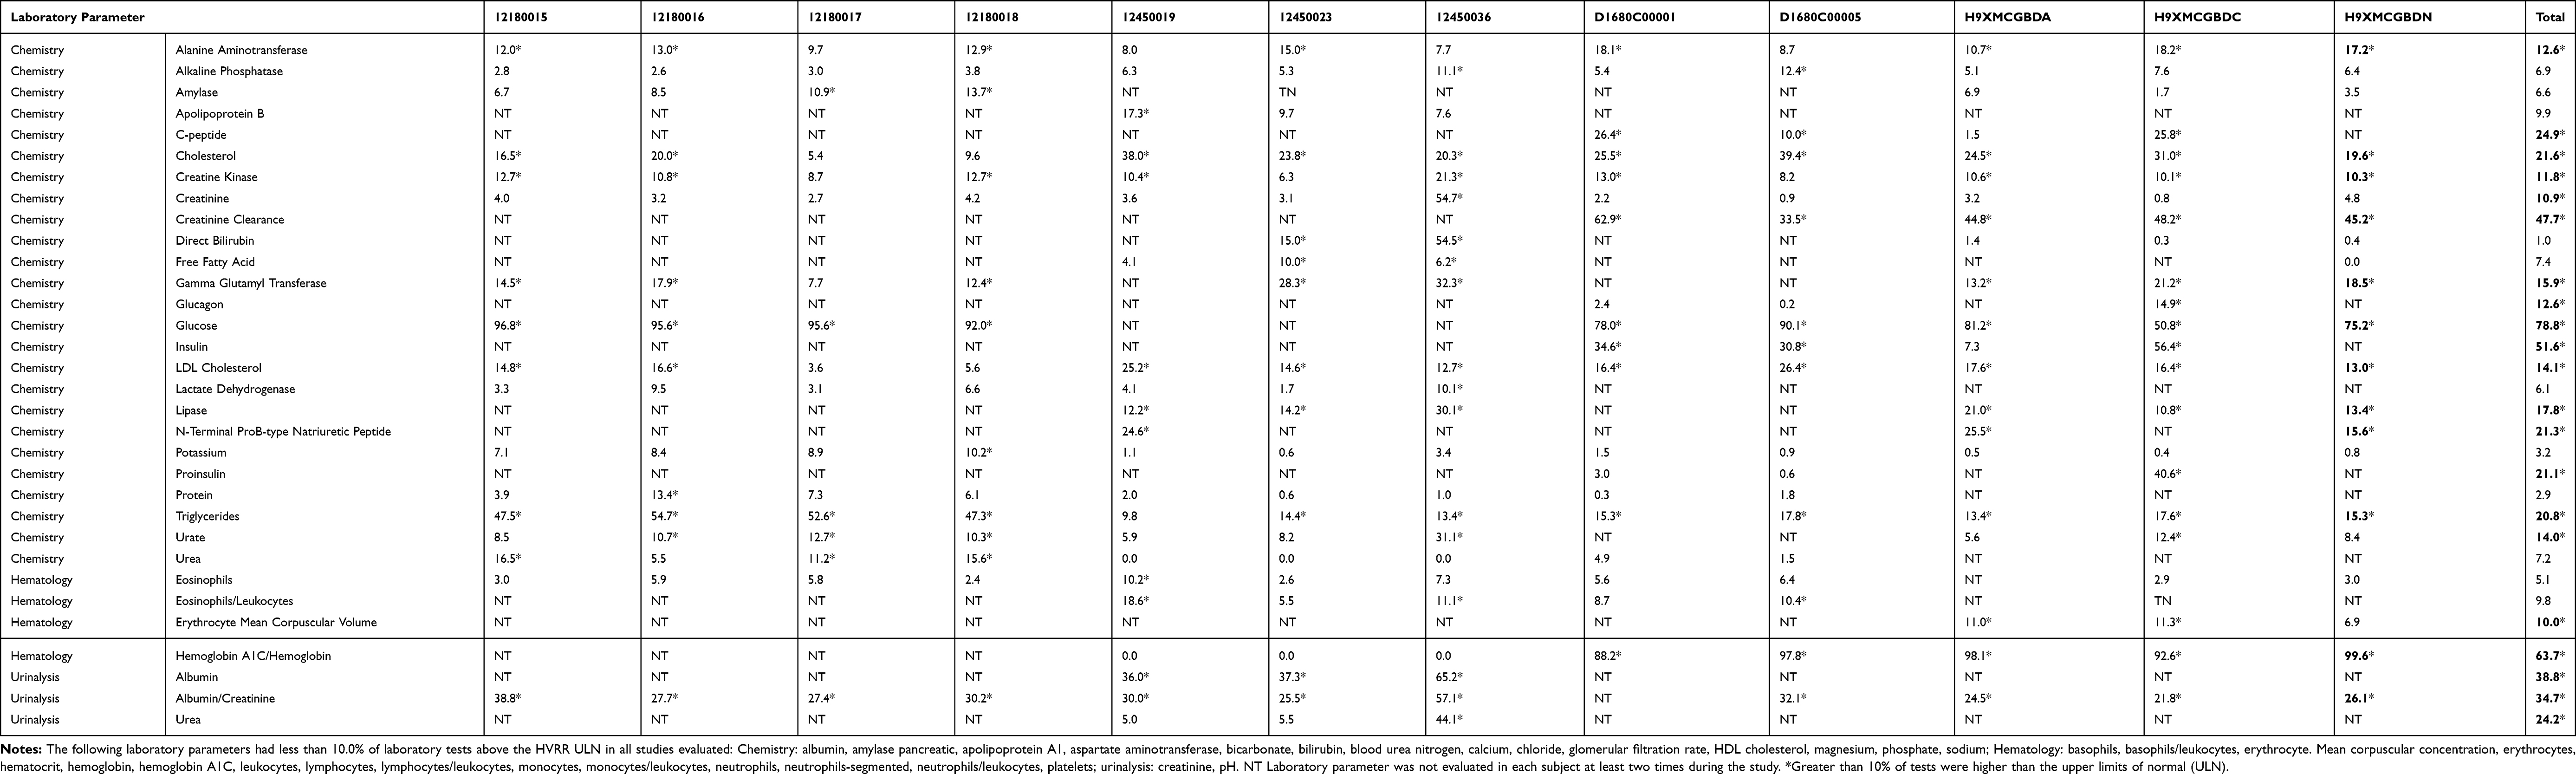 |
Table 6 Percentage of Laboratory Values Above the Upper Limits of Normal, by Study (ULN) |
The 21 laboratory parameters that were potentially different from the HVRR based on longitudinal analysis were plotted to determine if there was a difference in the natural variability between tests/subjects that were above the HVRR ULN versus those that were not (Figure 1). Thirteen of the 21 had a cutoff that was visibly distinguishable: Alanine aminotransferase = 1.5xULN, C-peptide = 1.5xULN, chemistry Creatinine =1.0xULN, Gamma Glutamyl Transferase = 1.5xULN, Glucagon = 1.0xULN, Lipase = 1.5xULN, Proinsulin = 2.0xULN, Triglycerides = 1.5xULN, Urate = 1.2xULN, Insulin = 2.0xULN, Hemoglobin A1C/Hemoglobin = 1.0xULN, Albumin = 10.0xULN, and Urea = 1.5x ULN. Cutoffs could not be determined for the other eight laboratory parameters.
 |
Figure 1 Longitudinal laboratory values (time upper limits of normal; xULN) of laboratory parameters that were potentially different from the healthy volunteer reference range. Red line is the curve fit calculation to the data and black vertical line is the determined threshold. Thresholds could not be determined for all laboratory parameters. |
The mean within-subject variability as measured by the percent coefficient of variation (%CV) was calculated for the 13 laboratory parameters that had a cutoff. It was calculated per study and for the total population in the twelve evaluated studies (Table 7). For all laboratory parameters, the within-subject variability was higher in the group above the cutoff than in the group below the cutoff.
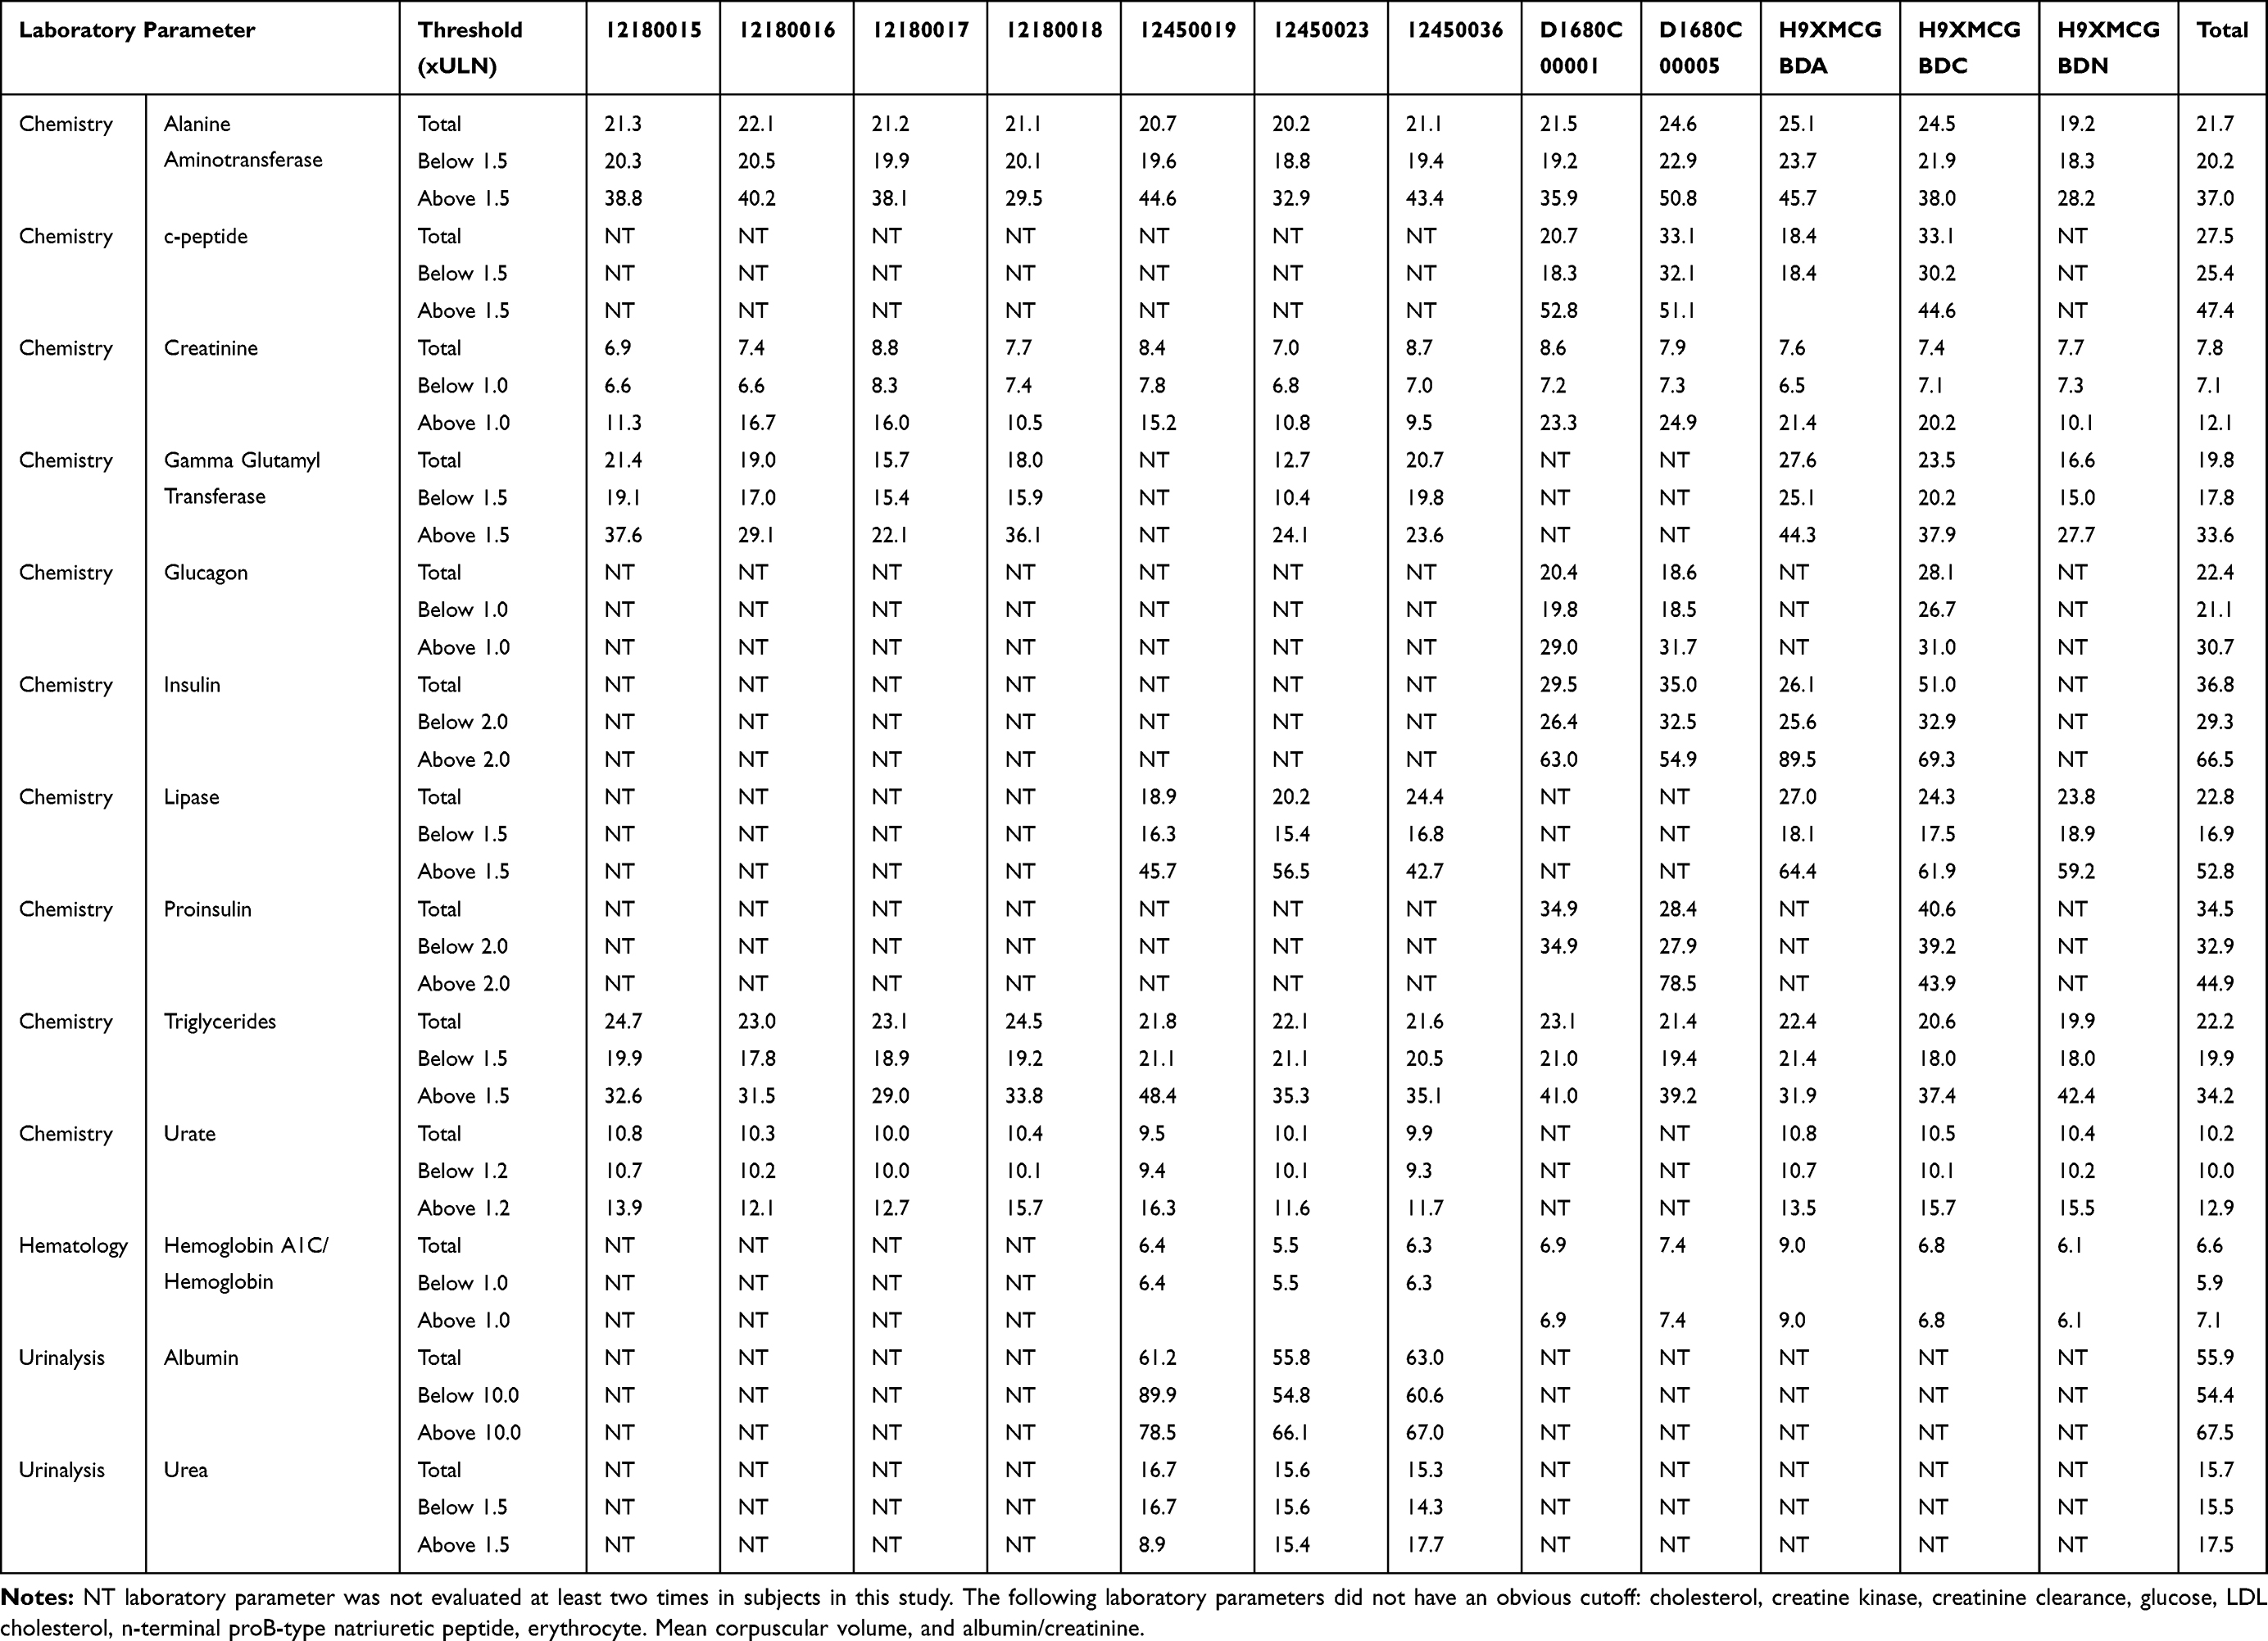 |
Table 7 Mean Within-Subject Variability (%CV) |
The upper 95% confidence interval (95% CI) limit of the within-subject variability from the total population was used to calculate the upper limit of the expected (based on PSoC within-subject variability) x-baseline using a 95% CI. These values are in the column labeled “baseline = mean”, since the formula used calculates the 95% CI from the mean (Tables 8 and 9). However, it is never known if the baseline value is the subjects mean value or if it could be the lowest expected value for that subject. Therefore, the column labeled baseline = minimum is the maximum potential x-baseline that should be observed for a subject (based on the 95% CI).
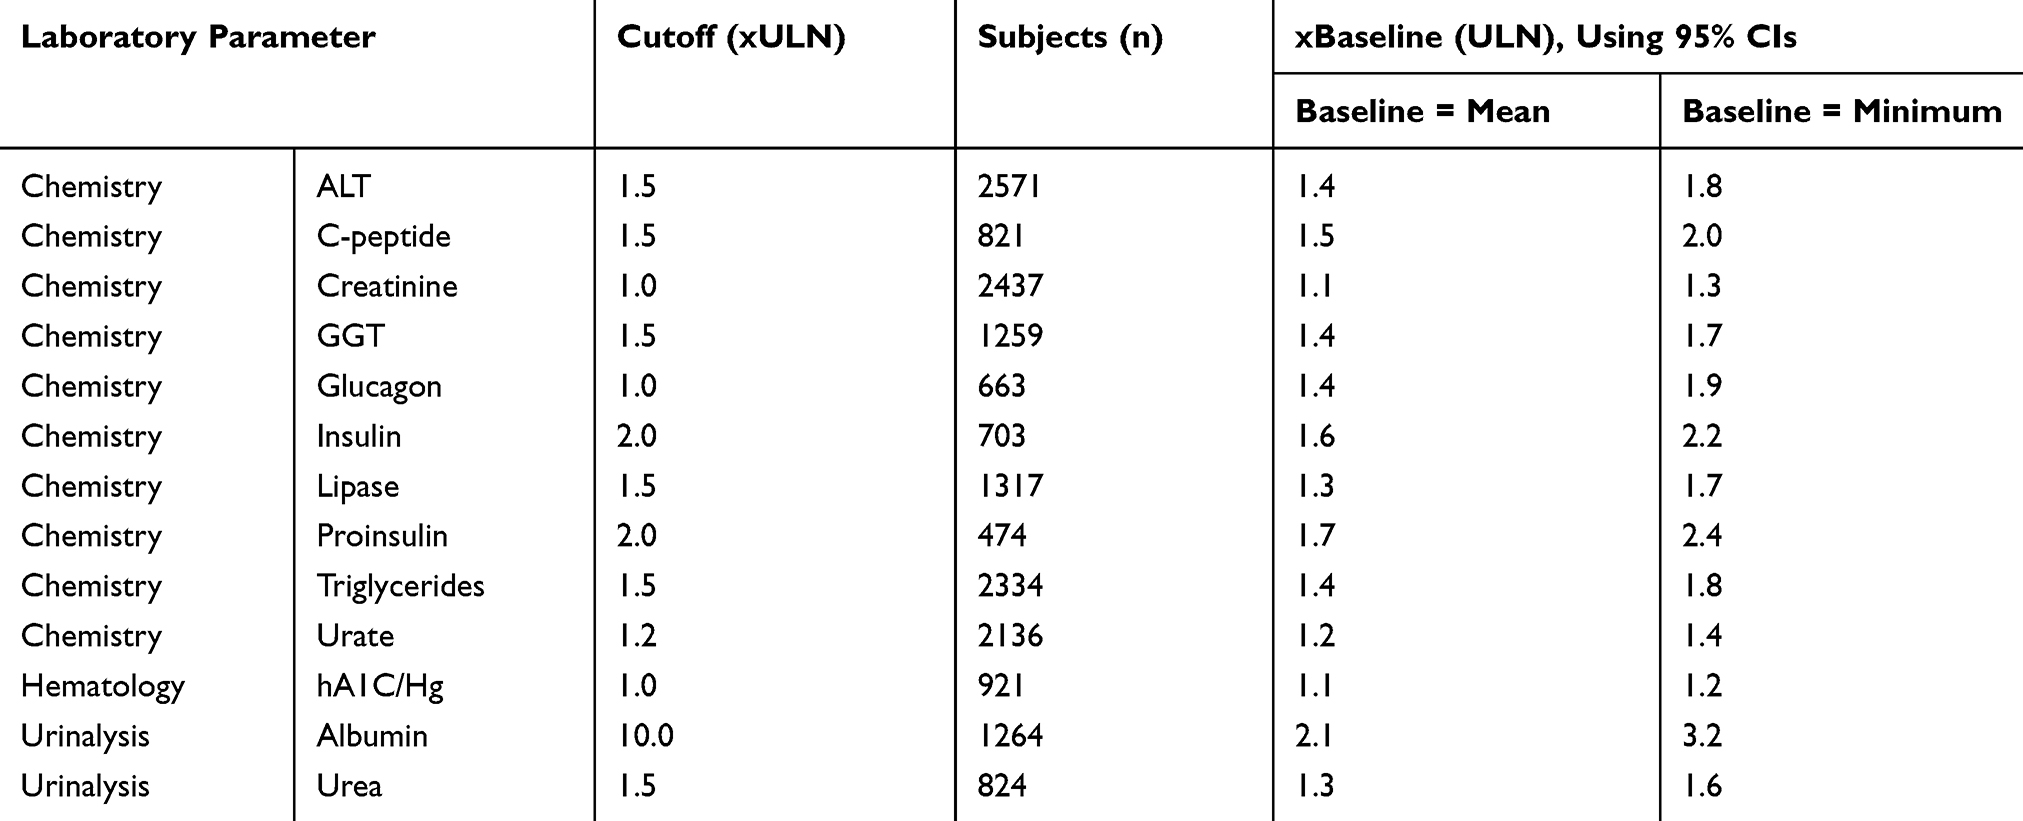 |
Table 8 Expected Fold Baseline, Based on Laboratory Parameter Variability When All Values for a Subject Were Below the Cutoff |
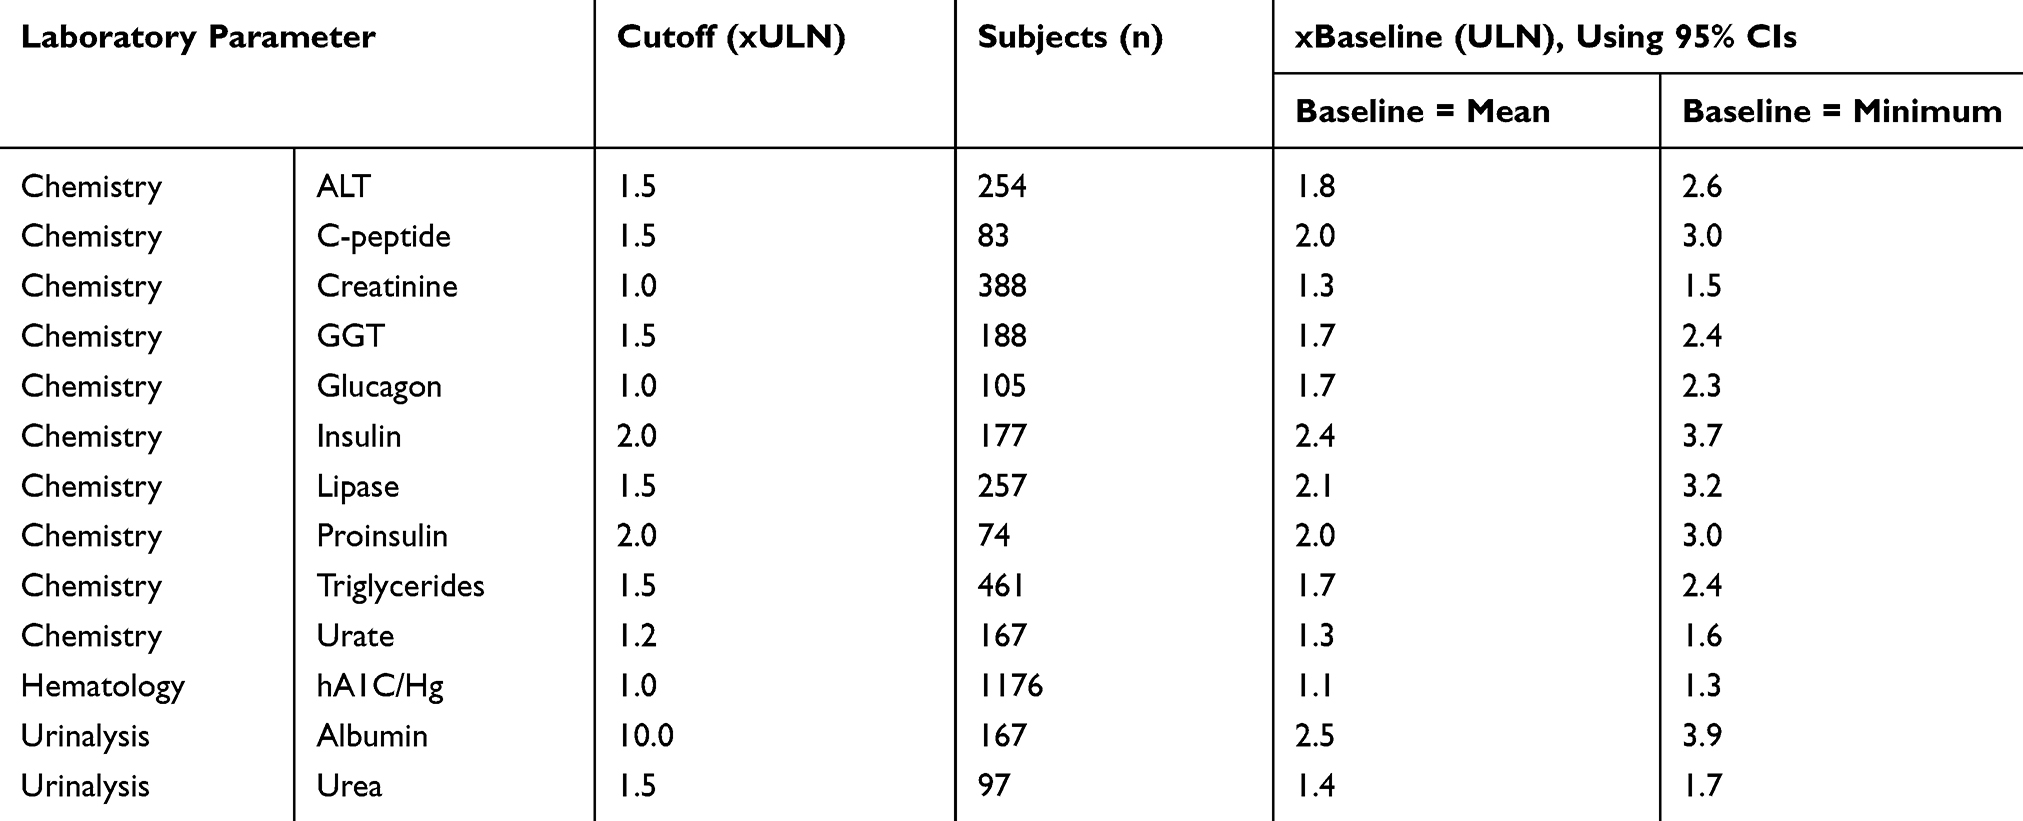 |
Table 9 Expected Fold Baseline, Based on Laboratory Parameter Variability When at Least One Value for a Subject Was Above the Cutoff |
Discussion
The Objectives of this study were to determine 1) what laboratory parameters in individuals with diabetes were potentially different from the HVRR and 2) what x-baseline should be expected in PSoC individuals with diabetes.
The TransCelerate database consisting of PSoC clinical trial data from across pharmaceutical companies contained 15 studies in the individuals with diabetes dataset, but only 12 of the studies consisting of approximately 2800 subjects had similar individual definitions and were further analyzed. The demographics did vary between studies with some being mainly white while one was 100% Asian, but no obvious demographic influences were observed within the data analysis.
Of the 64 laboratory parameters with baseline data from at least 400 subjects approximately 28% where considered potentially different from the HVRR, based on the definition of more than 10% of the subject baseline values being above the HVRR ULN. This 10% threshold was chosen to decrease the chance of false-positive classification of a laboratory parameter being different as a clinically meaningful difference from the HVRR without doing statistical analysis within this study. The HVRR reference range is a 95% CI, meaning 2.5% of the values will be above the ULN and 2.5% of values will be below the lower limits of normal (LLN). The 10% cutoff is four times the expected 2.5%. The 28% of laboratory parameters being potentially different from the HVRR is very similar to the 25% observed across patient populations and the 25% observed in the individuals with diabetes population in a pilot study evaluating only 6 laboratory parameters.3 Of the six parameters evaluated in the pilot study and this study, the results were very similar: alanine aminotransferase and glucose were potentially different from the HVRR, while neutrophil, platelets, aspartate aminotransferase and bilirubin were similar to the HVRR. Based on general medical knowledge and literature it is known that individuals with diabetes have abnormal levels of alanine aminotransferase, aspartate aminotransferase, alkaline phosphatase, amylase, gamma-glutamyl transferase, and lipase in 9–18%, 3–10%, 3–9%, 3–12%, 6–19% and 11–20% of the individuals, respectively.4–7 This study also had abnormal levels in these same parameters that fell within the expected ranges with alanine aminotransferase, gamma-glutamyl transferase and lipase all above the 10% threshold to be potentially different from the HVRR. The other parameters aspartate aminotransferase, alkaline phosphate and amylase although elevated as expected in some of the individuals with diabetes the levels were less than 10%. This suggests that the 10% threshold we have selected if anything may be too high in detecting laboratory biomarkers that are known to be elevated in a patient population. Only two of the hematology laboratory parameters were determined to be potentially different from the HVRR: as expected hemoglobin A1C/hemoglobin ratio but unexpectedly erythrocyte mean corpuscular volume. It has been shown that the erythrocyte mean corpuscular volume and some other erythrocyte laboratory parameters can be elevated in individuals with diabetes.10,11 However, these abnormal values are thought to be due to the elevated glucose levels in the cell inducing a hyperosmolar swelling of the erythrocytes and not a permanent homeostatic change to the cells. Of the laboratory parameters with less than the required 400 baseline values, it is of interest that brain natriuretic peptide, C-reactive protein and urinary alpha-1 microglobulin were greater than the ULN in more than 10% of the subjects as according to literature these three laboratory biomarkers have been shown to be elevated in individuals with diabetes.12,13 This data, although with less than 400 subjects, may, therefore, be useful in better understanding the more currently esoteric laboratory parameters.
The 28% of laboratory parameters being potentially different from the HVRR further support the pilot study and general medical judgement that it is not uncommon for laboratory parameter values to be different from the HVRR in patient populations. Furthermore, it drives the need for additional analysis of patient population data to determine if the strategy for detecting potential drug-induced signals needs to be modified. Such as the CTCAE grade 1 scoring definitions being modified for laboratory parameters, similar to the definition changes for liver function tests between CTCAE v4.03 and v5.0.
To initiate this additional analysis, the TransCelerate individuals with diabetes dataset was evaluated longitudinally with 21 of the laboratory parameters being potentially different from the HVRR. There were at least two different approaches to elucidate the expected laboratory parameter variability: use the grade 1 CTCAE cutoffs of 1.0xULN or determine if another cutoff should be used based on the data. Using the 1.0xULN cutoff could underestimate the laboratory parameter expected values as values in all subjects in a population could be shifted toward the ULN and thereby leading researchers to conclude that elevations seen during clinical trials might be a drug effect as opposed to natural disease progression. On the other hand, too high of a cutoff could decrease the number of subjects analyzed such that the result would be meaningless for signal identification/evaluation. The approach used in this study was to determine if there was an obvious threshold based on the data. Of the 21 laboratory parameters potentially different from the HVRR, 13 of them had an identifiable threshold. More data is needed to determine if such a cutoff can be made for the additional 8 laboratory parameters.
Using the 95% CI upper limit of the within-subject variability (%CV) the upper limits of the 95% CI were determined for each laboratory parameter and then reported as “x-baseline” with the baseline reported as xULN. These are the values, with more data, that could be used for changing the CTCAE grade 1 definition and signal detection in individuals with diabetes clinical trials, but the formula assumes that the baseline value would be the mean for that subject, which would be more accurate if a mean baseline value was used based on two or more baseline values measured at different visits. However, some companies and studies use only one baseline value to evaluate/identify potential safety signals in that case the “baseline = minimum” values should be used. These values assume that the one baseline measure is the minimum value for the subject and therefore if a future measure for that value is greater than this x-baseline value then it is most likely not due to the natural laboratory parameter variability (based on the 95% CI).
Worth noting are the results for the liver enzyme data. According to the CTCAE v5.0, the grade 1 criteria is 1.5–3.0 x-baseline if the baseline is abnormal, but according to the within-subject variability of PSoC individuals with diabetes, one would expect to see up 2.6 x-baseline if the baseline value was based on one measure (potentially the minimum value for that subject) or up to 1.8 x-baseline if the baseline is based on multiple measures. Using either one of the cutoffs based on the PSoC data, the CTCAE grade 1 criteria will capture false-positive signals, values between the 1.5 x-baseline of the CTCAE definition and the 1.8 or 2.6 x-baseline based on the PSoC data.
Conclusion and Next Steps
These data clearly suggest that many laboratory parameters in individuals with diabetes were similar to the HVRR but some (~28%) were potentially different from the HVRR. The data also suggest that the 1) laboratory parameters potentially different from the HVRR that a x-baseline value could help identify the upper limit of expected values and 2) CTCAE v5.0 grade 1 criteria of 1.5–3.0 x-baseline if the baseline is abnormal may capture false-positive signals in clinical trials of individuals with diabetes. Further studies with higher subject numbers will be required to determine if the 28% of laboratory parameters are different from the HVRR and what criteria should be used for signal detection/identification. Limitations of this study that need to be addressed in future studies to determine the differences between HVRR and patient populations and if the identification of laboratory parameter clinical safety signals can be improved include: 1) data from healthy volunteers to determine if the 10% cutoff used in this study was appropriate, 2) data from other patient populations to determine if the x-baseline values identified in individuals with diabetes are specific for this population or if the x-baseline is similar in all patient populations where the laboratory parameter is different from the HVRR, 3) determining if standard of care treatment and/or comorbidities explain increased lab values and should result in these individuals being evaluated differently than the other individuals in this population; 4) determining the impact of age, gender, and ethnicity; 5) determining which biomarkers are different from the HVRR based on statistical analysis and medical relevance; 6) evaluating a larger confirmatory dataset; 7) robust statistical analysis of x-baseline upper limit expected value; and 8) if within-subject variance is also due to disease progression.
Disclosure
All authors were employees of AstraZeneca Pharmaceuticals during the conduct of the study. The authors report no other conflicts of interest in this work.
References
1. CTCAE v4.03; June 14, 2020. Available from: https://www.eortc.be/services/doc/ctc/ctcae_4.03_2010-06-14_quickreference_5x7.pdf.
2. CTCAE v5.0; November 27, 2017. Available from: https://ctep.cancer.gov/protocolDevelopment/electronic_applications/docs/CTCAE_v5_Quick_Reference_8.5x11.pdf.
3. Brott DA, Goodman MJ, Hermann RP, et al. Are laboratory parameter (biomarker) values similar to the healthy volunteer reference range in all patient populations? Drug Des Devel Ther. 2018;12:2757–2773. doi:10.2147/DDDT.S173671
4. Steinberg W, Nauck MA, Zinman B, et al.; LEADER Trial investigators. LEADER 3-Lipase and amylase activity in subjects with type 2 diabetes: baseline data from over 9000 subjects in the LEADER trial. Pancreas. 2013;166(5):823–830.
5. Balkecemi L, Belalia M. Cross-sectional pilot study about the liver enzymes profile in type 2 diabetic patients from an Algerian west region: Wilaya of Mostaganem. Diabetes Metab Syndr. 2016;10(Suppl 1):S147–S150. doi:10.1016/j.dsx.2015.10.013
6. Rashid MH, Haque MZ, Rahman MK, et al. Study on liver dysfunction in type 2 diabetic patients in Bangladesh. Euroasian J Hepatogastroenterol. 2016;6(1):1–4. doi:10.5005/jp-journals-10018-1155
7. Salmela PI, Sotaniemi EA, Niemi M, Mäentausta O. Liver function tests in diabetic patients. Diabetes Care. 1984;7(3):248–254. doi:10.2337/diacare.7.3.248
8. Bhuyan P, Chen C, Desai J, et al. Development and Implementation of a pharma-collaborative large historical control database; 2017. Available from: http://www.transceleratebiopharmainc.com/wp-content/uploads/2015/04/TransCelerate-PSoC-Data-Sharing-White-Paper.pdf.
9. Reference intervals for clinical and lab medicine. Available from: https://ncss-wpengine.netdna-ssl.com/wp-content/themes/ncss/pdf/Procedures/PASS/Reference_Intervals_for_Clinical_and_Lab_Medicine.pdf.
10. Morse EE, Kalache G, Germino W, Stockwell R. Increased electronic mean corpuscular volume induced by marked hyperglycemia. Ann Clin Lab Sci. 1981;11(2):184–187.
11. Alamri BN, Bahabri A, Aldereihim A, et al. Hyperglycemia effect on red blood cells indices. Rev Med Pharmacol Sci. 2019;23(5):2139–2150.
12. Furukawa S, Sakai T, Niiya T, et al. B-type natriuretic peptide and renal function in Japanese patients with type 2 diabetes mellitus: the Dogo study. Endocr J. 2017;64(12):1131–1136. doi:10.1507/endocrj.EJ17-0256
13. Wan X, Zhang L, Gu H, Wang S, Liu X. The association of serum hsCRP and urinary alpha-1 microglobulin in patients with type 2 diabetes mellitus. Biomed Res Int. 2019;2019:1–10. doi:10.1155/2019/6364390
 © 2020 The Author(s). This work is published and licensed by Dove Medical Press Limited. The
full terms of this license are available at https://www.dovepress.com/terms
and incorporate the Creative Commons Attribution
- Non Commercial (unported, 3.0) License.
By accessing the work you hereby accept the Terms. Non-commercial uses of the work are permitted
without any further permission from Dove Medical Press Limited, provided the work is properly
attributed. For permission for commercial use of this work, please see paragraphs 4.2 and 5 of our Terms.
© 2020 The Author(s). This work is published and licensed by Dove Medical Press Limited. The
full terms of this license are available at https://www.dovepress.com/terms
and incorporate the Creative Commons Attribution
- Non Commercial (unported, 3.0) License.
By accessing the work you hereby accept the Terms. Non-commercial uses of the work are permitted
without any further permission from Dove Medical Press Limited, provided the work is properly
attributed. For permission for commercial use of this work, please see paragraphs 4.2 and 5 of our Terms.