Back to Journals » OncoTargets and Therapy » Volume 11
18F-fluorodeoxyglucose positron emission tomography predicts lymph node responses to definitive chemoradiotherapy in esophageal squamous cell carcinoma patients
Authors Zhu W, Zhang Y ![]() , Kong L, Huang Y, Zheng J, Wang R, Li M, Yu J
, Kong L, Huang Y, Zheng J, Wang R, Li M, Yu J ![]()
Received 21 December 2017
Accepted for publication 2 May 2018
Published 25 July 2018 Volume 2018:11 Pages 4345—4353
DOI https://doi.org/10.2147/OTT.S160456
Checked for plagiarism Yes
Review by Single anonymous peer review
Peer reviewer comments 3
Editor who approved publication: Prof. Dr. Geoffrey Pietersz
Wenyao Zhu,1,2 Yan Zhang,2 Li Kong,2 Yong Huang,3 Jinsong Zheng,3 Renben Wang,2 Minghuan Li,2 Jinming Yu2
1School of Medicine and Life Sciences, University of Jinan-Shandong Academy of Medical Sciences, Jinan, Shandong, China; 2Department of Radiation Oncology and Radiology, Shandong Cancer Hospital Affiliated to Shandong University, Jinan, Shandong, China; 3Department of Nuclear Medicine, Shandong Cancer Hospital Affiliated to Shandong University, Jinan, Shandong, China
Purpose: To evaluate the capability of 18F-fluorodeoxyglucose positron emission tomography/computed tomography (18F-FDG-PET/CT) to predict the clinical response of metastatic lymph node (mLN) to definitive chemoradiotherapy (dCRT) and guide personalized radiation dose in esophageal squamous cell carcinoma (ESCC) patients.
Patients and methods: One hundred and forty-three mLNs from 59 patients with ESCC treated with dCRT and who had undergone a pretreatment 18F-FDG-PET/CT scan were included in the study. All defined mLNs were contoured by nuclear medicine radiologists. Response was evaluated by contrast-enhanced computed tomography and 18F-FDG-PET/CT.
Results: Sixty-nine mLNs showed complete response (CR), and 74 mLNs showed non-complete response. The 143 mLNs were divided into 4 groups (Groups 1–4) based on the quartiles of maximum standardized uptake value (SUVmax-G1, SUVmax-G2, SUVmax-G3, and SUVmax-G4) and metabolic tumor volume (MTV-G1, MTV-G2, MTV-G3, and MTV-G4). The CR rate of SUVmax-G2 was significantly higher than the other 3 groups. The escalated radiation dose improved the CR rate of lymph nodes in SUVmax-G3 (55 Gy) and SUVmax-G4 (61 Gy). The lowest CR rate was found in MTV-G4 (the group with the largest MTV). The escalated radiation dose (59.7 Gy) improved the CR rate of lymph node in MTV-Groups 3 and 4.
Conclusion: Pretreatment metabolic parameters can predict the response of mLNs to dCRT for patients with ESCC. The parameters could also be used to guide personalized dose to mLNs.
Keywords: 18F-FDG-PET/CT, esophageal squamous cell carcinoma, radiotherapy, lymph node, response, radiation dose, personalized radiation dose
Introduction
Esophageal cancer (EC) is one of the common malignancies and causes of cancer deaths worldwide.1 Esophageal squamous cell carcinoma (ESCC) is the predominant histological type of EC worldwide, especially in Asia.2
At present, the standard care for the locally advanced unresectable ESCC is definitive chemoradiotherapy (dCRT).3,4 According to the results of the RTOG 90-12 study and INT0123 trial, dose escalation from 50.4 to 64.8 Gy did not improve the overall survival (OS) and pathological complete response (pCR), but increased the toxicity. The National Comprehensive Cancer Network guidelines recommended a radiation dose of 50.4 Gy to patients with ESCC for dCRT.5–7
Previous studies have suggested that response of lesions (primary tumor and metastatic lymph nodes [mLNs]) is a major determinant of recurrence and survival for patients with ESCC.8–10 Lin et al found the pCR can predict OS (48.2 vs 19.7 months) and disease-free survival (31.1 vs 6.1 months) in patients treated with dCRT.11
Most of the studies on ESCC have focused on the primary tumor and indicated that escalated dose failed to improve local control (LC) or survival.5,6,12 However, only little attention has been paid to mLN, although recent studies have indicated response of mLN is a novel prognostic factor for ESCC.13 For nodal lesions, a higher radiation dose may lead to a better response compared with the standard dose of 50.4 Gy based on the theory of radiation biology, which may confer a better prognosis.14 In addition, the advanced radiotherapy technologies, such as simultaneous integrated boost intensity-modulated radiotherapy (SIB-IMRT) techniques, allow selectively increasing the dose to partial lesions, while sparing the normal tissues and subclinical lesions.15,16
The challenge is to correctly identify the involved node which can gain a better response from the escalated dose before dCRT. 18F-fluorodeoxyglucose positron emission tomography/computed tomography (18F-FDG-PET/CT) parameters including maximum standardized uptake value (SUVmax) and metabolic tumor volume (MTV) may be promising biomarkers to predict the response of lesions and prognosis in patients with ESCC.17–19
The major aim of the present study is to evaluate the relationship between 18F-fluorodeoxyglucose (FDG) metabolic level and response of mLNs that received different irradiation doses. Our study may guide personalized radiation dose to mLN for a better outcome. To our knowledge, this has not been studied previously.
Methods
Patients and mLNs selection
Retrospectively, 59 consecutive patients with biopsy-proven locally advanced ESCC treated with dCRT in the years 2011–2017 who underwent 18F-FDG-PET/CT scan before treatment were included in the study. All patients gave written informed consent to participate in the study, which was approved by the Ethics Committee of the Shandong Cancer Hospital and Institute. mLNs were defined as follows: SUVmax >2.5 and short axis >0.5 cm.
Pretreatment evaluation
The extent of disease was evaluated by esophagoscopy, barium esophagography, computed tomography (CT), and 18F-FDG-PET/CT in all patients. The clinical stage was defined according to the criteria of the American Joint Committee on Cancer.
dCRT
Radiotherapy (RT) was delivered as either 3-dimensional conformal RT or IMRT with high-energy linear accelerators. Radiation was given at a dose of 1.8 or 2 Gy once daily for 5 days/week up to a total dose of 50.4–68.4 Gy to lesions (primary tumor and mLNs). The primary tumor and mLNs were contoured as gross tumor volume – tumor (GTVt) and gross tumor volume – nodes (GTVn), respectively. Clinical tumor volume (CTV, including CTVt and CTVn) was defined as GTV plus a 3.0 cm margin superior and inferior to the primary tumor, and a 1.0 cm radial margin plus the regional draining lymphatics. The planning target volume included each plan with a margin of 5–8 mm. Details are shown in Figure 1.
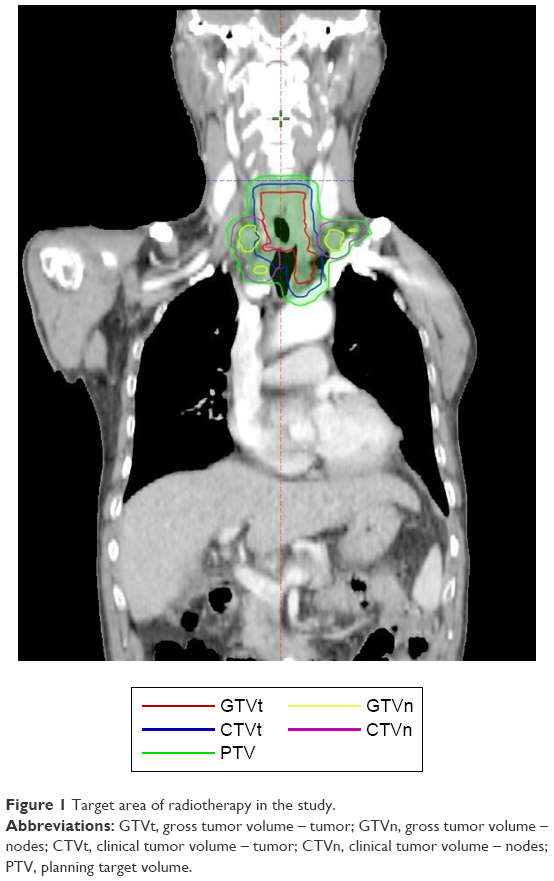 | Figure 1 Target area of radiotherapy in the study. |
All patients were treated with 2–3 cycles of chemotherapy concurrent with RT. The chemotherapy regimens used in this study included 5-Fu/platinum, docetaxel/platinum, paclitaxel/platinum, and others. Baseline data of patients and treatment characteristics are shown in Table 1.
 | Table 1 Baseline data of patients and tumor characteristics |
18F-FDG PET/CT imaging
The 18F-PET/CT scans were performed before dCRT with an integrated scanner (Discovery LS PET/CT System; GE Healthcare). All patients fasted and rested for at least 6 h, and the blood glucose level had to be <150 mg/dL before intravenous injection of 18F-FDG at a dose of 5.5 MBq/kg body weight. Whole-body images were acquired approximately 60 min after injection. PET images were acquired from the head to the proximal thigh for 5 min per field of view, each covering 14.5 cm, at an axial sampling thickness of 4.25 mm per slice. Low-dose CT data were collected in helical acquisition mode. PET data sets were reconstructed iteratively using CT data for attenuation correction. PET, CT, and fused PET/CT images displayed as coronal, sagittal, and transaxial slices, respectively, were viewed on the Xeleris workstation (GE Healthcare, Chicago, IL, USA).
18F-FDG-PET/CT analysis
PET images were transferred to the workstation in Digital Imaging and Communications in Medicine format. Using a semiautomatic gradient-based contouring algorithm (PET Edge), all visible hypermetabolic lesions were contoured for each patient by 2 experienced nuclear medicine radiologists without knowledge of the patients’ history.
The SUVmax of the lesion was measured by placing a volume of interest around the visible lesion, with careful attention to avoid inclusion of 18F-FDG-avid normal tissue. MTV was defined as the total volume of lesion with an SUV greater than the defined threshold of 2.5 in body in milliliters.
Lymph node response evaluation
Response of lesions to dCRT was evaluated within 4–8 weeks after dCRT using contrast-enhanced CT or 18F-FDG-PET/CT, and was identified as 4 classes including progressive disease (PD), stable disease (SD), partial response (PR), and complete response (CR). PD was defined as an increase of at least 20% in a lesion as measured bidimensionally, the appearance of any new lesions, or reappearance of a previously eradicated lesion. PR was defined as a decrease in the lesion, as measured bidimensionally, by at least 30% with no signs of either new lesions or progression of any existing lesions. SD was defined as a tumor response that did not fulfill the PR criteria but exceeded the PD criteria. CR was defined as the condition of disappearance of involved lymph node or no FDG-avid lesions. We define mLNs which had an outcome of PD, SD, and PR as mLNs with non-complete response (non-CR) in this article.
Statistical analysis
Statistical analyses were performed using SPSS software, version 23.0. Quantitative data for SUVmax and MTV are expressed as mean±standard deviation. mLNs were grouped based on the quartiles of metabolic parameters. Chi-square test was used to analyze the difference in CR rate among groups. Differences in parameters were analyzed by Mann–Whitney U test, independent-samples t-test, and ANOVA test. To find the effect of escalated dose in every group, receiver-operating characteristic (ROC) curve analysis was used. CR was used as the reference standard. The area under the ROC curve (AUC) provided a measure for the accuracy of response test; it ranged from 0.5 (random guessing) to 1.0 (perfect test). A P-value <0.05 from 2-sided tests was considered to indicate statistical significance.
Results
Patient characteristics and clinical outcomes
One hundred and forty-three mLNs of 59 patients met the inclusion criteria for the study. Baseline data of patients and treatment characteristics are shown in Table 1. Of the total mLNs, 69 (48.0%) had a CR and 74 (52.0%) showed non-CR. Neither SUVmax nor MTV showed a significant difference between 2 groups (P=0.313 and P=0.066, respectively). The results are summarized in Table 2.
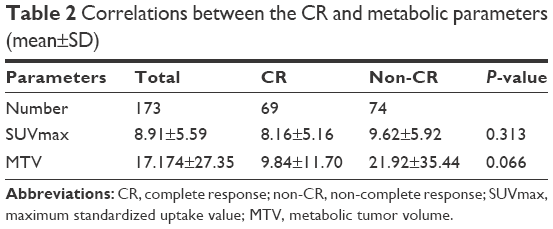 | Table 2 Correlations between the CR and metabolic parameters (mean±SD) |
Analysis of SUVmax
Based on the quartiles of SUVmax, mLNs were divided into 4 different groups: Group 1 (SUVmax-G1, 2.82–4.38), Group 2 (SUVmax-G2, 4.38–6.88), Group 3 (SUVmax-G3, 6.88–12.89), and Group 4 (SUVmax-G4, 12.89–28.41). The CR rate was 38.89%, 72.22%, 47.22%, and 34.29%, respectively (all, P=0.006). As shown in Figure 2A and Table 3A, SUVmax-G2 had the best CR rate among the 4 groups (SUVmax-G2 vs SUVmax-G1: P=0.004, SUVmax-G2 vs SUVmax-G3: P=0.031, SUVmax-G2 vs SUVmax-G4: P=0.001). In addition, there were no significant differences among the other 3 groups (all, P>0.05).
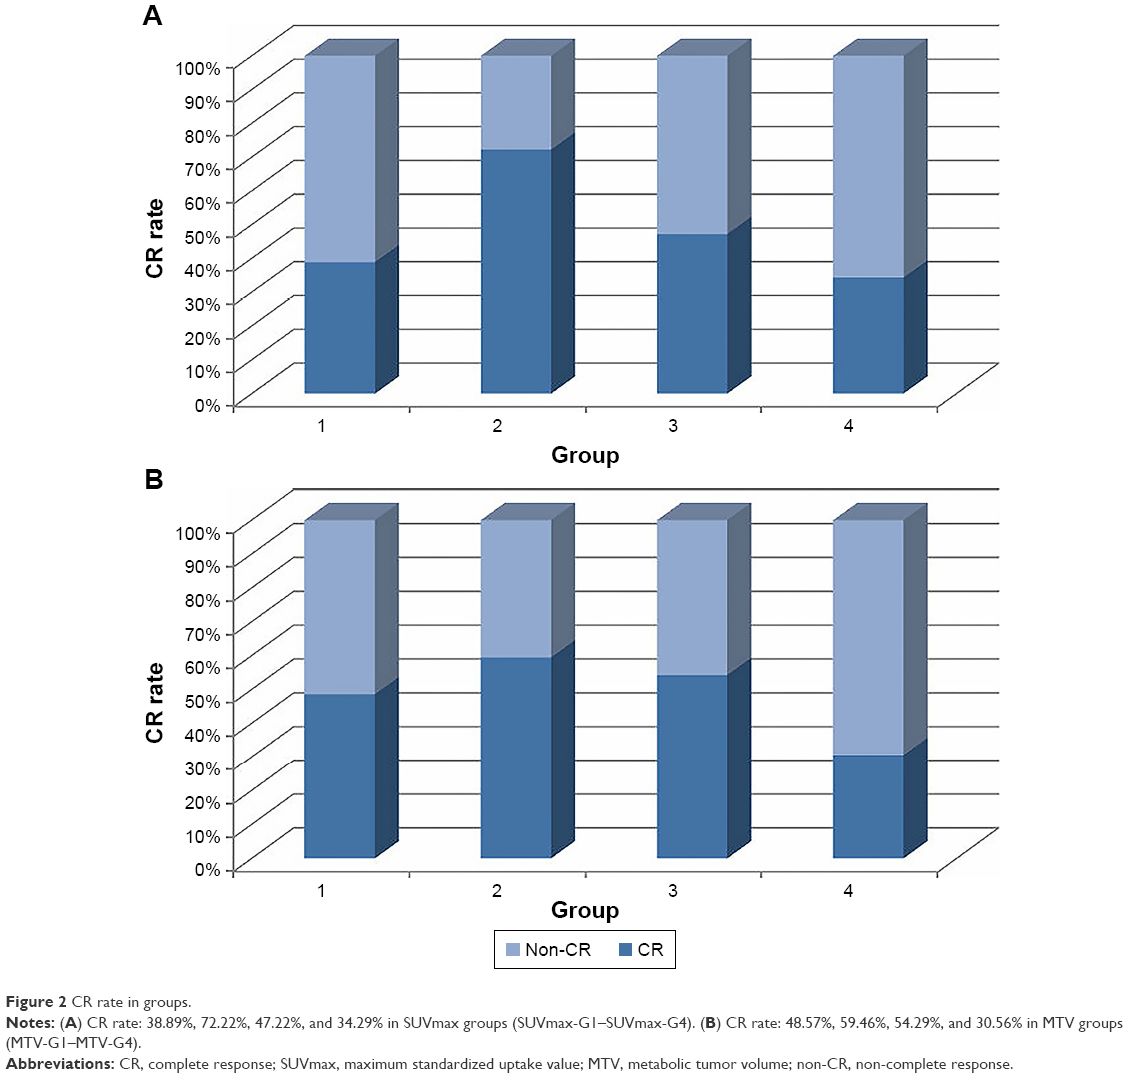 | Figure 2 CR rate in groups. |
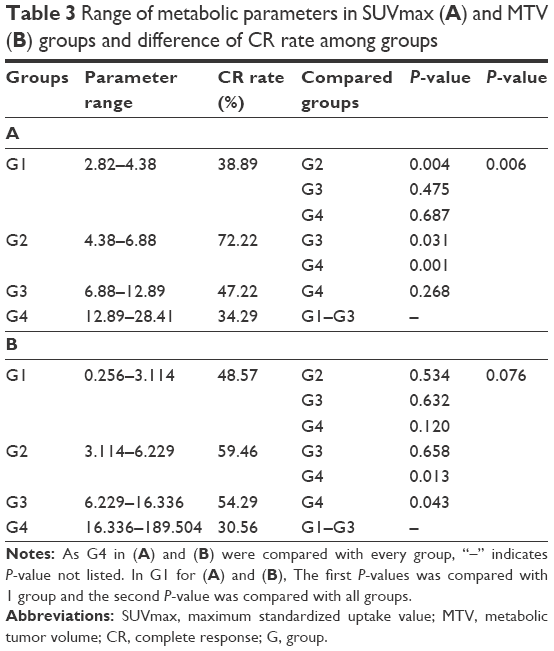 | Table 3 Range of metabolic parameters in SUVmax (A) and MTV (B) groups and difference of CR rate among groups |
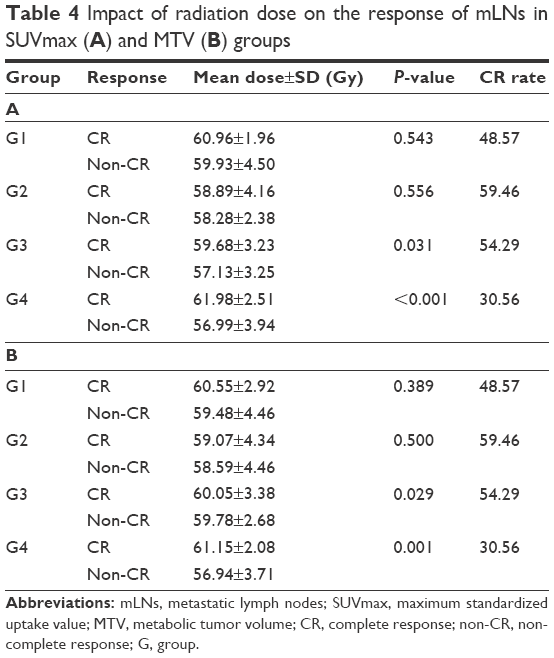
To compare the impact of radiation dose on the response of mLNs, univariate analysis was further applied to each group. The escalated dose was not found to improve the CR rate in SUVmax-G1 and SUVmax-G2 (SUVmax-G1: P=0.543, SUVmax-G2: P=0.556). However, higher radiation dose improved the CR rate of mLNs in SUVmax-G3 and SUVmax-G4 (SUVmax-G3: P=0.031, SUVmax-G4: P=0.0005). Details are shown in Table 4A.
 | Table 4 Impact of radiation dose on the response of mLNs in SUVmax (A) and MTV (B) groups |
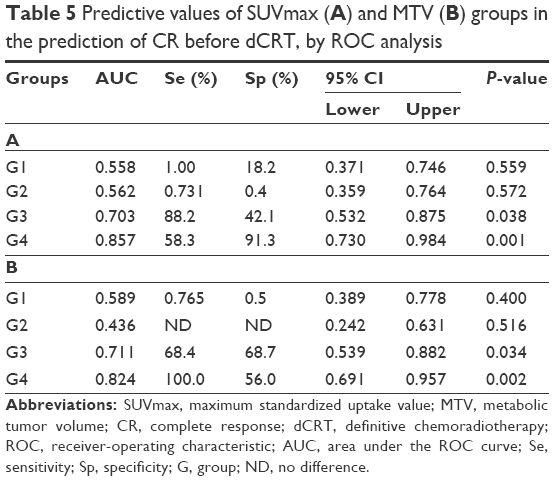
ROC curve analysis was used to identify a dose threshold which could achieve a good response to dCRT. The doses of 55 and 61 Gy were determined as thresholds with corresponding sensitivity of 88.2% and 58.3% and specificity of 42.1% and 91.3% in SUVmax-G3 and SUVmax-G4, respectively. The AUC of radiation dose was 0.703 (P=0.038, 95% CI 0.532–0.874) and 0.857 (P=0.001, 95% CI 0.730–0.984) in the 2 groups, respectively (Figure 3A and B and Table 5A).
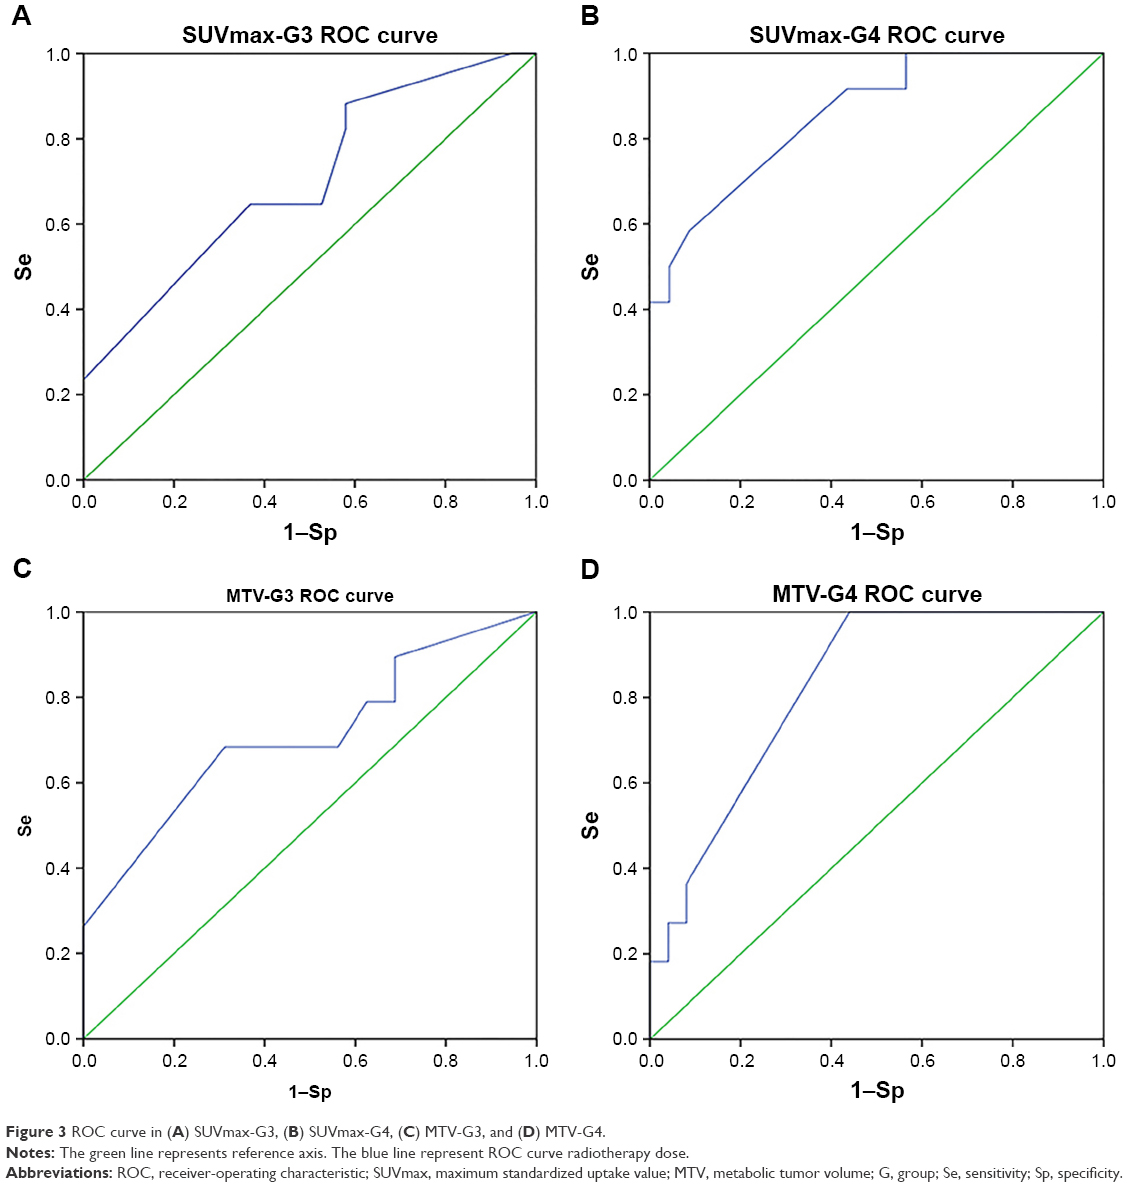 | Figure 3 ROC curve in (A) SUVmax-G3, (B) SUVmax-G4, (C) MTV-G3, and (D) MTV-G4. |
 | Table 5 Predictive values of SUVmax (A) and MTV (B) groups in the prediction of CR before dCRT, by ROC analysis |
Analysis of MTV
Based on the quartiles of MTV, mLNs were also divided into 4 different groups: Group 1 (MTV-G1, 0.256–3.114), Group 2 (MTV-G2, 3.114–6.229), Group 3 (MTV-G3, 6.229–16.336), and Group 4 (MTV-G4, 12.336–189.504). MTV values of the groups were compared using ANOVA. MTV values of G1–G3 were not significantly different (P=0.074), but the MTV of G4 was higher than the other 3 groups (P<0.001). The result is shown in Table 6. The CR rate was 48.57%, 59.46%, 54.29%, and 30.56%, respectively (all, P=0.076). As shown in Figure 2B and Table 3B, MTV-G4 had the worst CR rate among the 4 groups (MTV-G4 vs MTV-G1: P=0.12, MTV-G4 vs MTV-G2: P=0.013, MTV-G4 vs MTV-G3: P=0.043). In addition, the CR rate was not significantly different for the other 3 groups (all, P>0.05).
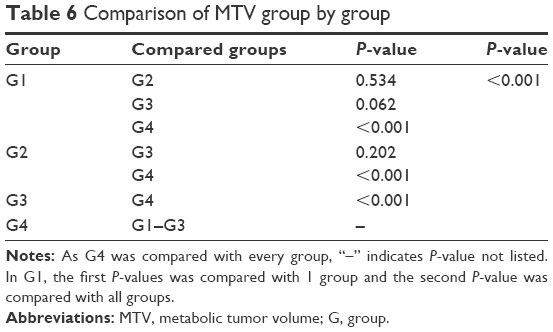 | Table 6 Comparison of MTV group by group |
Similar to SUVmax, the univariate analysis was also applied to each group. The escalated dose was not found to improve the CR rate of mLNs in MTV-G1 and MTV-G2 (MTV-G1: P=0.389 and MTV-G2: P=0.500). However, higher radiation dose improved the CR rate of mLNs in MTV-G3 and MTV-G4 (MTV-G3: P=0.029, MTV-G4: P=0.001). Details are shown in Table 4B.
ROC curve analysis was used to find an optimal dose to achieve a good response to dCRT. The dose of 59.7 Gy was optimal with corresponding sensitivity of 68.4% and 100% and specificity of 68.7% and 56% in MTV-G3 and MTV-G4, respectively. The AUC of radiation dose was 0.711 (P=0.034, 95% CI 0.539–0.882) and 0.824 (P=0.002, 95% CI 0.691–0.957) in the 2 groups, respectively (Figure 3C and D and Table 5B).
Discussion
In the present study, we retrospectively analyzed 143 mLNs from 59 patients with ESCC treated with dCRT. Although SUVmax and MTV did not show any significant difference between the CR group and non-CR group, we found that patients with different metabolic levels were showing different CR rates by dividing them into 4 groups. For example, the CR rate of mLNs in Group 2 with an SUVmax range of 4.38–6.88 was significantly higher than the other 3 groups. An escalated dose (eg, 55 and 61 Gy) may improve the CR rate of patients with higher SUVmax. For MTV, the lowest CR rate was found in the group with the largest MTV. An escalated dose (eg, 59.7 Gy) may improve the lymph nodal CR rate in the groups with larger MTV (Groups 3 and 4), which suggests that these parameters could be used to guide personalized radiation dose to mLNs before dCRT.
Some studies reported that lesions with low SUVmax could show higher CR rate than those with high SUVmax leading to potentially better LC and survival.11,19–21 However, some conflicting results revealed high initial SUVmax was associated with good response.22,23 Previous studies also revealed lesions with larger MTV always exhibited worse response.24–26
In view of the inconsistent outcomes, our study divided these mLNs into 4 subgroups with different metabolic levels (SUVmax and MTV) instead of the simple 2 groups (lower and higher metabolic groups) adopted in the available studies. According to our data, we found higher metabolic mLNs could show significantly bad response. However, the response of mLNs with the lowest FDG uptake was found to be worse in our study. The outcome may be consistent with previous studies comparing lower and higher metabolic groups. All of these data suggested that metabolic and biological heterogeneity of cancer was not interpreted fully by the simple 2 groups.
Some reports indicated FDG uptake was correlated with proliferative activity in various malignancies.27–29 Based on radiobiology, the lower proliferative activity was associated with resistance to irradiation.30 In addition, for lesions with lower metabolism, the poor response could be improved by hypofractionated irradiation.31 However, we did not find that an escalated dose could improve the CR rate (SUVmax-G1: P=0.543, MTV-G1: P=0.389). This could be because the number of cases in the lower metabolic group was too small to reveal a statistical difference and because a higher radiation dose which the mLNs require could not be applied in our study. In addition, when tracer uptake in small tumors is measured, large biases can be introduced by the partial volume effect. This factor may also have an effect on our data.
The following could be the reasons for a worse response of higher metabolic mLNs (SUVmax-G3, SUVmax-G4 and MTV-G3, MTV-G4). First, higher FDG uptake not only entails the metabolic state of whole lesion but also could mean large lesion volume size and real lesion burden. Also, Chen et al found GTVn and GTVt were significantly associated with both OS and progression-free survival.32 In addition, increased FDG uptake in tumors could be partly reflective of tumor hypoxia. Hypoxia is a common phenomenon in ESCC and renders cancers resistant to chemotherapy and RT.33,34
Based on the above theories and our data, acquiring a better response is difficult for the lesions with high FDG uptake with conventional dose. To test and verify the impact of escalated dose, we conducted an ROC analysis of radiation dose. Our results demonstrated that mLNs having higher FDG uptake (SUVmax-G3, SUVmax-G4 and MTV-G3, MTV-G4) could achieve a better response by the escalated dose. These metabolic parameters of 18F-FDG-PET/CT could also be used to guide personalized irradiation dose.
From a histology point of view, cancerous tissue is composed of a heterogeneous cell population rather than homogeneous one, with distinct molecular and phenotypic characteristics.35 The main reason for resistance to irradiation is suspected to be the biological heterogeneity of tumor cells and microenviroment.36 Based on the hypothesis that FDG uptake could be a projection of underlying tumor biology, including glucose metabolism, necrosis, oxygenation, angiogenesis, and presence of inflammatory cells, FDG uptake could reflect the sensitivity of cancer to irradiation.37 Hence, the metabolic parameters could help identify lesions which can gain a better response by an escalated dose and guide personalized dose before dCRT. In addition, escalated dose to GTV by SIB may not only reduce dose to normal tissue and subclinical lesions but also reduce the reproliferation of cancer cells.15,16,38 Therefore, FDG metabolic parameters could be used to guide personalized dose, decrease toxicity, and improve prognosis.
Despite our efforts to ensure data reliability and adjust for confounding variables, the present study had several limitations. First, it should be noted that this study evaluated response of mLNs using the clinical method, but the current gold standard to assess disease response is direct histopathological examination. Second, the cutoff values (optimal doses which show a good response) were found by the ROC analysis in higher metabolic groups, but specificity or sensitivity was not satisfactory in the groups. The reason may be the standard defining mLN is inaccurate. Third, although we could find some differences in groups, the sample size was too small to be persuasive. Hence, our outcomes need to be validated by prospective and random studies with larger numbers of patients. Our prospective study regarding personalized dose is ongoing.
Conclusion
Pretreatment metabolic parameters of 18F-FDG-PET/CT can be used to distinguish specific mLNs with different responses to dCRT for locally advanced ESCC. The metabolic parameters could be used to identify mLNs which can gain a better response by escalated radiation dose before dCRT and guide personalized dose. However, we should also pay more attention to identifying the toxicity-causing doses in clinical practice in our future studies.
Acknowledgments
This study was supported by the Natural Science Foundation of China (Grant No NSFC 81672995), National Key R&D Program of China (Grant No 2017YFC010107502), and the Key Research and Development Program of Shandong Province (Grant No 2016GSF201133).
Author contributions
All authors contributed toward data analysis, drafting and revising the paper and agree to be accountable for all aspects of the work.
Disclosure
The authors report no conflicts of interest in this work.
References
Pennathur A, Gibson MK, Jobe BA, Luketich JD. Oesophageal carcinoma. Lancet. 2013;381(9864):400–412. | ||
Wheeler JB, Reed CE. Epidemiology of esophageal cancer. Surg Clin North Am. 2012;92(5):1077–1087. | ||
Mikhail S, Wei L, Salem ME, Bekaii-Saab T. Outcomes of definitive chemoradiation in patients with esophageal cancer. Dis Esophagus. 2017;30(2):1–7. | ||
Herskovic A, Martz K, al-Sarraf M, et al. Combined chemotherapy and radiotherapy compared with radiotherapy alone in patients with cancer of the esophagus. N Engl J Med. 1992;326(24):1593–1598. | ||
Cooper JS, Guo MD, Herskovic A, et al. Chemoradiotherapy of locally advanced esophageal cancer: long-term follow-up of a prospective randomized trial (RTOG 85-01). Radiation Therapy Oncology Group. JAMA. 1999;281(17):1623–1627. | ||
Minsky BD, Neuberg D, Kelsen DP, et al. Final report of Intergroup Trial 0122 (ECOG PE-289, RTOG 90-12): Phase II trial of neoadjuvant chemotherapy plus concurrent chemotherapy and high-dose radiation for squamous cell carcinoma of the esophagus. Int J Radiat Oncol Biol Phys. 1999;43(3):517–523. | ||
Minsky BD, Pajak TF, Ginsberg RJ, et al. INT 0123 (Radiation Therapy Oncology Group 94-05) phase III trial of combined-modality therapy for esophageal cancer: high-dose versus standard-dose radiation therapy. J Clin Oncol. 2002;20(5):1167–1174. | ||
Schneider PM, Baldus SE, Metzger R, et al. Histomorphologic tumor regression and lymph node metastases determine prognosis following neoadjuvant radiochemotherapy for esophageal cancer: implications for response classification. Ann Surg. 2005;242(5):684–692. | ||
Hammoud ZT, Kesler KA, Ferguson MK, et al. Survival outcomes of resected patients who demonstrate a pathologic complete response after neoadjuvant chemoradiation therapy for locally advanced esophageal cancer. Dis Esophagus. 2006;19(2):69–72. | ||
Donahue JM, Nichols FC, Li Z, et al. Complete pathologic response after neoadjuvant chemoradiotherapy for esophageal cancer is associated with enhanced survival. Ann Thorac Surg. 2009;87(2):392–398. discussion 398–399. | ||
Lin SH, Wang J, Allen PK, et al. A nomogram that predicts pathologic complete response to neoadjuvant chemoradiation also predicts survival outcomes after definitive chemoradiation for esophageal cancer. J Gastrointest Oncol. 2015;6(1):45–52. | ||
Lemarignier C, Di Fiore F, Marre C, et al. Pretreatment metabolic tumour volume is predictive of disease-free survival and overall survival in patients with oesophageal squamous cell carcinoma. Eur J Nucl Med Mol Imaging. 2014;41(11):2008–2016. | ||
Findlay JM, Bradley KM, Wang LM, et al. Metabolic nodal response as a prognostic marker after neoadjuvant therapy for oesophageal cancer. Br J Surg. 2017;104(4):408–417. | ||
Fletcher GH. Clinical dose–response curves of human malignant epithelial tumours. Br J Radiol. 1973;46(541):1–12. | ||
Welsh J, Palmer MB, Ajani JA, et al. Esophageal cancer dose escalation using a simultaneous integrated boost technique. Int J Radiat Oncol Biol Phys. 2012;82(1):468–474. | ||
Yu W, Cai XW, Liu Q, et al. Safety of dose escalation by simultaneous integrated boosting radiation dose within the primary tumor guided by (18)FDG-PET/CT for esophageal cancer. Radiother Oncol J. 2015;114(2):195–200. | ||
Cong L, Wang S, Gao T, Hu L. The predictive value of 18F-FDG PET for pathological response of primary tumor in patients with esophageal cancer during or after neoadjuvant chemoradiotherapy: a meta-analysis. Jpn J Clin Oncol. 2016;46(12):1118–1126. | ||
Izumi D, Yoshida N, Watanabe M, et al. Tumor/normal esophagus ratio in (18)F-fluorodeoxyglucose positron emission tomography/computed tomography for response and prognosis stratification after neoadjuvant chemotherapy for esophageal squamous cell carcinoma. J Gastroenterol. 2016;51(8):788–795. | ||
Kato H, Fukuchi M, Miyazaki T, et al. Prediction of response to definitive chemoradiotherapy in esophageal cancer using positron emission tomography. Anticancer Res. 2007;27(4C):2627–2633. | ||
Abramyuk A, Tokalov S, Zophel K, et al. Is pre-therapeutical FDG-PET/CT capable to detect high risk tumor subvolumes responsible for local failure in non-small cell lung cancer? Radiother Oncol. 2009;91(3):399–404. | ||
Brink I, Hentschel M, Bley TA, et al. Effects of neoadjuvant radio-chemotherapy on 18F-FDG-PET in esophageal carcinoma. Eur J Surg Oncol. 2004;30(5):544–550. | ||
Javeri H, Xiao L, Rohren E, et al. Influence of the baseline 18F-fluoro-2-deoxy-D-glucose positron emission tomography results on survival and pathologic response in patients with gastroesophageal cancer undergoing chemoradiation. Cancer. 2009;115(3):624–630. | ||
Levine EA, Farmer MR, Clark P, et al. Predictive value of 18-fluoro-deoxy-glucose-positron emission tomography (18F-FDG-PET) in the identification of responders to chemoradiation therapy for the treatment of locally advanced esophageal cancer. Ann Surg. 2006;243(4):472–478. | ||
Blom RL, Steenbakkers IR, Lammering G, et al. PET/CT-based metabolic tumour volume for response prediction of neoadjuvant chemoradiotherapy in oesophageal carcinoma. Eur J Nucl Med Mol Imaging. 2013;40(10):1500–1506. | ||
Cazaentre T, Morschhauser F, Vermandel M, et al. Pre-therapy 18F-FDG PET quantitative parameters help in predicting the response to radioimmunotherapy in non-Hodgkin lymphoma. Eur J Nucl Med Mol Imaging. 2010;37(3):494–504. | ||
Hatt M, Visvikis D, Pradier O, Cheze-le Rest C. Baseline (1)(8)F-FDG PET image-derived parameters for therapy response prediction in oesophageal cancer. Eur J Nucl Med Mol Imaging. 2011;38(9):1595–1606. | ||
Vesselle H, Schmidt RA, Pugsley JM, et al. Lung cancer proliferation correlates with [F-18]fluorodeoxyglucose uptake by positron emission tomography. Clin Cancer Res. 2000;6(10):3837–3844. | ||
Tchou J, Sonnad SS, Bergey MR, et al. Degree of tumor FDG uptake correlates with proliferation index in triple negative breast cancer. Mol Imaging Biol. 2010;12(6):657–662. | ||
Wu X, Pertovaara H, Korkola P, Vornanen M, Eskola H, Kellokumpu-Lehtinen PL. Glucose metabolism correlated with cellular proliferation in diffuse large B-cell lymphoma. Leuk Lymphoma. 2012;53(3):400–405. | ||
Chen M, Lee JC, Lo S. Quantitative AgNOR assessment of cancer cell populations in undifferentiated nasopharyngeal carcinoma. Anal Quant Cytol Histol. 2002;24(2):89–92. | ||
Koukourakis MI. Hypofractionated and accelerated radiotherapy with amifostine cytoprotection (HypoARC): a new concept in radiotherapy and encouraging results in breast cancer. Semin Oncol. 2002;29(6 Suppl 19):42–46. | ||
Chen Y, Zhang Z, Jiang G, Zhao K. Gross tumor volume is the prognostic factor for squamous cell esophageal cancer patients treated with definitive radiotherapy. J Thorac Dis. 2016;8(6):1155–1161. | ||
Barendsen GW, Koot CJ, Van Kersen GR, Bewley DK, Field SB, Parnell CJ. The effect of oxygen on impairment of the proliferative capacity of human cells in culture by ionizing radiations of different LET. Int J Radiat Biol Relat Stud Phys Chem Med. 1966;10(4):317–327. | ||
Hockel M, Schlenger K, Mitze M, Schaffer U, Vaupel P. Hypoxia and radiation response in human tumors. Semin Radiat Oncol. 1996;6(1):3–9. | ||
Zhang J, Fujimoto J, Zhang J, et al. Intratumor heterogeneity in localized lung adenocarcinomas delineated by multiregion sequencing. Science. 2014;346(6206):256–259. | ||
Gerlinger M, Swanton C. How Darwinian models inform therapeutic failure initiated by clonal heterogeneity in cancer medicine. Br J Cancer. 2010;103(8):1139–1143. | ||
Hyun SH, Kim HS, Choi SH, et al. Intratumoral heterogeneity of (18)F-FDG uptake predicts survival in patients with pancreatic ductal adenocarcinoma. Eur J Nucl Med Mol Imaging. 2016;43(8):1461–1468. | ||
Bos LJ, Damen EM, de Boer RW, et al. Reduction of rectal dose by integration of the boost in the large-field treatment plan for prostate irradiation. Int J Radiat Oncol Biol Phys. 2002;52(1):254–265. |
 © 2018 The Author(s). This work is published and licensed by Dove Medical Press Limited. The
full terms of this license are available at https://www.dovepress.com/terms
and incorporate the Creative Commons Attribution
- Non Commercial (unported, 3.0) License.
By accessing the work you hereby accept the Terms. Non-commercial uses of the work are permitted
without any further permission from Dove Medical Press Limited, provided the work is properly
attributed. For permission for commercial use of this work, please see paragraphs 4.2 and 5 of our Terms.
© 2018 The Author(s). This work is published and licensed by Dove Medical Press Limited. The
full terms of this license are available at https://www.dovepress.com/terms
and incorporate the Creative Commons Attribution
- Non Commercial (unported, 3.0) License.
By accessing the work you hereby accept the Terms. Non-commercial uses of the work are permitted
without any further permission from Dove Medical Press Limited, provided the work is properly
attributed. For permission for commercial use of this work, please see paragraphs 4.2 and 5 of our Terms.