Back to Journals » OncoTargets and Therapy » Volume 9
18F-fludrodeoxyglucose maximal standardized uptake value and metabolic tumor burden are associated with major chemotherapy-related tumor markers in NSCLC patients
Authors Bai L, Guo CH, Wang JS, Liu X, Li Y, Li M, Guo YM, Duan XY
Received 29 May 2016
Accepted for publication 1 September 2016
Published 14 October 2016 Volume 2016:9 Pages 6315—6324
DOI https://doi.org/10.2147/OTT.S113832
Checked for plagiarism Yes
Review by Single anonymous peer review
Peer reviewer comments 2
Editor who approved publication: Dr Ingrid Espinoza
Lu Bai,1,* Chihua Guo,2,* Jiansheng Wang,3 Xiang Liu,1 Yang Li,1 Miao Li,1 Youmin Guo,2 Xiaoyi Duan2
1Department of Medical Imaging, 2Department of Orthopedics, 3Department of Oncological Surgery, First Affiliated Hospital of Xi’an Jiaotong University, Xi’an, People’s Republic of China
*These authors contributed equally to this work
Objective: Metabolic activity and tumor burden are significant for prognosis and metastasis of non-small cell lung cancer (NSCLC), including maximum standardized uptake value (SUVmax), metabolic tumor volume (MTV), and total lesion glycolysis (TLG). Chemotherapy resistance is a great challenge for treating NSCLC patients and is also closely related with several biomarkers such as epidermal growth factor receptor (EGFR), p53, and excision repair cross-complementing group 1 protein (ERCC1). Our purpose was to determine the correlation between positron emission tomography/computed tomography (PET/CT) parameters and tumor markers-related chemotherapy resistance in NSCLC.
Methods: Forty-six NSCLC chemotherapy-naïve patients were enrolled. The SUVmax, MTV, and TLG were calculated by PET/CT imaging, and expression of EGFR, p53, and ERCC1 were analyzed by immunohistochemistry on tissues. SUVmax, MTV, and TLG compared for their performance in predicting the expression of EGFR, p53, and ERCC1 were illustrated with statistical analysis.
Results: SUVmax was significantly correlated with p53 expression (P=0.001), and MTV and TLG were significantly associated with ERCC1 (P=0.000; P=0.000). Furthermore, multiple stepwise regression analysis revealed that SUVmax was the primary predictor for p53, MTV and TLG was the primary predictor for ERCC1. SUVmax had a sensitivity of 91% and specificity of 50% for the detection of p53 positive. The sensitivities of MTV and TLG were 83% and 80%, and specificities were 69% and 75% for the detection of ERCC1 positive, respectively. When we suggested p53 or ERCC1 positive, the cutoff value of SUVmax, MTV, and TLG were 7.68, 23.62, and 129.65 cm3, respectively.
Conclusion: SUVmax, MTV, and TLG were closely associated with p53 and ERCC1’ expressions. Therefore, 18F-fludrodeoxyglucose PET/CT could be a new way of predicting p53 or ERCC1-related chemotherapy effect in NSCLC patients with more convenience.
Keywords: non-small cell lung cancer, tumor markers, 18F-fludrodeoxyglucose, total lesion glycolysis, metabolic tumor volume, maximal standardized uptake values
Introduction
Lung cancer causes almost 1.38 million deaths a year worldwide, and nearly 85% are represented by non-small cell lung cancer (NSCLC).1 Chemotherapy is the most important treatment for NSCLC patients, not only for early-stage patients who have been operated as adjuvant, but also for patients with advanced disease who cannot undergo surgery.2 The combination of cisplatin and gemcitabine or vinorelbine or paclitaxel is a standard first-line chemotherapy regimen for advanced NSCLC patients with significant therapeutic effect, but due to the emergence of chemotherapy resistance, many NSCLC patients have a poor prognosis and short survival time.3,4 Therefore, early diagnosis and effective therapy are two main areas which deserve more attention.
Increasing evidence have suggested the concept that some molecular markers, including epidermal growth factor receptor (EGFR), p53, and excision repair cross-complementing group 1 protein (ERCC1), are associated with chemotherapy resistance in NSCLC,5–7 and some efforts have shown potential for the identification of clinical treatment for NSCLC patients, especially the prognosis of platinum-based chemotherapy resistance-related patients.8 As a means of optimizing patient care, identification of novel imaging biomarkers could be useful for designing clinical antineoplastic protocols and prediction of chemotherapeutic effects.
18F-fludrodeoxyglucose (18F-FDG) positron emission tomography/computed tomography (PET/CT) is a noninvasive diagnostic tool that mainly reflects both pathological and metabolic changes of biological characteristics. It has been used for diagnosis of solid tumors, treatment response monitoring, and tumor staging. In addition, there is accumulating evidence for metabolic parameters, such as standardized uptake value (SUV) measured by 18F-FDG PET, which are associated with prognosis.9 There is a growing recognition of the volume-based metabolic parameters, including metabolic tumor volume (MTV) and total lesion glycolysis (TLG), which have been used as measures of metabolic tumor burden, as promising quantitative PET indices.10–12 Recently, several studies found that MTV and TLG acted as important independent prognostic factors for survival and predicted survival more accurately than maximum standardized uptake value (SUVmax).13–15 It has been reported that MTV and TLG predicted overall survival and recurrence-free survival better than pathological tumor burden (tumor size) and metabolic activity (SUVmax) in resected pancreatic cancer.16 However, there is still insufficient knowledge about the relationship between the SUVmax, MTV, and TLG and the expression levels of some biomarkers, which were the chemotherapy-resistant tumor markers, such as EGFR, p53, and ERCC1, in NSCLC. It is important for the planning of therapeutic strategy to clarify the relationship of these molecular markers with noninvasive 18F-FDG PET/CT. Hence, we hypothesized that SUVmax, MTV, and TLG had close relationship with chemotherapy-resistant tumor markers (EGFR, p53, and ERCC1); furthermore, these parameters could be the predictors for p53, and ERCC1-positive, then serve as a tool to predict some specific chemotherapy curative effect for planning the individualized therapeutic strategy.
Patients and methods
Patients
Forty-six chemotherapy-naïve patients with pathologically diagnosed NSCLC at the cancer center of the First Affiliated Hospital of Xi’an Jiaotong University from January 2013 to December 2014 were enrolled. All the patients with intact materials received 18F-FDG PET/CT before biopsy or operation. The study protocol was approved by the Ethics Committee of Xi’an Jiaotong University and complied with the Declaration of Helsinki. Written informed consent was obtained from each enrolled patient for the use of excised tissue and medical imaging data.
All lung tumor samples were paraffin-embedded for the analysis of immunohistochemistry (IHC) and were reviewed for histological type and graded by two pathologists blinded to PET/CT results. The pathological patterns were determined by the World Health Organization (WHO) criteria. Clinical stage was classified according to the tumor-node-metastasis staging system in 2011.
PET/CT image and analysis
Patients fasted for 6 h prior to whole-body FDG PET/CT images that were acquired using a PET/CT system (GEMINI 64TF, Philips, Cleveland, USA). Emission scans were initiated 40 min following nearly simultaneous intravenous administration of FDG (3.7 MBq/kg). Coregistered images were displayed by means of SYNTEGRA software (Philips Medical Systems, Cleveland, OH, USA).17
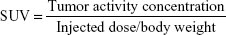
The metabolically active part of the tumor was described by an automatic algorithm based on threshold of 2.5. Volume of interest (VOI) definition and VOI analysis were performed by two nuclear physicians in a blinded manner. The result of the automatic delineation was corrected manually if nontumor parts were included in the tumor volume. The results were described by SUVmax, SUVmean, the MTV (MTV = VOI volume), and the TLG (TLG = MTV × SUVmean) according to VOI. The SUV was calculated with respect to total body weight according to the formula:
|
Immunohistochemical analysis
Protein expressions of EGFR, p53, and ERCC1 were evaluated on representative full sections of biopsy samples using the respective monoclonal antibodies: EGFR, ZM-0083, clone: 31G7, dilution 1:100 (Thermo Fisher Scientific, Waltham, MA, USA); p53, ZM-0408, clone: BP53.12, dilution 1:50 (Thermo Fisher Scientific); ERCC1, ZM-0138, clone: 4 F9, dilution 1:50 (Thermo Fisher Scientific).
Intensity of staining was scored as the following: 0 (no staining), 1 (weak staining), 2 (intermediate staining), and 3 (strong staining). The percentage of positive cells was scored as following: 0 (0%), 1 (1%–9%), 2 (10%–49%), and 3 (50%–100%) for ERCC1 and p53. For EGFR, it was 0 (0%), 1 (1%–9%), 2 (10%–25%), and 3 (>25%). According to the product of intensity staining score and percentage of positive cells score, IHC score from 0 to 9 was defined.18,19 IHC score, which was ≥1, was defined as positive expression. The slides were evaluated by two observers who had no knowledge of the corresponding clinical and pathological data. Observing nucleus and/or cytoplasm staining for p53 and ERCC1, and cell membrane and/or cytoplasm staining for EGFR were considered positive staining (Figure 1).
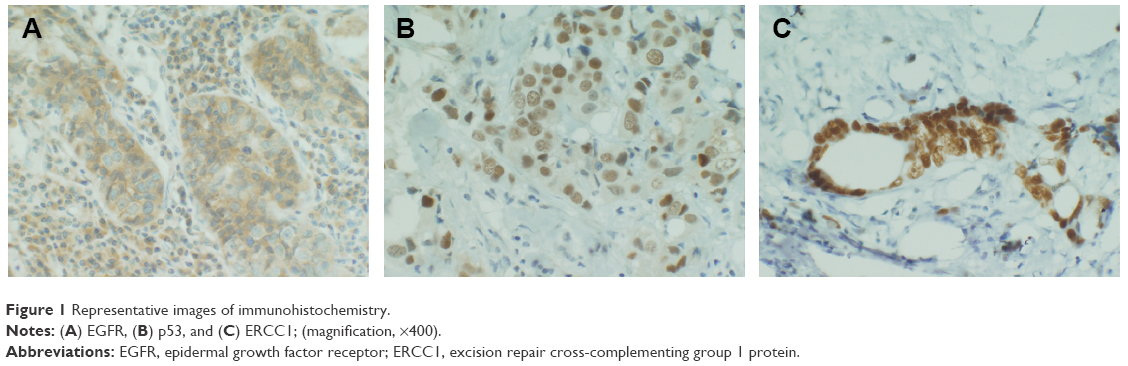 | Figure 1 Representative images of immunohistochemistry. |
Statistical analysis
The data are shown as mean ± standard error of the mean. Student’s t-test was used to test the difference in the groups of age, gender, pathological type, EGFR positivity, p53 positivity, and ERCC1 positivity. One-way analysis of the variable was used to test the difference in the groups of tumor differentiation and clinical stage. Pearson correlation analysis was used to determine the relationship between different parameters, and the value of “R” was considered as following: 0.8–1.0, highly strong correlation; 0.6–0.8, strong correlation; 0.4–0.6, moderate correlation; 0.2–0.4, weak correlation; and 0.0–0.2, no correlation. Multiple stepwise regression analysis was performed to find the primary predictor for EGFR, p53, and ERCC1. Receiver operating characteristics (ROC) curve analysis was used to explore sensitivity and specificity for SUVmax, MTV, and TLG with the certain chemotherapy resistance-related biomarkers, and evaluated the optimal cutoff values for SUVmax, MTV, and TLG ratio.20,21 All tests of significance were two-sided; P<0.05 was considered significant. The Statistical Package for the Social Sciences software p (version 20.0, IBM Corporation, Armonk, NY, USA) was used for all statistical analyses.
Results
Clinical characteristics
The demographic and clinical characteristics of the patients are summarized in Table 1. The patients’ age ranged from 41 to 80 years (median age 63 years). There were 29 males (median age 63 years) and 17 females (median age 63 years), and there was no difference between these two groups. There were two histological types, one was adenocarcinoma (n=32), and the other was squamous cell carcinoma (n=14). No significant difference in SUVmax, MTV, and TLG of the groups with different age, gender, tumor type, and clinical stage was observed. But in tumor differentiation, we found that significant difference in the SUVmax, MTV, and TLG of NSCLC with different tumor differentiation (Table 1 and Figure 2).
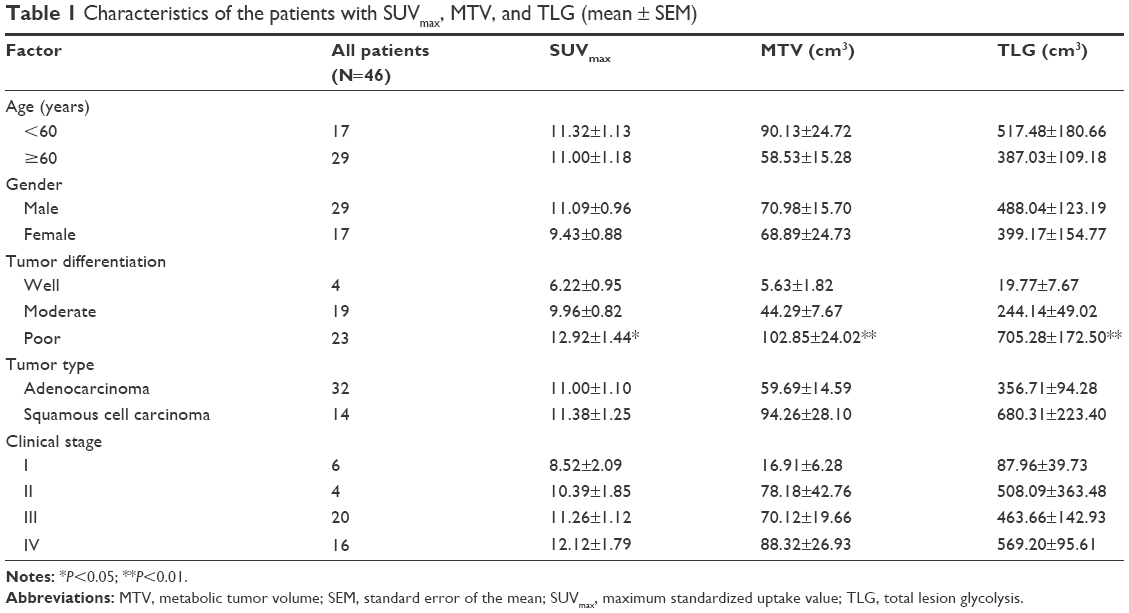 | Table 1 Characteristics of the patients with SUVmax, MTV, and TLG (mean ± SEM) |
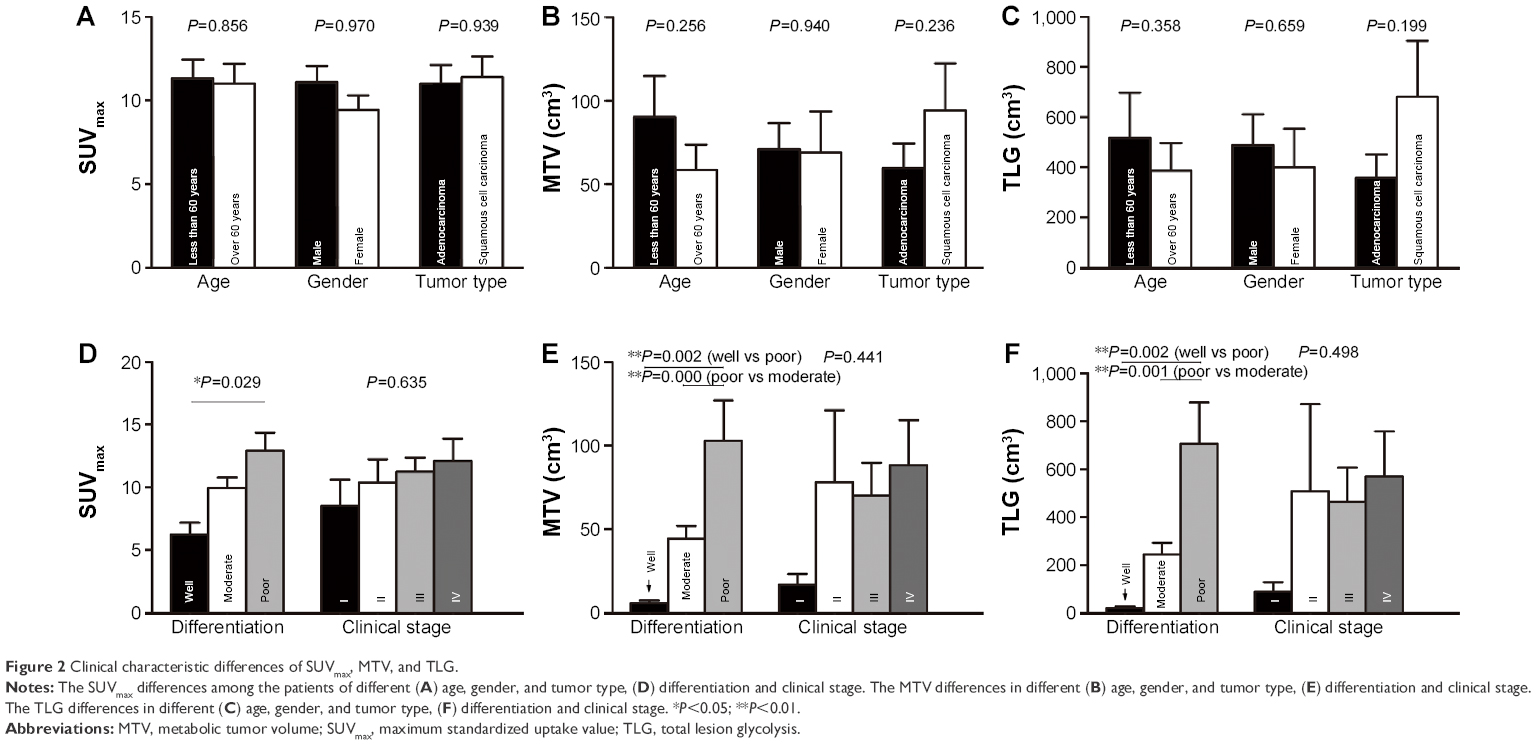 | Figure 2 Clinical characteristic differences of SUVmax, MTV, and TLG. |
Different biomarkers in SUVmax, MTV, and TLG
The positive expressions of EGFR, p53, and ERCC1 were 63.0%, 47.8%, and 65.2% in NSCLC. Furthermore, the results showed that higher SUVmax was associated with positive expression levels of p53 and ERCC1. In addition, MTVs of EGFR-positive and ERCC1-positive patients were higher than in EGFR-negative and ERCC1-negative patients and TLG in ERCC1-positive patients was higher than in ERCC1- negative patients (Figure 3). Therefore we hypothesized that these chemotherapy-related biomarkers and related changes in signaling pathways might cause aberrant tumor uptake of FDG and glucose metabolism in NSCLC cells.
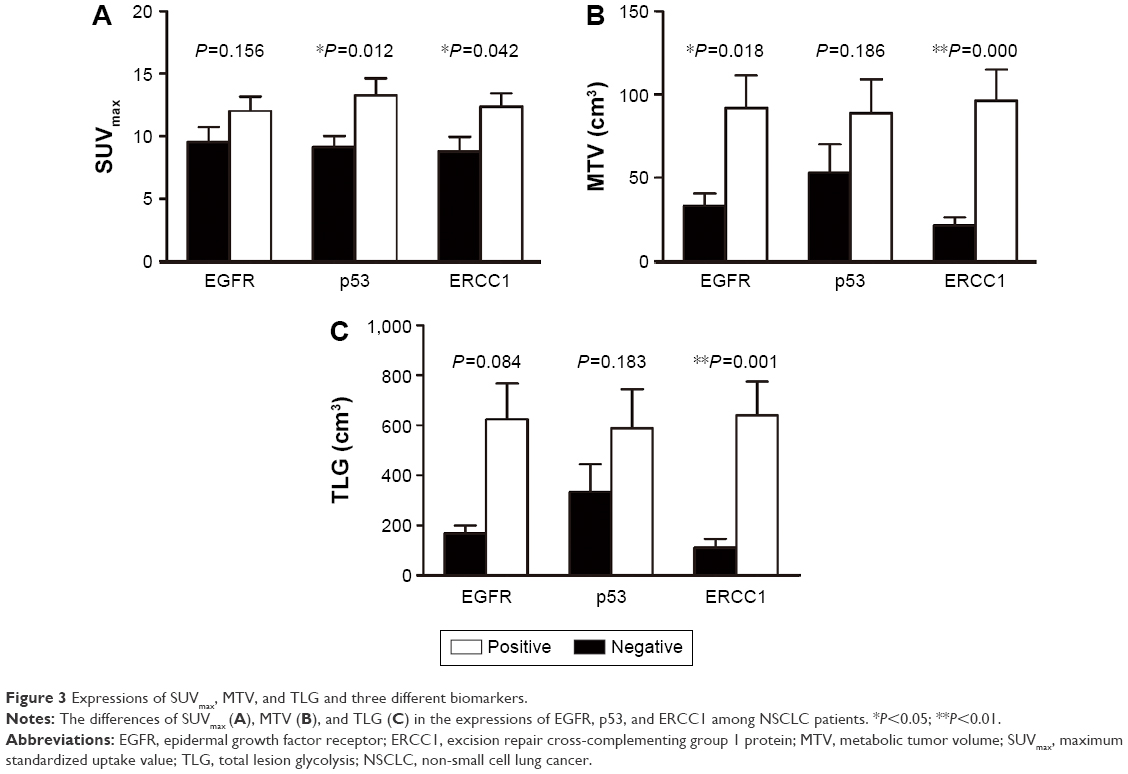 | Figure 3 Expressions of SUVmax, MTV, and TLG and three different biomarkers. |
The correlationship analysis between 18F-FDG PET/CT parameters and tumor biomarkers
As far as we know, the association between indicators of 18F-FDG PET/CT parameters and chemotherapy-related tumor biomarkers is still unknown. Table 2 demonstrates the correlationship analysis among these factors by Pearson correlation coefficient. Surprisingly, the results showed that SUVmax was significantly linearly correlated with p53 IHC score and ERCC1 IHC score, and the relevant Pearson correlation coefficient was 0.473 and 0.333, respectively, so we thought SUVmax more closely related to p53 than ERCC1, with which it has a moderate intensity correlation (Figure 4A). Moreover, MTV was significantly correlated with ERCC1, and TLG had a significant association with EGFR and ERCC1. However, ERCC1 IHC score showed a strong correlation with MTV and TLG, especially TLG (Table 2 and Figure 4B and C). So we strongly considered that TLG was the best predictor for ERCC1, based on the significant Pearson correlation coefficients. From this statistical result, it was reasonable to hypothesize that SUVmax might be used in predicting the p53-related chemotherapy resistance, and TLG might be able to predict the ERCC1-related chemotherapy resistance too. To clarify this point further, we performed the multiple stepwise regression analysis to determine which PET parameter is the primary predictor for tumor biomarker.
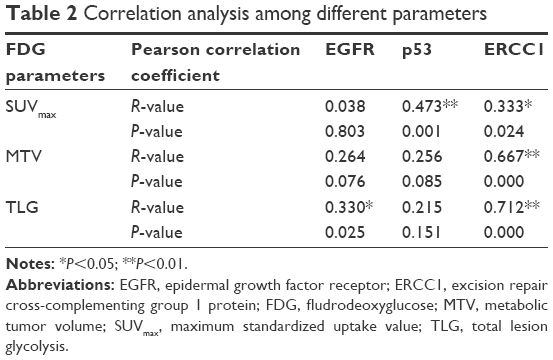 | Table 2 Correlation analysis among different parameters |
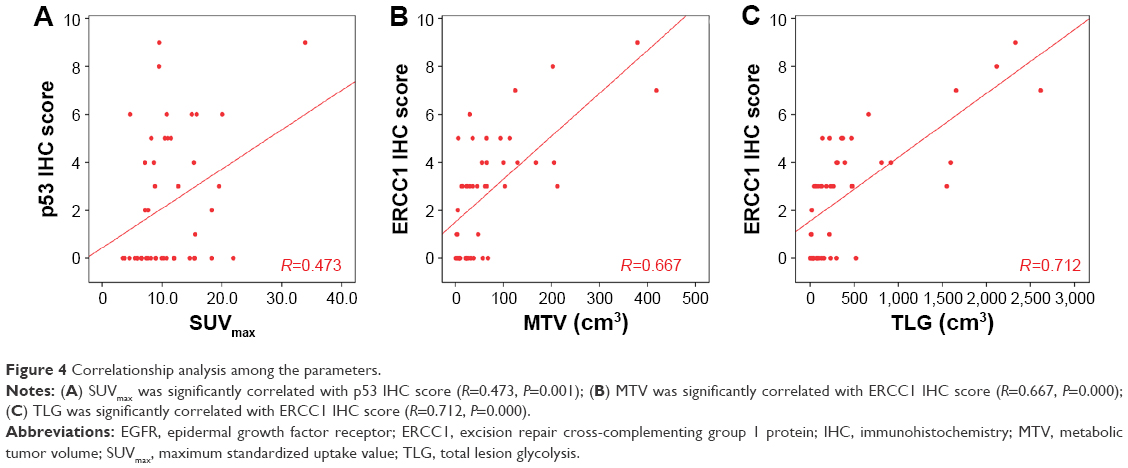 | Figure 4 Correlationship analysis among the parameters. |
The primary predictor for tumor biomarkers
The multiple stepwise regression model was used to confirm which PET parameters is the primary predictor for tumor biomarker. The results of analysis showed that SUVmax is the primary predictor for p53 IHC score, MTV and TLG are the primary predictors for ERCC1 IHC score; furthermore, the value of SUVmax might represent the p53 level required to predict the clinical outcome of p53-related chemotherapy resistance. Similarly, the MTV and TLG reflected the level of ERCC1, thus the results indicated that MTV and TLG could be useful in predicting clinical outcome of ERCC1-related chemotherapy resistance (Table 3).
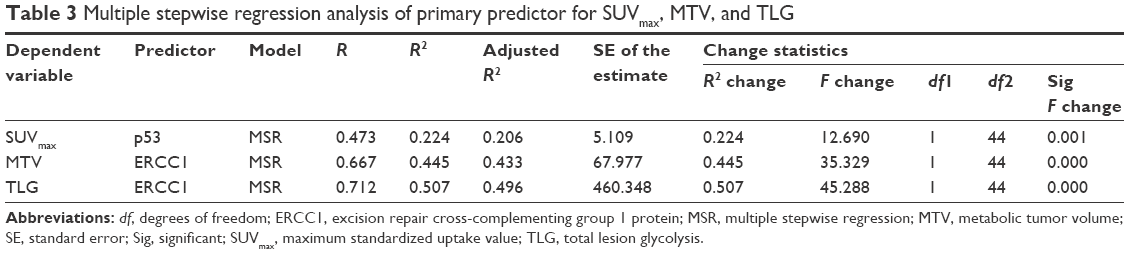 | Table 3 Multiple stepwise regression analysis of primary predictor for SUVmax, MTV, and TLG |
To compare the performance of PET parameters for predicting biomarker-related chemotherapy resistance, receiver operating characteristics curve analysis was performed. All NSCLC patients were separated into p53-positive versus p53-negative; ERCC1-positive versus ERCC1-negative. The optimal threshold for SUVmax was 7.68, which resulted in a sensitivity of 91% and specificity of 50% with p53-positive (Figure 5A). The optimal threshold for MTV was 23.62 cm3, which resulted in a sensitivity of 83% and a specificity of 69% with ERCC1-positive (Figure 5B). The optimal threshold for TLG was 129.65, which resulted in a sensitivity of 80% and a specificity of 75% with ERCC1-positive (Figure 5C). The results showed that the cutoff value of SUVmax was used to predict the p53-positive tumor cells with higher sensitivity and lower specificity in NSCLC. This might come from the moderate-intensity correlation between them; compared to MTV, the cutoff value of TLG represented the ERCC1-positive with higher sensitivity and specificity. So the TLG was the best predictor for ERCC1-positive to evaluate the ERCC1-related chemotherapy resistance in our study.
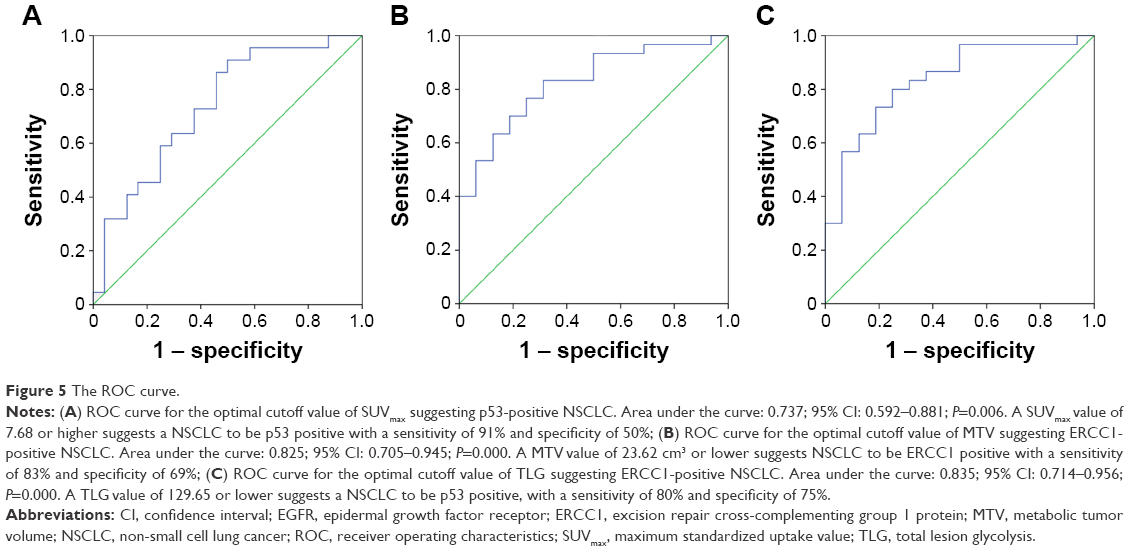 | Figure 5 The ROC curve. |
In former studies, SUVmax >2.5 was often used as a cutoff value for malignancy. But in resected NSCLC patients with metastasis to lymph nodes, the best cutoff value of SUVmax is >5 with optimized diagnosing sensitivity and specificity. In our research, the best cutoff value of SUVmax was 7.675, which is >5. In other studies, various cutoff SUVmax values have been used, ranging from 2.5 to 7. It is difficult to define an arbitrary cutoff value due to differences in patient characteristics, research purposes, use of protocols, and many other factors in studies mentioned earlier.
Discussion
18F-FDG PET/CT, one of the currently available noninvasive imaging methods, has been widely used in a variety of cancers for diagnosis, monitoring treatment response, and as a prognostic marker, especially SUVmax, MTV, and TLG. However, the relationship between chemotherapy-resistance and 18F-FDG accumulation has not yet been elucidated. In addition, some researchers reported that the high expressions of EGFR, p53, and ERCC1 were the predictors for some chemotherapy resistance in NSCLC patients, but the relationship between these high expression biomarkers and the abnormal SUVmax, MTV, and TLG of 18F-FDG-PET/CT is still unknown. So these relationships should be explained clearly in order to improve the clinical treatment of NSCLCs.
p53, one of the cancer suppressor genes in humans, is a gene with the highest frequency of mutation and has a great correlation with tumor proliferation and apoptosis.22 Mutation of p53 is usually found in nearly 50% of malignant tumors in humans, and it has been proven as the new gene that is resistant to chemotherapy drugs.23 Previous studies have demonstrated that p53 overexpression had a significant relationship with chemotherapy resistance, such as cisplatin, carboplatin, paclitaxel, and gemcitabine, and indicated a poor prognosis for NSCLC patients.24–26 In our previous study, we investigated the predictive significance of the SUVmax measured by 18F-FDG in NSCLC and proved that SUVmax might be a good noninvasive method for predicting p53-related chemotherapy resistance when the cutoff value was set at 5.15.17 The similar results of this new study also show that SUVmax of p53-positive cases was statistically higher than that of p53-negative cases. Furthermore, we offered evidence that p53 overexpression was the primary predicting factor for the SUVmax with moderate-intensity correlation. We suggest that SUVmax could be prudently used to represent p53 expression status, which is considered a predicting factor for the p53-related chemotherapy sensitivity. ERCC1, which is an important DNA repair gene, can recognize and repair these damaged DNA.27,28 The anticancer mechanism of the platinum compounds is to form adducts and covalent cross-links between DNA double strands. Furthermore, DNA damage caused by platinum compounds can be repaired by ERCC1, so, in theory, high expression of ERCC1 can reduce DNA damage caused by platinum compounds and amplify platinum antitumor effect.29 For more than a decade, it has been reported that the determination of ERCC1 expression in NSCLC cells before chemotherapy can be considered an independent predictor of the effect of cisplatin-based adjuvant chemotherapy.6 Besse et al tested the expression of ERCC1 in biopsy sample of 761 patients with NSCLC in the International Adjuvant Lung Cancer Trial (IALT), and suggested that the group of patients with ERCC1-negative tumors was sensitive to cisplatin-based adjuvant chemotherapy.30 In our research, we find that the MTV and TLG of ERCC1-positive cases were significantly higher than that of ERCC1-negative cases statistically. Besides, MTV and TLG were closely related to ERCC1 expression by Pearson correlation analysis, compared with MTV, TLG had a higher correlation coefficient, so TLG was the best predicting factor for the ERCC1 expression in our research. The earlier findings show that TLG could be used to represent ERCC1 expression status and to predict the ERCC1-related chemotherapy sensitivity. So our findings prove that TLG can be used to represent ERCC1 expression status to predict the ERCC1-related chemotherapy sensitivity.
The reason that we think TLG is much better than MTV and SUV for evaluating chemotherapy response, is that TLG is the product of mean SUV and MTV, and it combines the volumetric and metabolic information of FDG. Some previous research also supported this view, as compared to MTV, the value of TLG for solid tumor was proved in many different types of tumors, such as those from nasopharyngeal cancer, endometrial cancer, pancreatic cancer, and so on.31–33 In our research, we found that the more malignant the tumor was, the higher metabolic rate it had, and could secrete more ERCC1. This reason could explain why ERCC1 expression was closely related to TLG in NSCLC patients. Furthermore, we found that the correlation between p53 expression and SUVmax was much weaker than the correlation between ERCC1 and TLG in NSCLC patients. The reason could be that compared with SUVmax, TLG is a more comprehensive indicator as TLG reflects tumor volume and metabolic activity. Previous studies have shown that overexpression of EGFR influenced the sensitivity of NSCLC cells to chemotherapy drugs.34 Blockage of EGFR can improve the activity of chemotherapy drugs, such as cisplatin, adriamycin, and etoposide.35 Other studies have shown that NSCLC patients with EGFR overexpression usually had a poor remission rate after chemotherapy. In the past few years, the relationship between SUVmax and EGFR has been demonstrated. In invasive lobular carcinoma, Jung et al found that the SUVmax in EGFR-positive tumor cells was higher than EGFR-negative cells but there was no correlation between SUVmax and EGFR expression in esophageal cancer specimens.36 In our study, we found that there was no relationship between EGFR expression and SUVmax, MTV, and TLG in NSCLCs; our findings suggested that 18F-FDG PET/CT is not suitable for predicting the treatment outcome of EGFR-related chemotherapy resistance and evaluating the therapeutic effect of anti-EGFR targeted therapy for NSCLCs.
Our study on the 46 NSCLC patients is the first to report that SUVmax, MTV, and TLG of 18F-FDG PET/CT might be a predicting parameter for some chemotherapy-resistant NSCLCs, especially for the p53- or ERCC1-related chemotherapy sensitivity. p53-related poor prognosis and chemotherapy resistance might be the most relevant parameter for SUVmax, and ERCC1 might be the most relevant parameter for TLG. In addition, we innovatively set the cutoff value of SUVmax and TLG, respectively, at 7.68 and 129.65 cm3 with the optimal sensitivity and specificity to estimate the positive expressions of p53 and ERCC1; thus our results could be used as clinical applications to design chemotherapy regimens and predict the poor prognosis and chemotherapy response for NSCLCs. Our research results show that 18F-FDG PET/CT could be a good, simple, and noninvasive method to evaluate the effects of p53 and ERCC1-related chemotherapy response, and these results may be helpful for clinical doctors when making therapeutic decisions.
Limitations
However, we acknowledge that our study has several shortcomings. First, the nature of data collection was from a single center. Second, this was a retrospective study with a relatively small sample. Third, multiple biomarkers and PET/CT-related parameters should be combined to predict the curative effects and prognoses because of the complexity of NSCLC chemotherapy resistance. Therefore, it was risky to use p53 and ERCC1 as the biomarkers for chemotherapy resistance in NSCLC, not to mention using SUVmax and TLG of 18F-FDG PET/CT to represent p53 and ERCC1 for evaluating the effect of the treatment. In order to really apply the SUVmax and TLG in the clinical settings, a larger, multicenter prospective randomized study, which uses standardized protocols, should be validated in a larger sample before being used in clinical practice.
Conclusion
PET/CT parameters (SUVmax, MTV, and TLG) were associated with the expressions of p53 and ERCC1. The expression of p53 was the primary predictor for SUVmax, and the expression of ERCC1 was the primary predictor for TLG, which was better than MTV. Therefore, PET/CT could be considered as a new way for predicting the p53- and ERCC1-related chemotherapy response in NSCLC patients. These promising imaging parameters need larger prospective multicenter studies with standardization and validation.
Acknowledgment
This work was supported by the Natural Science Foundation of China (81471710). The abstract of this paper was presented as an abstract at the European Congress of Radiology 2016, March 2–6, 2016, in Vienna, Austria. The abstract has been published in Insights into Imaging, March 2016 Volume 7, Supplement 1: ECR 2016 Book of Abstracts.
Disclosure
The authors report no conflicts of interest in this work.
References
Jemal A, Bray F, Center MM, Ferlay J, Ward E, Forman D. Global cancer statistics. CA Cancer J Clin. 2011;61(2):69–90. | ||
Yan TD, Black D, Bannon PG, McCaughan BC. Systematic review and meta-analysis of randomized and nonrandomized trials on safety and efficacy of video-assisted thoracic surgery lobectomy for early-stage non-small-cell lung cancer. J Clin Oncol. 2009;27(15):2553–2562. | ||
Azzoli CG, Baker S Jr, Temin S, et al. American Society of Clinical Oncology Clinical Practice Guideline update on chemotherapy for stage IV non-small-cell lung cancer. J Clin Oncol. 2009;27(36):6251–6266. | ||
Azzoli CG, Temin S, Aliff T, et al. 2011 Focused update of 2009 American society of clinical oncology clinical practice guideline update on chemotherapy for stage IV non-small-cell lung cancer. J Clin Oncol. 2011;29(28):3825–3831. | ||
Soria JC, Wu YL, Nakagawa K, et al. Gefitinib plus chemotherapy versus placebo plus chemotherapy in EGFR-mutation-positive non-small-cell lung cancer after progression on first-line gefitinib (IMPRESS): a phase 3 randomised trial. Lancet Oncol. 2015;16(8):990–998. | ||
Cai Y, Yan X, Zhang G, et al. The predictive value of ERCC1 and p53 for the effect of panobinostat and cisplatin combination treatment in NSCLC. Oncotarget. 2015;6(22):18997–19005. | ||
Li C, Liu M, Yan A, et al. ERCC1 and the efficacy of cisplatin in patients with resected non-small cell lung cancer. Tumour Biol. 2014;35(12):12707–12712. | ||
Xu C, Hao K, Hu H, et al. Expression of the enhancer of zeste homolog 2 in biopsy specimen predicts chemoresistance and survival in advanced non-small cell lung cancer receiving first-line platinum-based chemotherapy. Lung Cancer. 2014;86(2):268–273. | ||
Berghmans T, Dusart M, Paesmans M, et al. Primary tumor SUVmax measured on fluorodeoxyglucose positron emission tomography (FDG-PET) is of prognostic value for survival in non-small cell lung cancer (NSCLC): a systematic review and meta-analysis (MA) by the European Lung Cancer Working Party for the IASLC Lung Cancer Staging Project. J Thorac Oncol. 2008;3(1):6–12. | ||
Hyun SH, Choi JY, Shim YM, et al. Prognostic value of metabolic tumor volume measured by 18F-fluorodeoxyglucose positron emission tomography in patients with esophageal carcinoma. Ann Surg Oncol. 2010;17(1):115–122. | ||
Moon SH, Choi JY, Lee HJ, et al. Prognostic value of 18F-FDG PET/CT in patients with squamous cell carcinoma of the tonsil: comparisons of volume-based metabolic parameters. Head Neck. 2013;35(1):15–22. | ||
Choi KH, Yoo Ie R, Han EJ, et al. Prognostic value of metabolic tumor volume measured by (18)F-FDG PET/CT in locally advanced head and neck squamous cell carcinomas treated by surgery. Nucl MedMol Imaging. 2011;45(1):43–51. | ||
Shi S, Ji S, Qin Y, et al. Metabolic tumor burden is associated with major oncogenomic alterations and serum tumor markers in patients with resected pancreatic cancer. Cancer Lett. 2015;360(2):227–233. | ||
Kajáry K, Tőkés T, Dank M, Kulka J, Szakáll S Jr, Lengyel Z. Correlation of the value of 18F-FDG uptake, described by SUVmax, SUVavg, metabolic tumour volume and total lesion glycolysis, to clinicopathological prognostic factors and biological subtypes in breast cancer. Nucl Med Commun. 2015;36(1):28–37. | ||
Yoo SW, Kim J, Chong A, et al. Metabolic Tumor Volume Measured by F-18 FDG PET/CT can Further Stratify the Prognosis of Patients with Stage IV Non-Small Cell Lung Cancer. Nucl Med Mol Imaging. 2012;46(4):286–293. | ||
Xu HX, Chen T, Wang WQ, et al. Metabolic tumour burden assessed by (1)(8)F-FDG PET/CT associated with serum CA19-9 predicts pancreatic cancer outcome after resection. Euro J Nucl Med Mol Imaging. 2014;41(6):1093–1102. | ||
Duan XY, Wang W, Wang JS, Shang J, Gao JG, Guo YM. Fluorodeoxyglucose positron emission tomography and chemotherapy-related tumor marker expression in non-small cell lung cancer. BMC Cancer. 2013;13:546. | ||
Remmele W, Stegner HE. Recommendation for uniform definition of an immunoreactive score (IRS) for immunohistochemical estrogen receptor detection (ER-ICA) in breast cancer tissue. Pathologe. 1987;8(3):138–140. | ||
Cheng AN, Jiang SS, Fan CC, et al. Increased Cdc7 expression is a marker of oral squamous cell carcinoma and overexpression of Cdc7 contributes to the resistance to DNA-damaging agents. Cancer Lett. 2013;337(2):218–225. | ||
Gao S, Wu H, Li W, et al. A pilot study imaging integrin αvβ3 with RGD PET/CT in suspected lung cancer patients. Euro J Nucl Med Mol Imaging. 2015;42(13):2029–2037. | ||
Kitajima K, Suenaga Y, Ueno Y, et al. Preoperative risk stratification using metabolic parameters of (18)F-FDG PET/CT in patients with endometrial cancer. Euro J Nucl Med Mol Imaging. 2015;42(8):1268–1275. | ||
Rosenthal AN, Ryan A, Al-Jehani RM, Storey A, Harwood CA, Jacobs IJ. p53 codon 72 polymorphism and risk of cervical cancer in UK. Lancet. 1998;352(9131):871–872. | ||
Ng JW, Lama D, Lukman S, Lane DP, Verma CS, Sim AY. R248Q mutation-Beyond p53-DNA binding. Proteins. 2015;83(12):2240–2250. | ||
Knappskog S, Lonning PE. P53 and its molecular basis to chemoresistance in breast cancer. Expert Opin Ther Targets. 2012;16(Suppl 1):S23–S30. | ||
Reles A, Wen WH, Schmider A, et al. Correlation of p53 mutations with resistance to platinum-based chemotherapy and shortened survival in ovarian cancer. Clin Cancer Res. 2001;7(10):2984–2997. | ||
Breen L, Heenan M, Amberger-Murphy V, Clynes M. Investigation of the role of p53 in chemotherapy resistance of lung cancer cell lines. Anticancer Res. 2007; 27(3A):1361–1364. | ||
Deng Q, Yang H, Lin Y, et al. Prognostic value of ERCC1 mRNA expression in non-small cell lung cancer, breast cancer, and gastric cancer in patients from Southern China. Int J Clin Exp Pathol. 2014;7(12):8312–8321. | ||
Lafuente-Sanchis A, Zuniga A, Galbis JM, et al. Prognostic value of ERCC1, RRM1, BRCA1 and SETDB1 in early stage of non-small cell lung cancer. Clin Trans Oncol. 2016;18(8):798–804. | ||
McNeil EM, Astell KR, Ritchie AM, et al. Inhibition of the ERCC1-XPF structure-specific endonuclease to overcome cancer chemoresistance. DNA Repair (Amst). 2015;31:19–28. | ||
Besse B, Massard C, Haddad V, et al. ERCC1 influence on the incidence of brain metastases in patients with non-squamous NSCLC treated with adjuvant cisplatin-based chemotherapy. Ann Oncol. 2011;22(3):575–581. | ||
Pak K, Cheon GJ, Nam HY, et al. Prognostic value of metabolic tumor volume and total lesion glycolysis in head and neck cancer: a systematic review and meta-analysis. J Nucl Med. 2014;55(6):884–8790. | ||
Moon SH, Choi JY, Lee HJ, et al. Prognostic value of volume-based positron emission tomography/computed tomography in patients with nasopharyngeal carcinoma treated with concurrent chemoradiotherapy. Clin Exp Otorhinolaryngol. 2015;8(2):142–148. | ||
Liu FY, Chao A, Lai CH, Chou HH, Yen TC. Metabolic tumor volume by 18F-FDG PET/CT is prognostic for stage IVB endometrial carcinoma. Gynecol Oncol. 2012;125(3):566–571. | ||
Popat S, Mok T, Yang JC, et al. Afatinib in the treatment of EGFR mutation-positive NSCLC – a network meta-analysis. Lung Cancer. 2014;85(2):230–238. | ||
Yang ZY, Liu L, Mao C, et al. Chemotherapy with cetuximab versus chemotherapy alone for chemotherapy-naive advanced non-small cell lung cancer. Cochrane Database Syst Rev. 2014;11:CD009948. | ||
Jung NY, Kim SH, Choi BB, Kim SH, Sung MS. Associations between the standardized uptake value of (18)F-FDG PET/CT and the prognostic factors of invasive lobular carcinoma: in comparison with invasive ductal carcinoma. World J Surg Oncol. 2015;13:113. |
 © 2016 The Author(s). This work is published and licensed by Dove Medical Press Limited. The
full terms of this license are available at https://www.dovepress.com/terms
and incorporate the Creative Commons Attribution
- Non Commercial (unported, 3.0) License.
By accessing the work you hereby accept the Terms. Non-commercial uses of the work are permitted
without any further permission from Dove Medical Press Limited, provided the work is properly
attributed. For permission for commercial use of this work, please see paragraphs 4.2 and 5 of our Terms.
© 2016 The Author(s). This work is published and licensed by Dove Medical Press Limited. The
full terms of this license are available at https://www.dovepress.com/terms
and incorporate the Creative Commons Attribution
- Non Commercial (unported, 3.0) License.
By accessing the work you hereby accept the Terms. Non-commercial uses of the work are permitted
without any further permission from Dove Medical Press Limited, provided the work is properly
attributed. For permission for commercial use of this work, please see paragraphs 4.2 and 5 of our Terms.