")
Back to Journals » Nature and Science of Sleep » Volume 16
Development and Validation of a Nomogram for Predicting Obstructive Sleep Apnea Severity in Children
Authors Liu Y , Xie SQ, Yang X, Chen JL, Zhou JR
Received 20 October 2023
Accepted for publication 7 February 2024
Published 22 February 2024 Volume 2024:16 Pages 193—206
DOI https://doi.org/10.2147/NSS.S445469
Checked for plagiarism Yes
Review by Single anonymous peer review
Peer reviewer comments 3
Editor who approved publication: Dr Valentina Alfonsi
Yue Liu, Shi Qi Xie, Xia Yang, Jing Lan Chen, Jian Rong Zhou
School of Nursing, Chongqing Medical University, Chongqing, People’s Republic of China
Correspondence: Jian Rong Zhou; Shi Qi Xie, School of Nursing, Chongqing Medical University, 1 Medical College Road, Yu Zhong District, Chongqing, 400016, People’s Republic of China, Tel +86-135 0830 0955 ; +86-156 0833 2043, Fax +86-23-63555767, Email [email protected]; [email protected]
Purpose: The clinical presentation of Obstructive Sleep Apnea (OSA) in children is insidious and harmful. Early identification of children with OSA, particularly those at a higher risk for severe symptoms, is essential for making informed clinical decisions and improving long-term outcomes. Therefore, we developed and validated a risk prediction model for severity in Chinese children with OSA to effectively identify children with moderate-to-severe OSA in a clinical setting.
Patients and Methods: From June 2023 to September 2023, we retrospectively analyzed the medical records of 367 Children diagnosed with OSA through portable bedside polysomnography (PSG). Predictor variables were screened using the least absolute shrinkage and selection operator (LASSO) and logistic regression techniques to construct nomogram to predict the severity of OSA. Receiver operating characteristic curve (ROC), calibration curve, decision curve analysis (DCA), and clinical impact curve (CIC) were used to determine the discrimination, calibration, and clinical usefulness of the nomogram.
Results: A total of 367 children with a median age of 84 months were included in this study. Neck circumference, ANB, gender, learning problem, and level of obstruction were identified as independent risk factors for moderate-severe OSA. The consistency indices of the nomogram in the training and validation cohorts were 0.841 and 0.75, respectively. The nomogram demonstrated a strong concordance between the predicted probabilities and the observed probabilities for children diagnosed with moderate-severe OSA. With threshold probabilities ranging from 0.1 to 1.0, the predictive model demonstrated strong predictive efficacy and yielded improved net benefit for clinical decision-making. ROC analysis was employed to classify the children into high and low-risk groups, utilizing the Optimal Cutoff value of 0.39.
Conclusion: A predictive model using LASSO regression was developed and validated for children with varying levels of OSA. This model identifies children at risk of developing OSA at an early stage.
Keywords: obstructive sleep apnea, children, cephalometric, prediction nomogram, risk prediction model
Introduction
A severe form of sleep-disordered breathing (SDB) known as obstructive Sleep Apnea (OSA) is characterized by repeated instances of either partial or complete blockage of the upper airway. This condition leads to compromised breathing, disrupted sleep patterns, and reduced oxygen levels.1,2 Children diagnosed with OSA may experience various complications, including pulmonary hypertension, hypertension,3 maxillofacial developmental malformations, behavioral abnormalities,4 growth and neurodevelopmental delays,5 and reduced quality of life2 if diagnosis, intervention, and treatment are delayed. Children diagnosed with severe OSA are significantly more susceptible, as indicated by multiple studies6–9 Furthermore, the treatment approaches for OSA vary depending on the severity of the condition. Early assessment of the severity of OSA in children is crucial for improving prognosis, facilitating targeted treatment, and preventing the progression of the condition.
Pediatric OSA is a challenging disease because OSA severity is associated with age, adenoid size, tonsil size (Hwang,10 2013), and obesity.11 Although nocturnal polysomnography (PSG) is considered the “gold standard” for diagnosing pediatric OSA, its application is constrained.12–14 The American Academy of Sleep Medicine (AASM)15 and the American Academy of Pediatrics16 assert that Portable monitors (PM) are suitable for patients with high clinical suspicion of OSA. PM has been shown to be a successful alternative17,18 in both retrospective studies19 and systematic reviews,20,21 particularly in high-risk groups and neglected areas.18 The accuracy of PM and their capacity to differentiate between varying degrees of severity in comparison to a full PSG will need to be further investigated.
Clinical prediction models (CPMs) serve as a valuable tool for assessing the advantages and disadvantages of medical interventions. They provide physicians and families of patients with more logical and user-friendly information.22 A three-variable prediction model for OSA in children aged three to six was developed by Certal using the Pediatric Sleep Questionnaire (PSQ) scores, tonsil size, and oxygen desaturation index (ODI).23 Wu created a decision tree model to predict the existence of severe OSA in children based on scale scores and demographic analysis.24 Si et al developed an identification algorithm based on morphological and positional attention cues for children with moderate to severe OSA using S- magnetic resonance imaging (MRI) data and magnetic resonance imaging data.25 Molnar et al investigated the effect of the tongue on upper airway obstruction and OSA26 using MRI and ultrasound. Their investigation found that anthropometric measurements and MRI AT values both reliably predicted OSA; the most significant predictive criteria were body mass index, age, neck circumference, tongue midline, and parapharyngeal fat levels.27 The above studies demonstrate how most contemporary studies on children’s OSA have extensively depended on statistical analysis of clinical examination or questionnaire data, regardless of the data or research methodology used. Due to the paucity of available data on OSA, it is difficult to accurately determine the severity of the disease and accurately depict the patient’s true clinical state.1,28
Nomogram, which is graphical tool based on statistical models, has been widely used to assess disease prognosis or predict disease diagnosis. It visualizes the results of regression equations and allow for the direct computation of variable values. This enables accurate quantification of a variety of risk factors.29 Patients with different levels of OSA severity require individualized treatment plans in clinical settings. In this context, quantitative prediction of OSA severity in children holds significant clinical importance.25 The quest for the most precise predictive model for OSA has not produced any definitive findings over the past decade. The intricate nature of the diagnostic process required for identifying the condition presents a significant challenge in accurately predicting it. The anthropometric variables (including body mass index and neck/waist circumference), clinical symptoms (snoring and obstructive mouth breathing),30 upper airway soft tissue structure,31 and facial measures,32–34 have been widely used as the primary factors in regression studies. To the best of our knowledge, there is a lack of documented nomogram that are based on cephalometric, clinical examination (portable PSG) and clinical symptoms (dysphagia, learning problems, sleep problems, and lack of concentration). Additionally, there is currently no established set of standardized screening techniques for OSA in children with different levels of severity.35 In this study, we employed the least absolute shrinkage and selection operator (LASSO) regression as a methodology to identify the variables that can be used for quantitative prediction of the severity of OSA in children. The aim was to provide therapeutic assistance and develop tailored treatment programs for children with different levels of OSA.
Methods
Study Subjects
Children with adenoid hypertrophy and or tonsillar hypertrophy who attended the Department of Children’s Ear, Nose and Throat of Chongqing Medical University between June 2023 and September 2023 were included in this study. The inclusion criteria for the retrospective cases were as follows: (1) aged 4–18 years; (2) each child underwent portable PSG, fiberoptic electronic nasopharyngoscopy and lateral nasopharyngeal film, and was diagnosed as having enlarged tonsils or adenoids with varying degrees of OSA; and (3) provided comprehensive clinical information, such as basic information and questionnaires. The study excluded participants who met the following criteria: (1) children with hereditary disorders, neuromuscular disorders, or craniofacial anomalies; (2) children who had undergone previous tonsil or adenoid surgery; (3) children with other sleep disorders, such as insomnia;36 and (4) children who had experienced upper respiratory tract infections within the two weeks before hospital admission; (5) Suffering from mental illnesses such as autism, ADHD, etc.
Sleep Monitoring Method
The device utilized in this study is referred to as the “Sleep Breathing Preliminary Screen”, which is a type of PM. Machine model: ZG-S01D, voltage: 5V, product number: S01D2211000009; Batch number: 20221109; Production date: 20221114; The manufacturer is Hangzhou Zhaoguan Sensing Technology Co., LTD. This study included apnea hypopnea index (AHI) and lowest oxygen saturation (LSaO2), the two most specific indicators of OSA in children.37
Evaluation criteria:1 an AHI index of less than one, which denotes normal breathing during sleep. AHI > 10 is consistent with severe OSA; 1< AHI < 5 is consistent with a mild OSA diagnostic; and 5 < AHI < 10 is compatible with a moderate OSA diagnosis. Normal nocturnal ventilation is indicated by LSaO2>90%, while moderate hypoxemia is indicated by LSaO2<85%. Severe hypoxemia is indicated by an LSaO2<80%.
Predictor Variables
We identified 28 potential predictor variables for our study, selected based on existing literature and clinical expertise. These variables included demographic characteristics (age and gender) and clinical symptoms (snoring, obstructive mouth breathing, dysphagia, symptom duration, learning problems, and lack of concentration). Additionally, the study incorporated physical measurements, such as body mass index (BMI) and neck circumference. Clinical examination results, including upper airway level of obstruction, adenoid/nasopharyngeal (A/N) ratio, tonsil size and cephalometric analysis (including SNA, SNB, ANB, NP-FH, NA-PA, UI-LI, UI-SN, MP-SN, MP-FH, Y-axis angle and LI-MP, See Supplementary Figure 1) were also considered. Lastly, we used questionnaires, including obstructive sleep apnea 18 items survey (OSA-18) scores,38 protocol of orofacial myofunctional evaluation with scores (OMES),39 and Children’s Sleep Habits Questionnaire (CSHQ).40
Study Design
This study was carried out in compliance with the revised Declaration of Helsinki of 2015 and underwent review by the Ethical Review Committee of the Children’s Hospital of Chongqing Medical University (No. 66, 2023). All youngsters, even those eight years of age and older, had given their informed consent, as did their parents or legal guardians. PSG was conducted in the study to categorize participants into two groups according to the severity of their OSA: mild OSA (1 ≤ AHI ≤ 5 events /h) and moderate to severe OSA (AHI > 5 events /h). The clinical prediction model was then depicted using a nomogram.
Predictive Models
LASSO regression is used to compress the coefficients of some variables that are not important to the result to zero, and a finer model is obtained by constructing a penalty function. To construct and validate the nomogram and ensure the robustness of the prediction model, we divided the data into the training set and verification set using the SAMPLE function of R, with a 7:3 ratio. We randomly assigned 70% (n = 256) of children to the training cohort and 30% (n = 111) to the validation cohort. The former was used for developing models, while the latter was used for evaluating the predictive performance of the models. The model’s performance in predicting OSA was evaluated using various metrics, such as the receiver operating characteristic curve (ROC), calibration curve, decision curve analysis (DCA), and clinical impact curve (CIC).
The ROC is used to illustrate the overall performance of the model, and the area under the curve (AUC) is a measure of the model’s overall performance.41 The calibration curve is constructed by visualizing the results of the Hosmer-Lemeshow goodness-of-fit test to assess the agreement between the actual and predicted incidences.42,43 The DCA is a method used to evaluate the clinical value of a model by considering the potential range of patient risks and benefits, which estimates the net benefit at various risk thresholds to assess the feasibility of a clinical decision.44 The CIC was utilized to assess the clinical relevance of the risk prediction nomogram.45
Statistical Analysis
We analyzed the data using SPSS (Statistical Package for the Social Science 27.0 for Mac) and RV version 4.1.2. Perform the following operations in SPSS software: the Kolmogorov–Smirnov test was used to test the normality of the data; counting data between the two groups are compared using a chi-square test and shown as relative frequencies. The measurement information of a normal distribution is typically expressed as the mean (X) and standard deviation (SD), and t-test is commonly used to compare two groups. We employed the median and interquartile spacing M (P25, P75) to represent the skewed distribution of the data and the Mann–Whitney U-test for between-group comparisons. We use the glmnet package in the R for Logistic LASSO regression. The analysis screened the independent variables to identify risk factors. We assessed nomogram model performance by examining overall accuracy (Brier score),46 calibration (calibration plots and Hosmer–Lemeshow calibration test), and discrimination (AUC);47 we also plotted decision curves to assess the net benefit of nomogram -assisted decisions.
Results
Basic Characteristics of the Study Population
We randomly assigned 367 children to the training set (N = 256) and the validation set (N = 111). Table 1 presents the demographic and clinicopathologic data of the patients. Among children with OSA, 43.1% were diagnosed with moderate to severe OSA. BMI is classified according to percentage, there were 293 normal weight children (79.8%), 19 low body weight children (5.2%); 35 overweight children (9.5%), and 20 obese children (5.4%). Gender, BMI, cervical dimension, and snoring varied statistically significantly amongst children with varying severities in the training cohort. On the other hand, the validation group showed statistically significant variations in terms of Obstructive-mouth breathing (OMB), snoring, OSA-18 and incorrect swallowing. A further study found that mild OSA was the dominant condition in female children, and BMI, neck circumference, snoring, mouth breathing, and nasal congestion were higher in severe OSA children than in mild OSA children.
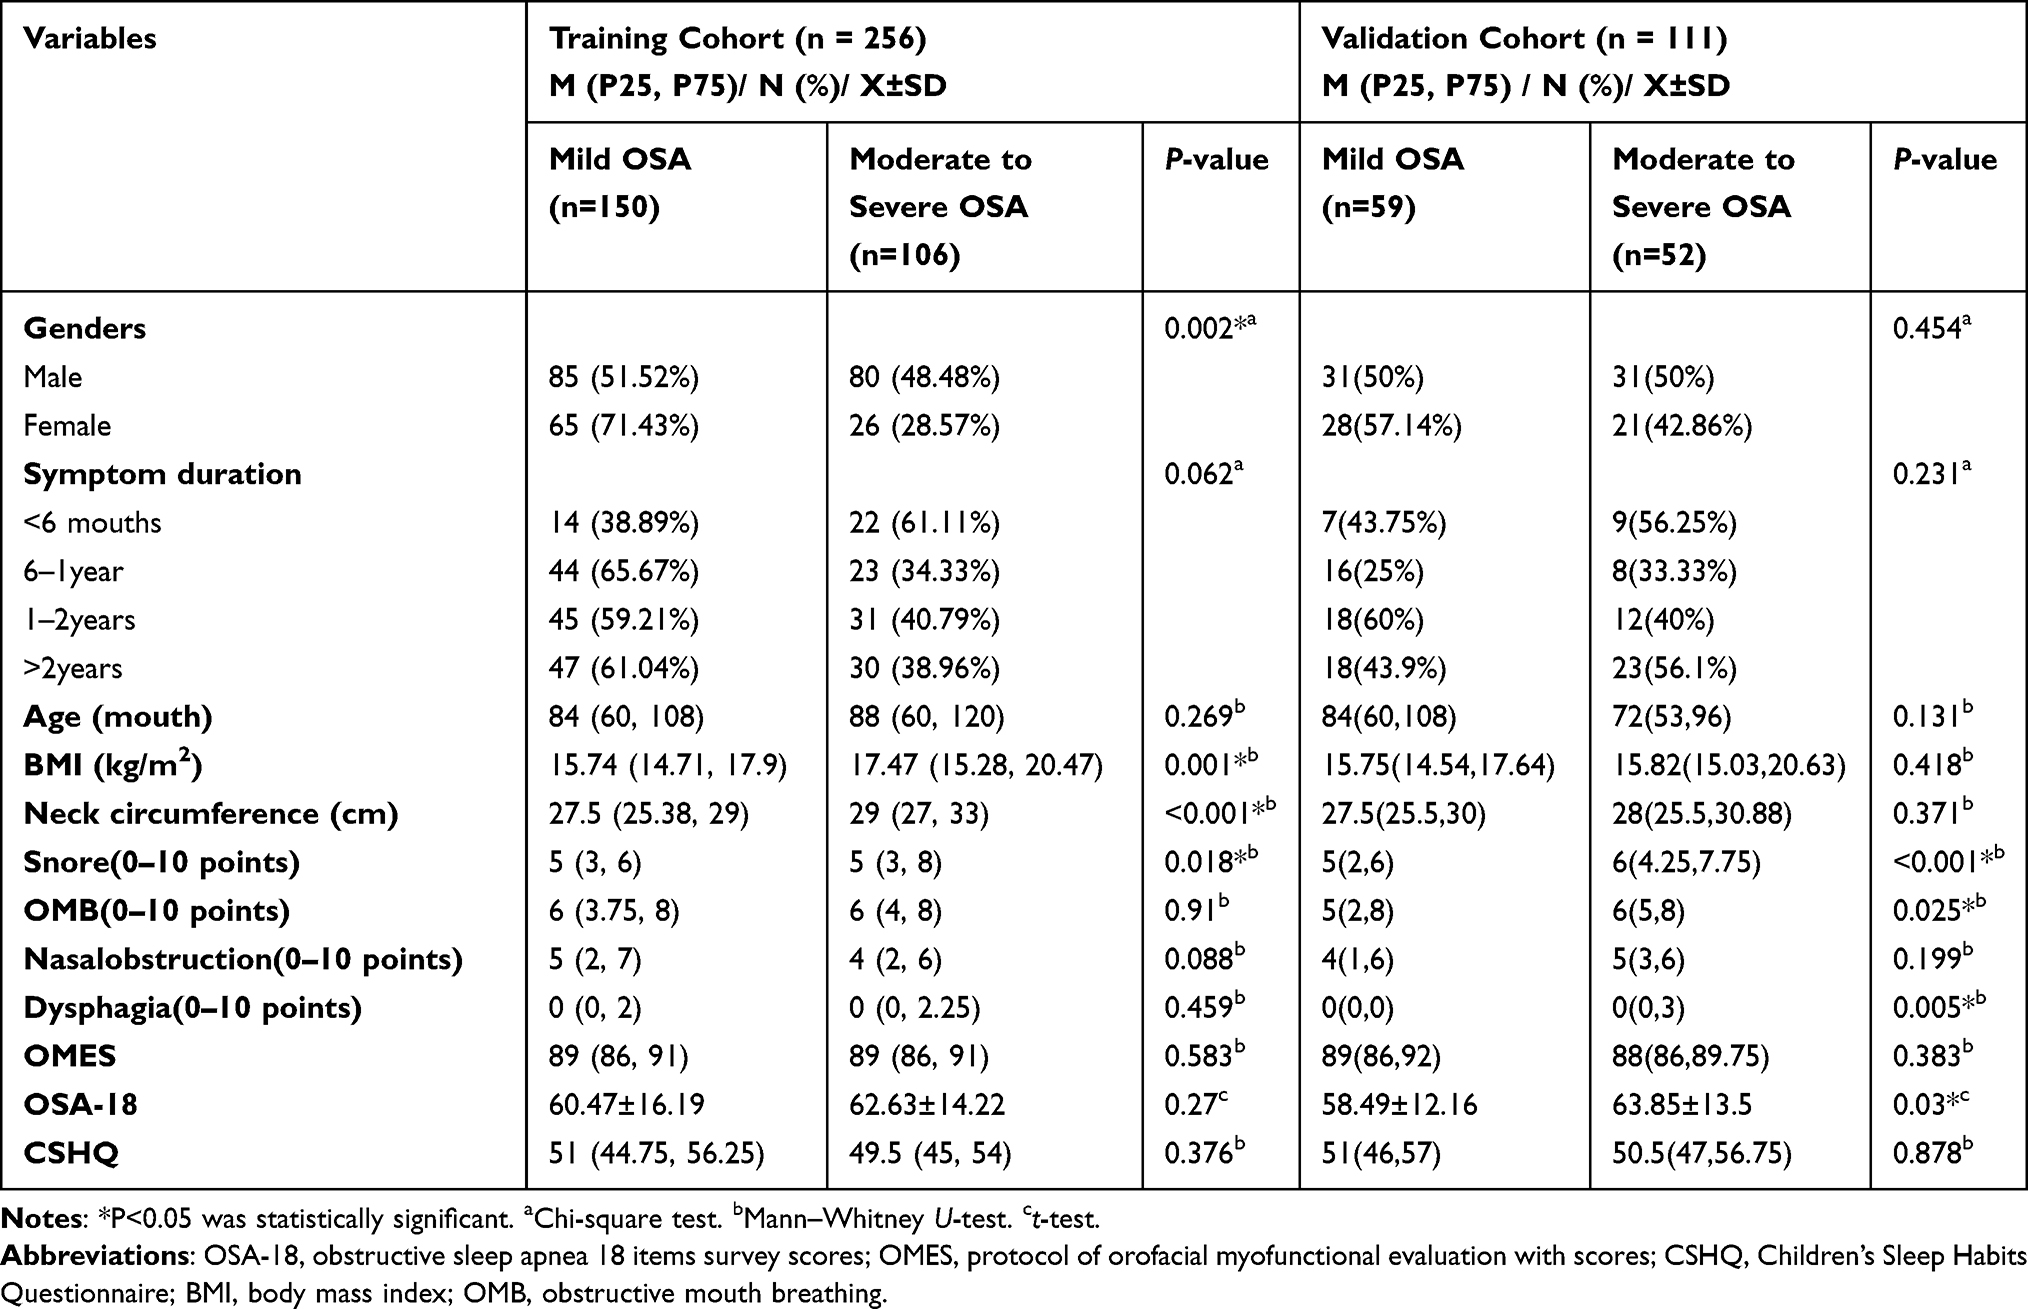 |
Table 1 Baseline Characteristics of All Patients in the Training Cohort and Validation Cohort |
Predictor Variable Screening Using LASSO Regression
The study measured the severity of OSA as the dependent variable by portable PSG, categorizing it as mild or moderate to severe. It was crucial to reduce the possibility of the model being overfitting because of the covariance and correlation between the 28 independent variables. Filtering and screening the independent variables allowed for the identification of characteristics related to moderate-severe OSA. Figure 1A illustrates the progressive compression of the original independent variable coefficients. Eventually, some of the coefficients were compressed to zero, hence avoiding overfitting of the model. The application of the ten-fold cross-validation technique, as shown in Figure 1B, demonstrates that the mean square error is lowest when the penalty value is set to 0.04, which is when the model performs ideally. The research revealed that neck circumference, ANB, gender, learning problem, and level of obstruction were the five most promising independent variables for predicting the severity of OSA.
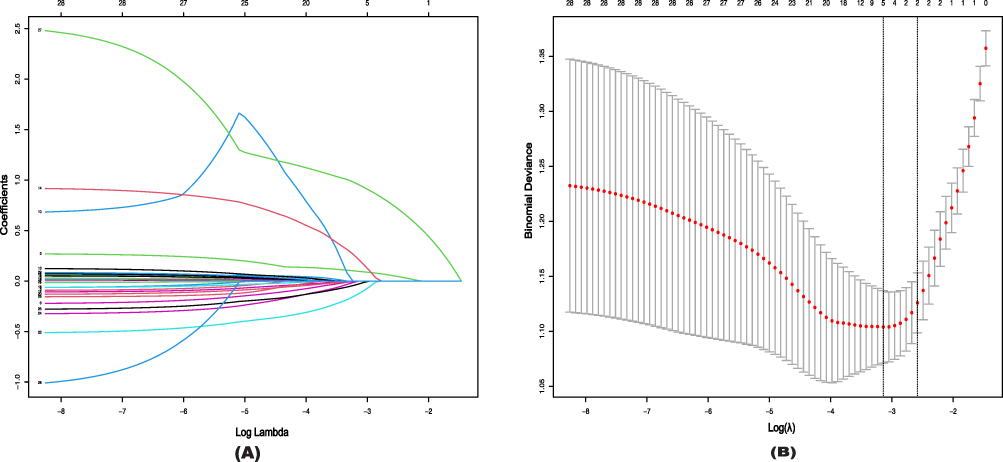 |
Figure 1 Texture feature selection using the least absolute shrinkage and selection operator (LASSO) binary logistic regression model. (A) LASSO coefficient profiles of the 28 texture features. 28 factors to the forecast model: age, BMI, neck circumference, snoring, OMB, nasal obstruction, dysphagia, OSA-18, CSHQ, A/N, OMES, SNA, SNB, ANB, NP-FH, NA-PA, UI-LI, UI-SN, MP-SN, MP-FH, LI-MP, Y-axis angle, gender, symptom duration, learning problems, lack of concentration, level of obstruction, and tonsil size. (B) The optimal parameter (lambda) is selected using 10-fold cross-validation with minimum criteria in the LASSO logistic regression. Each red dot represents a lambda (λ) value on the path, and confidence intervals for the error rate are indicated. In drawing the black vertical lines, we used the minimum criteria and the one standard error of the minimum criteria (1-SE) to determine the optimal values. 5 factors to the forecast model: Neck circumference, ANB, gender, learning problem, and level of obstruction. |
Construction and Interpretation of the Prediction Model
We used R software to integrate the five independent predictors mentioned earlier and built a prediction model for OSA severity, which was visualization with nomogram (refer to Figure 2). According to the nomogram model, the likelihood of moderate to severe OSA increases with each child’s overall score. For example, if a child is male, has a wide neck circumference and ANB, and is associated with learning problems and multiplane obstruction of the upper airway, their risk of moderate to severe OSA increases. For example, if a boy, corresponding to Points is 7.5; with both adenoid and tonsillar hypertrophy, corresponding to a score of 32.5; with a neck circumference of 32 cm, corresponding to a score of 25, and an ANB of 5.5, corresponding to a score of 32.5, and always accompanied by learning problems, corresponding to a score of 100, ie, a total score of 197.5, the risk of having moderate to severe OSA is up to 90%. A cumulative score of more than 156 indicated moderate to severe OSA. Moreover, the likelihood of moderate to severe OSA was shown to be 0.95 when the overall score reached 196.
 |
Figure 2 Nomogram for prediction of OSA. Abbreviations: OSA, obstructive sleep apnea; AH, Adenoid hypertrophy; TH, Tonsil hypertrophy; ATH, Adenotonsillar hypertrophy. |
Evaluation, Analysis, and Validation of the Prediction Model
The ability of nomogram prediction model to predict moderate to severe OSA was evaluated and validated using ROC. The five included metrics, as well as the overall metrics (Figure 3A and B). The model was internally validated with 500 Bootstrap self-sampling. In the training cohort, the predictive model had an AUC of 0.841 (95% Confidence interval: 0.794–0.888), which is greater than 0.750. The sensitivity was 0.802, specificity was 0.727, Positive Predictive Value (PPV) was 0.675, and Negative Predictive Value (NPV) was 0.838. The AUC of the predictive model in the validation cohort was 0.750 (95% CI: 0.659–0.842). The sensitivity was 0.731, specificity was 0.695, PPV was 0.679, and NPV was 0.745.
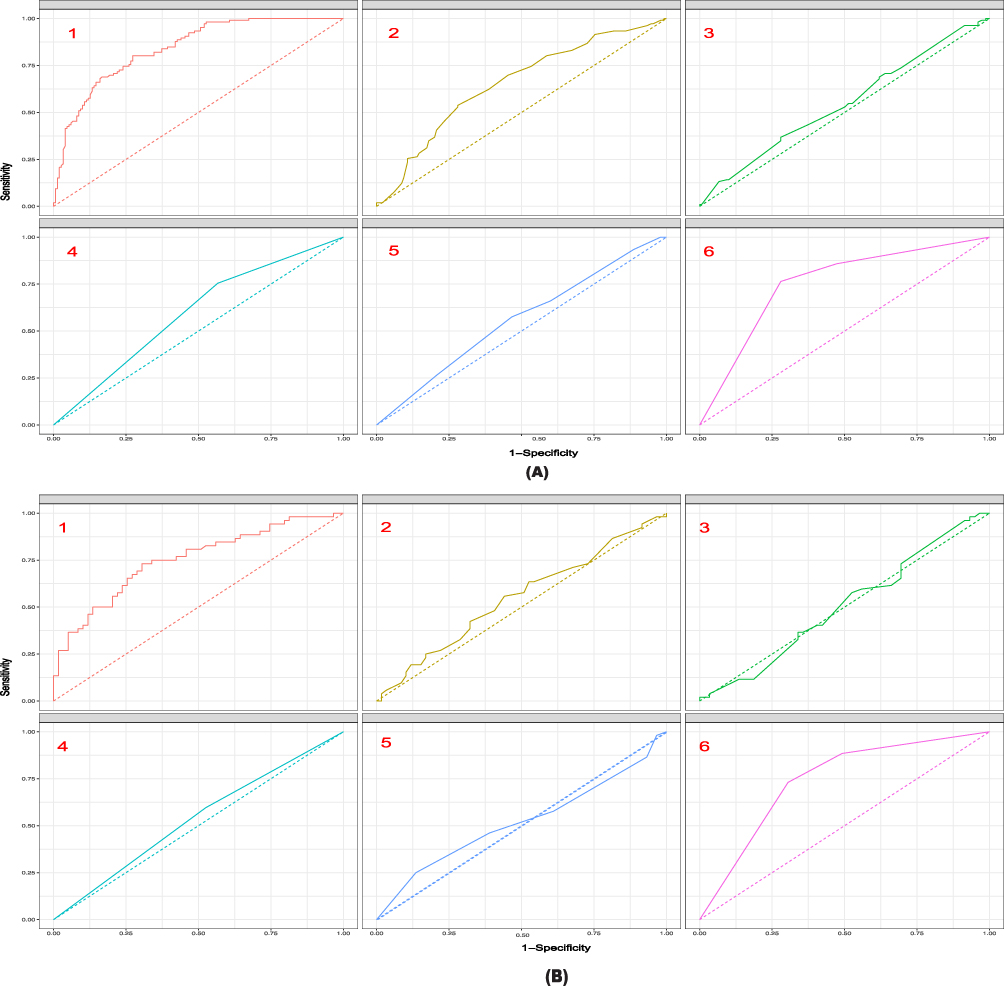 |
Figure 3 ROC curves for detecting OSA in children. (A) ROC curves for the five high-risk factors and overall in the training cohort. 1 represents the overall efficacy of the Nomogram model (Optimal Cutoff value:0.4; ACU: 0.841; Sens:80.2%; Spec:72.7%; PPV:67.5%; NPV:83.8%), 2 represents the predictive efficacy of the neck circumference (Optimal Cutoff value:28.6; ACU: 0.652), 3 represents the predictive efficacy of the ANB (Optimal Cutoff value:4.45; ACU: 0.547), 4 represents the predictive efficacy of the gender (Optimal Cutoff value:1; ACU: 0.594), 5 represents the predictive efficacy of the learning problem (Optimal Cutoff value:5; ACU: 0.558), and 6 represents the predictive efficacy of the level of obstruction (Optimal Cutoff value:3; ACU: 0.753). (B) ROC curves for the five high-risk factors and overall in the validation cohort. 1 (Optimal Cutoff value:0.38; ACU: 0.75; Sens:73.1%; Spec:69.5%; PPV:67.9%; NPV:74.5%), 2 (Optimal Cutoff value:28; ACU: 0.549), 3 (Optimal Cutoff value:4.3; ACU: 0.504), 4 (Optimal Cutoff value:1; ACU: 0.535), 5 (Optimal Cutoff value:6; ACU: 0.519), 6 (Optimal Cutoff value:3; ACU: 0.741). Optimal Cutoff value: A cut-point will be referred to as optimal when the point classifies most of the individuals correctly. Abbreviations: AUC, area under the ROC curve; PPV, Positive Predictive Value; NPV, Negative Predictive Value. |
The Calibration curve and the Hosmer–Lemeshow test showed a p-value of 0.875, which is greater than the significance level of 0.05, in the validation cohort. This indicates that the predicted probabilities obtained from the nomogram are highly consistent with the observed outcomes, as shown in Figure 4A. The accuracy of probabilistic predictions is measured using the Brier score, with a lower score indicating higher accuracy. In both the training and validation cohorts, the Brier scores were 0.162 and 0.207, respectively. The maximum difference in predicted and calibrated probabilities, known as Emax, and the average difference in predicted and calibrated probabilities, known as Eavg, were determined to be 0.029 and 0.011, respectively, in the training cohort. In the validation cohort, these values were 0.174 and 0.063, respectively. It is important to mention that smaller values indicate superior performance. The prediction model shows a high level of efficacy in making accurate predictions. The results are shown in Figure 4A and B.
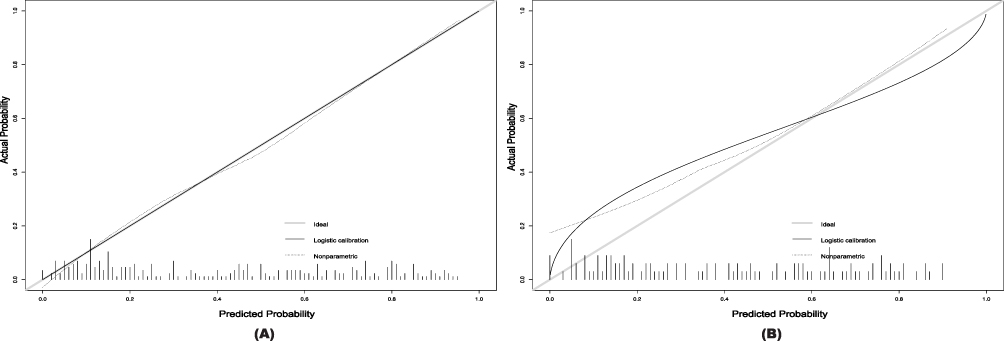 |
Figure 4 Calibration curve for predicting probability of OSA. (A) Training cohort. Parameter result: Dxy= 0.682; C (ROC) = 0.841; R2= 0.425; D= 0.375; U= −0.008; Q= 0.383; Brier= 0.162; Intercept= 0.000; Slope= 1.000; Emax= 0.029; E90= 0.022; Eavg= 0.011; S:z= 0.157; S:p= 0.875. (B) Validation cohort. Parameter result: Dxy= 0.501; C (ROC) = 0.750; R2= 0.127; D= 0.091; U= 0.051; Q= 0.040; Brier= 0.207; Intercept= 0.181; Slope= 0.596; Emax= 0.174; E90= 0.140; Eavg= 0.063; S:z= 2.016; S:p= 0.044. Thick gray line represents a perfect prediction by an ideal model. The Solid black line represents the performance of the nomogram, of which a closer fit to the diagonal dotted line represents a better prediction. |
The DCA has two reference lines, one reflecting the net benefit without any treatment and the other the net benefit for all patients receiving treatment. When the net benefit of the curve is higher than the two reference lines, it indicates that it has certain clinical application value. The results showed that for both the training group (Figure 5A) and the validation group (Figure 5B), with threshold probabilities ranging from 0.1 to 1.0, a greater net benefit could be obtained when making clinical decisions using this predictive model than “no treatment” or “all treatment”. The overall curve of the model exhibits a notable departure from the two extremes, suggesting a high level of predictive accuracy.
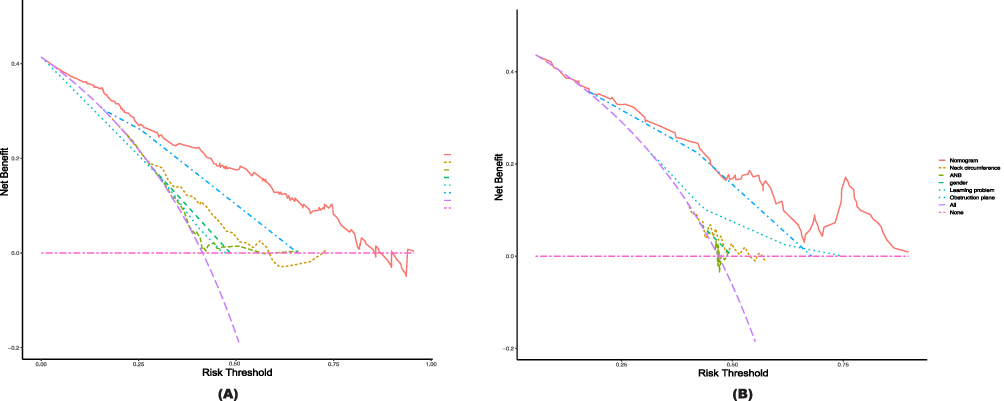 |
Figure 5 Decision curve analysis in prediction of OSA. (A) Training cohort. (B) Validation cohort. The y-axis demonstrates the net benefit. The red line indicates the nomogram. The yellow line indicates neck circumference. The green line represents ANB. The fluorescent green line indicates gender. The green dots represent learning problems. The blue dots represent the level of obstruction. The pink line indicates the assumption of no intervention. The intervention-all-patients assumption is represented by the purple line. |
The CIC demonstrated the clinical validity of the prediction model, as depicted in Figure 6A and B. When the threshold probability exceeded 90%, the prediction model concluded that the population identified as high risk for OSA exhibited a high degree of concordance with the actual OSA population. This indicates that the nomogram demonstrates a high overall net benefit across a wide and practical range of threshold probabilities, impacting patient outcomes. This suggests that the predictive model holds significant predictive value.
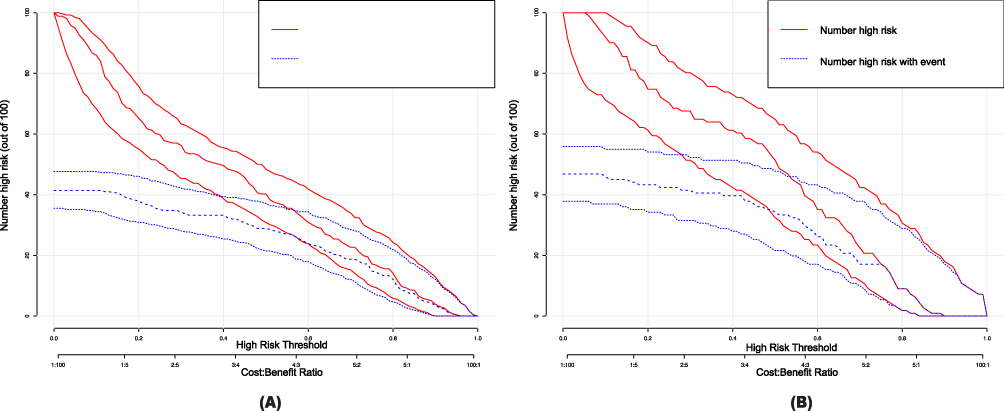 |
Figure 6 Clinical impact curve (CIC) of OSA model. (A) Training cohort. (B) Validation cohort. The red curve (number of high-risk individuals) indicates the number of people who are classified as positive (high risk) by the model at each threshold probability; the blue curve (number of high-risk individuals with outcome) is the number of true positives at each threshold probability. CIC visually indicated that nomogram conferred high clinical net benefit and confirmed the clinical value of the OSA model. |
Discussion
Pediatric OSA has received increasing scientific attention in recent decades, differing from adults in physiology, clinical presentation, polysomnographic features, and outcomes, with adenoidal tonsillar hypertrophy being the main cause, and its high prevalence coinciding with the onset of OSA symptoms.48 The high prevalence of OSA,16 suboptimal diagnosis rate,49 and potential cardiovascular, neurocognitive, and behavioral diseases16 have driven a great deal of research work in two main directions, one is the search for effective treatments, and the second is to achieve a simplified, objective and low-cost diagnostic method.49 Children diagnosed with OSA commonly have their treatment plan determined by the severity of their condition and the expertise of their healthcare providers.23 A rising proportion of individuals displaying symptoms of OSA are experiencing delays in receiving a timely diagnosis and appropriate treatment. This issue arises due to the limitations of current diagnostic methods for OSA, which in turn pose a significant threat to the physical and mental well-being of affected patients.12 If a CPM for OSA of varying severity can be established using general data, clinical tests, and scales, and if children with positive predictions can receive sleep monitoring to assist in the diagnostic process,24 then diagnostic effectiveness will be improved.
CPM have the potential to offer physicians and patients quantified risk assessments based on their present health condition, as well as predict their future health status. These models use noninvasive, cost-effective, and easily obtainable metrics.50 In recent years, there has been a growing interest in Portable PSG, which can be done at home and often uses fewer sensors than PSG (see AASM Scoring Manual for Technical and Digital Specifications).51 Use of Portable PSG may provide potential benefits to patients with suspected OSA. Such benefits could include convenience, comfort, increased access to testing, and decreased cost.52 Most existing studies on predicting OSA using machine learning methods have focused on the adult population and have shown promising results in predicting OSA in both adults and children. In recent years, machine learning has been used to identify OSA patients based on 2D53 and 3D54 photos. This demonstrates a link between maxillofacial geometry and the risk of sleep apnea, creating models to predict the most important facial features of AHI, and showing the importance of the neck and jaw region.54 Adult-based OSA diagnostic models can predict OSA by considering only simple and readily available predictors, such as BMI, age, sex, or neck circumference, and achieving a high level of sensitivity or specificity.12 The child-centered machine learning model demonstrates good diagnostic performance for moderate to severe OSA, and these children greatly benefit from early diagnosis and access to treatment.55 Several non-invasive techniques have been developed to diagnose OSA, which provide a certain level of predictability in identifying the condition or its effects.23 However, the prediction model of OSA severity established by oximeter has great variation and is not enough to diagnose OSA.11 The predictive model based on age, weight, height, gender, BMI, Children’s Sleep Questionnaire (PSQ) score, tonsil size, and Oxygen desaturation index (ODI) had good predictive power (AUC: 0.897).23 Several craniofacial skeletal variables (eg, SNB angle, branchial height, lower angular angle, and hyoid position) and upper airway morphology56 are also associated with the severity of OSA and can be used to help identify children at higher risk for OSA.57 He’s photogrammetry-based prediction model was able to identify individuals with and without OSA and had better predictive performance than the general physical examination model.34 However, Fernandes found that facial stereophotogrammetry had low screening power.58 Cheung also found that visual assessments based on front and side photographs were poor at predicting OSA.59 Yuen found significant differences in the maxillary-mandibular relationship angle and the ratio of mandibular height to the entire length of the face in prepubertal children as the severity of OSA increased.33 The model established by Masoud through three-dimensional airway analysis shows remarkable predictive value.60 In summary, the use of craniofacial anthropometry and photogrammetry to assess facial features has been proposed as an alternative technique for OSA in both adults and children, and very low to moderate quality levels of data, have not been able to support the existence of an association, or lack thereof, between craniofacial morphology and pediatric OSA.58
Most clinical signs and symptoms have limited usefulness in screening and predicting OSA, and no single parameter is enough to achieve this goal. Parameters such as age, gender, BMI, and OSA-18 have all been associated with the severity of OSA. The usefulness of these measures as screening assays, however, is still up for discussion. In recent years, there has been a growing emphasis on using a combination of objective and subjective indicators to better identify patients who are at risk for OSA. In an appropriate patient population, and through a rigorous management pathway, the use of portable PSG to diagnose OSA has been shown to provide adequate clinical outcomes.61 Given the impact of craniofacial features on upper airway collapse during sleep, it is necessary to create predictive models that incorporate craniofacial features and clinical symptoms to evaluate their effectiveness in predicting the severity of the disease. In this study, a total of 28 factors that could potentially impact the severity of the disease were included in the LOSSA regression analysis. In the end, only five variables were used to build the nomogram, including neck circumference, ANB, gender, learning problems, and level of obstruction. The AUC values of the nomogram were greater than 0.75 for both the training and validation cohorts, indicating that the model had a high degree of differentiation. The calibration plots and Hosmer-Lemeshow tests showed a strong agreement between the predicted probabilities of the nomogram and the observed outcomes. Moreover, to assess the clinical validity of the nomogram, we employed the threshold probability-based clinical outcomes provided by the DCA. This approach enabled us to determine a more accurate net clinical benefit. Additionally, the CIC provided intuitive evidence that high-risk populations in real OSA were closely aligned, within a specific range, with severely high-risk populations in OSA. Contrary to previous research, this study found that neck circumference could predict disease severity, and its substance was associated with high BMI.62 The results of this study are in concordance with Howard’s study, which found that the upper airway level of obstruction is correlated with the severity of OSA.63 Other studies indicate that tonsil/adenoid size does not predict OSA severity based on AHI; however, adenoid size may be related to LSaO2.10 We point out the importance of learning problems in assessing the severity of OSA in children, and the results of this model can be used to guide the risk of neurocognitive impairment in children with severe OSA and determine its efficacy through early intervention.64 Men have a higher risk of severe OSA, which may be related to male physiological structure and function. The ANB parameter, which reflects the relationship between the anteroposterior and anteroposterior relative positions of the maxilla and mandible, can also predict the degree of severity to a certain extent, indicating that we can roughly determine the impact and severity of OSA on the maxillofacial region through facial appearance. Most studies indicated that the ability of the questionnaire to screen OSA was low,65,66 but higher than that of videotape with OSA characteristics67. It was discovered in this study that neither the CSHQ nor the OSA-1868 could predict the severity of OSA. According to certain research, identifying and removing duplicate questions from the questionnaire might enhance its prediction performance and increase its prediction efficiency.68–71 Low-quality studies have indicated that clinical symptoms can predict OSA severity,72 and although this study included some clinical symptoms, such as snoring and OMB, no association was found. It is positive that OSA-related behavior and quality of life in children can predict improvement after adenotonsillectomy to some extent, and symptoms obtained during the visit can provide auxiliary advice on important comorbidities and possible surgical responses.73
Our research stands out for its originality and advantages. Our study utilized the primary and objective clinical data to create the first model capable of predicting OSA severity in children. Among the many risk factors taken into consideration, one of the main conclusions is that learning difficulties in kids with OSA can operate as a risk rating indicator, which highlights how crucial it is to evaluate the illness’s significance from a variety of angles. We have also integrated several problems related to OSA and added cephalometric data as a new predictor in risk rating, and These results set our study apart from earlier clinical rating schemes. Compared with the literature of the same type, this study has better prediction performance71 and more comprehensive verification.23
Limitations
This study is subject to certain limitations. First of all, there was only one hospital used for data gathering in this study, and the sample size and coverage were limited. Furthermore, the raw data set is the only one used for training and validation, with no external validation set obtained. Notably, the demographic sample that was used in this investigation was limited to people who were Chinese in origin. For this reason, further research is needed to evaluate whether the model’s conclusions apply to other ethnic groups. Current research on OSA prediction usually uses data from questionnaires and clinical exams. Nonetheless, the quality of data collecting standards affects how reliable the existing prediction models are. In addition, the portable PSG cannot distinguish between sleep and wake cycles, nor can it report the number of apnea and hypopnea times per hour recorded time (as opposed to sleep time), and its ability to distinguish severity also needs to be compared with a professional polysomnography monitor.
Conclusion
The present study has developed a prediction model comprising five variables, namely Neck circumference, ANB, gender, Learning problem, and level of obstruction. This model demonstrates a strong predictive capacity for moderate-to-severe OSA in children. Consequently, it can serve as a valuable tool for clinicians in distinguishing between different severity levels of OSA in children and aiding in clinical decision-making. This model can help physicians diagnose OSA more quickly and reduce the medical expenses for patients compared to PSG monitoring. Further research and validation of the model are necessary before considering practical clinical applications. The application of machine learning and data mining has the potential to improve disease prediction and revolutionize medical decision-making. A more thorough understanding of the screening and diagnosis of OSA in children will only be possible with well-designed, large-scale, controlled, blinded, multicenter prospective studies. Furthermore, more study is required, especially on portable monitoring in kids of different ages.
Abbreviations
OSA, Obstructive sleep apnea; CPM, Clinical predictive models; DCA, Decision Curve Analysis; ROC, Receiver operating characteristic curve; CIC, Clinical impact curve; AUC, Area Under Curve; LASSO, Least Absolute Selection and Shrinkage Operator; OMES, Protocol of orofacial myofunctional evaluation with scores; OSA-18, Obstructive sleep apnea 18 items survey scores; CSHQ, Children’s Sleep Habits Questionnaire; BMI, Body mass index; OMB, Obstructive mouth breathing; ANB, the angle between 3 point landmarks, A point, N and B point, determining the anteroposterior relation between maxilla and the mandible relative to the cranium; PM, Portable monitors.
Data Sharing Statement
The datasets used and/or analyzed during the current study are available from the corresponding author on reasonable request.
Ethics Approval and Informed Consent
The studies involving human participants were reviewed and approved by the Ethics Committee of Children’s Hospital of Chongqing Medical University (No. 66, 2023). China Clinical Trial Registration Center registration number: ChiCTR2300068094. The study was conducted with the informed consent was obtained from all subjects and/or their legal guardian(s) before the investigation, and the study will not cause any harm to the child or his family. Personal information of the children will be kept strictly confidential unless required by law. All data from this study were published with the consent of the participants.
Author Contributions
All authors made a significant contribution to the work reported, whether that is in the conception, study design, execution, acquisition of data, analysis and interpretation, or in all these areas; took part in drafting, revising or critically reviewing the article; gave final approval of the version to be published; have agreed on the journal to which the article has been submitted; and agree to be accountable for all aspects of the work.
Funding
There is no funding to report.
Disclosure
The authors declare that the research was conducted in the absence of any commercial or financial relationships that could be construed as a potential conflict of interest.
References
1. Ni X. Guidelines for the diagnosis and treatment of obstructive sleep apnea in Chinese children. Chin J Evid Based Med. 2020;20(8):883–900.
2. Li Z, Celestin J, Lockey RF. Pediatric sleep apnea syndrome: an update. J Allergy Clin Immunol Pract. 2016;4(5):852–861. doi:10.1016/j.jaip.2016.02.022
3. Fernandez-Mendoza J, He F, Calhoun SL, Vgontzas AN, Liao D, Bixler EO. Association of pediatric obstructive sleep apnea with elevated blood pressure and orthostatic hypertension in adolescence. JAMA Cardiol. 2021;6(10):1144–1151. doi:10.1001/jamacardio.2021.2003
4. Lamberg L. Sleep-disordered breathing may spur behavioral, learning problems in children. JAMA. 2007;297(24):2681. doi:10.1001/jama.297.24.2681
5. Hannon TS, Rofey DL, Ryan CM, Clapper DA, Chakravorty S, Arslanian SA. Relationships among obstructive sleep apnea, anthropometric measures, and neurocognitive functioning in adolescents with severe obesity. J Pediatr. 2012;160(5):732–735. doi:10.1016/j.jpeds.2011.10.029
6. Li AM, Au CT, Ng C, Lam HS, Ho CKW, Wing YK. A 4-year prospective follow-up study of childhood OSA and its association with BP. Chest. 2014;145(6):1255–1263. doi:10.1378/chest.13-1333
7. Hinkle J, Connolly HV, Adams HR, Lande MB. Severe obstructive sleep apnea in children with elevated blood pressure. J Am Soc Hypertens. 2018;12(3):204–210. doi:10.1016/j.jash.2017.12.010
8. Hunter SJ, Gozal D, Smith DL, Philby MF, Kaylegian J, Kheirandish-Gozal L. Effect of sleep-disordered breathing severity on cognitive performance measures in a large community cohort of young school-aged children. Am J Respir Crit Care Med. 2016;194(6):739–747. doi:10.1164/rccm.201510-2099OC
9. Varlami V, Malakasioti G, Alexopoulos EI, et al. Low-grade albuminuria in children with obstructive sleep apnea. J Sleep Res. 2013;22(3):289–294. doi:10.1111/jsr.12021
10. Hwang SH, Guilleminault C, Park CS, Kim TW, Hong SC. Usefulness of adenotonsillar size for prediction of severity of obstructive sleep apnea and flow limitation. Otolaryngol Head Neck Surg. 2013;149(2):326–334. doi:10.1177/0194599813490892
11. Kang KT, Weng WC, Lee CH, Hsiao TY, Lee PL, Hsu WC. Clinical risk assessment model for pediatric obstructive sleep apnea. Laryngoscope. 2016;126(10):2403–2409. doi:10.1002/lary.25912
12. Ferreira-Santos D, Amorim P, Silva Martins T, Monteiro-Soares M, Pereira Rodrigues P. Enabling early obstructive sleep apnea diagnosis with machine learning: systematic review. J Med Internet Res. 2022;24(9):e39452. doi:10.2196/39452
13. Yuen HM, Au CT, Chu WCW, Li AM, Chan KCC. Reduced tongue mobility: an unrecognized risk factor of childhood obstructive sleep apnea. Sleep. 2022;45(1):zsab217. doi:10.1093/sleep/zsab217
14. Markkanen S, Rautiainen M, Niemi P, Helminen M, Peltomäki T. Is securing normal dentofacial development an indication for tonsil surgery in children? A systematic review and meta-analysis. Int J Pediatr Otorhinolaryngol. 2020;133:110006. doi:10.1016/j.ijporl.2020.110006
15. Collop NA, Tracy SL, Kapur V, et al. Obstructive sleep apnea devices for out-of-center (OOC) testing: technology evaluation. J Clin Sleep Med. 2011;7(5):531–548. doi:10.5664/JCSM.1328
16. Marcus CL, Brooks LJ, Ward SD, et al. Diagnosis and management of childhood obstructive sleep apnea syndrome. Pediatrics. 2012;130(3):e714–e755. doi:10.1542/peds.2012-1672
17. Shah P, Gurubhagavatula I. Portable monitoring: practical aspects and case examples. Sleep Med Clin. 2011;6(3):355–366. doi:10.1016/j.jsmc.2011.05.007
18. Garg N, Rolle AJ, Lee TA, Prasad B. Home-based diagnosis of obstructive sleep apnea in an urban population. J Clin Sleep Med. 2014;10(8):879–885. doi:10.5664/jcsm.3960
19. Griffiths A, Mukushi A, Adams AM. Telehealth-supported level 2 pediatric home polysomnography. J Clin Sleep Med. 2022;18(7):1815–1821. doi:10.5664/jcsm.9982
20. Shayeb ME, Topfer LA, Stafinski T, Pawluk L, Menon D. Diagnostic accuracy of level 3 portable sleep tests versus level 1 polysomnography for sleep-disordered breathing: a systematic review and meta-analysis. CMAJ. 2014;186(1):E25–E51. doi:10.1503/cmaj.130952
21. Gao X, Li Y, Xu W, Han D. Diagnostic accuracy of level IV portable sleep monitors versus polysomnography for pediatric obstructive sleep apnea: a systematic review and meta-analysis. Sleep Med. 2021;87:127–137. doi:10.1016/j.sleep.2021.08.029
22. Gu HQ, Zhou ZR, Zhang ZH, Zhou Q. Clinical prediction modeling: basic concepts, application scenarios and research ideas. Chin J Evid Based Cardiovasc Med. 2018;10(12):1454–1456+1462.
23. Certal V, Silva H, Carvalho C, et al. Model for prediction of pediatric OSA: proposal for a clinical decision rule. Laryngoscope. 2015;125(12):2823–2827. doi:10.1002/lary.25438
24. Wu YX, Tang YF, Zheng L, Xu ZF. Clinical prediction modeling of children with severe obstructive sleep apnea. Chin J Pract Pediatr. 2022;37(9):701–707. doi:10.19538/j.ek2022090611
25. Si R Magnetic Resonance Imaging-Based Prediction of Obstructive Sleep Apnea in Children. Master. Beijing Jiaotong University; 2022.
26. Molnár V, Lakner Z, Molnár A, et al. Ultrasound and magnetic resonance imaging of the tongue in obstructive sleep apnoea. Appl Sci. 2022;12(19):9583. doi:10.3390/app12199583
27. Molnár V, Lakner Z, Molnár A, et al. The predictive role of the upper-airway adipose tissue in the pathogenesis of obstructive sleep apnoea. Life. 2022;12(10):1543. doi:10.3390/life12101543
28. Patel AP, Meghji S, Phillips JS. Accuracy of clinical scoring tools for the diagnosis of pediatric obstructive sleep apnea. Laryngoscope. 2020;130(4):1034–1043. doi:10.1002/lary.28146
29. Wang X, Lu J, Song Z, Zhou Y, Liu T, Zhang D. From past to future: bibliometric analysis of global research productivity on nomogram (2000–2021). Front Public Health. 2022;10:997713. doi:10.3389/fpubh.2022.997713
30. Santaolalla Montoya F, Iriondo Bedialauneta JR, Aguirre Larracoechea U, Martinez Ibargüen A, Sanchez Del Rey A, Sanchez Fernandez JM. The predictive value of clinical and epidemiological parameters in the identification of patients with obstructive sleep apnoea (OSA): a clinical prediction algorithm in the evaluation of OSA. Eur Arch Otorhinolaryngol. 2007;264(6):637–643. doi:10.1007/s00405-006-0241-5
31. Wang SH, Keenan BT, Wiemken A, et al. Effect of weight loss on upper airway anatomy and the apnea–hypopnea index. The importance of tongue fat. Am J Respir Crit Care Med. 2020;201(6):718–727. doi:10.1164/rccm.201903-0692OC
32. Kim DK, Rhee CS, Yun PY, Kim JW. Adenotonsillar hypertrophy as a risk factor of dentofacial abnormality in Korean children. Eur Arch Otorhinolaryngol. 2015;272(11):3311–3316. doi:10.1007/s00405-014-3407-6
33. Yuen HM, Chan KCC, Chu WCW, et al. Craniofacial phenotyping by photogrammetry in Chinese prepubertal children with obstructive sleep apnea. Sleep. 2023;46(3):zsac289. doi:10.1093/sleep/zsac289
34. He S, Li Y, Xu W, et al. The predictive value of photogrammetry for obstructive sleep apnea. J Clin Sleep Med. 2021;17(2):193–202. doi:10.5664/jcsm.8836
35. Yan X, Wang L, Liang C, et al. Development and assessment of a risk prediction model for moderate-to-severe obstructive sleep apnea. Front Neurosci. 2022;16:936946. doi:10.3389/fnins.2022.936946
36. Sateia MJ. International classification of sleep disorders-third edition. Chest. 2014;146(5):1387–1394. doi:10.1378/chest.14-0970
37. Wei FH Correlation study of PSG testing with Epworth scale and OSA-18 scale in adult and pediatric OSAHS patients. Master. Guangxi Medical University; 2018. Available from: https://kns.cnki.net/kcms2/article/abstract?v=3uoqIhG8C475KOm_zrgu4lQARvep2SAkWfZcByc-RON98J6vxPv10UKrmgDz2GxQcO1KhxwUektZ8LFwAykjGztcIPfxG-ya&uniplatform=NZKPT.
38. Franco RA, Rosenfeld RM, Rao M. Quality of life for children with obstructive sleep apnea. Otolaryngol Head Neck Surg. 2000;123(1):9–16. doi:10.1067/mhn.2000.105254
39. de Felício CM, Ferreira CLP. Protocol of orofacial myofunctional evaluation with scores. Int J Pediatr Otorhinolaryngol. 2008;72(3):367–375. doi:10.1016/j.ijporl.2007.11.012
40. Owens JA, Spirito A, McGuinn M. The Children’s Sleep Habits Questionnaire (CSHQ): psychometric properties of a survey instrument for school-aged children. Sleep. 2000;23(8):1043–1051. doi:10.1093/sleep/23.8.1d
41. Muschelli J. ROC and AUC with a binary predictor: a potentially misleading metric. J Classif. 2020;37(3):696–708. doi:10.1007/s00357-019-09345-1
42. Van Calster B, McLernon DJ, van Smeden M, Wynants L, Steyerberg EW. Calibration: the Achilles heel of predictive analytics. BMC Med. 2019;17(1):230. doi:10.1186/s12916-019-1466-7
43. Van Calster B, Nieboer D, Vergouwe Y, De Cock B, Pencina MJ, Steyerberg EW. A calibration hierarchy for risk models was defined: from utopia to empirical data. J Clin Epidemiol. 2016;74:167–176. doi:10.1016/j.jclinepi.2015.12.005
44. Vickers AJ, Holland F. Decision curve analysis to evaluate the clinical benefit of prediction models. Spine J. 2021;21(10):1643–1648. doi:10.1016/j.spinee.2021.02.024
45. Hou N, Li M, He L, et al. Predicting 30-days mortality for MIMIC-III patients with sepsis-3: a machine learning approach using XGboost. J Transl Med. 2020;18(1):462. doi:10.1186/s12967-020-02620-5
46. Brier GW. Verification of forecasts expressed in terms of probability. Mon Weather Rev. 1950;78(1):1–3. doi:10.1175/1520-0493(1950)078<0001:VOFEIT>2.0.CO;2
47. Núñez E, Steyerberg EW, Núñez J. Regression modeling strategies. Rev Esp Cardiol. 2011;64(6):501–507. doi:10.1016/j.recesp.2011.01.019
48. Lin SY, Su YX, Wu YC, Chang JZC, Tu YK. Management of paediatric obstructive sleep apnoea: a systematic review and network meta-analysis. Int J Paediatr Dent. 2020;30(2):156–170. doi:10.1111/ipd.12593
49. Kheirandish-Gozal L. What is “abnormal” in pediatric sleep? Respir Care. 2010;55(10):1366–1374; discussion 1374–1376.
50. Behar J, Roebuck A, Domingos JS, Gederi E, Clifford GD. A review of current sleep screening applications for smartphones. Physiol Meas. 2013;34(7):R29–46. doi:10.1088/0967-3334/34/7/R29
51. Kapur VK, Auckley DH, Chowdhuri S, et al. Clinical practice guideline for diagnostic testing for adult obstructive sleep apnea: an American Academy of Sleep Medicine Clinical Practice Guideline. J Clin Sleep Med. 2017;13(03):479–504. doi:10.5664/jcsm.6506
52. Bertoni D, Isaiah A. Towards patient-centered diagnosis of pediatric obstructive sleep apnea-a review of biomedical engineering strategies. Expert Rev Med Devices. 2019;16(7):617–629. doi:10.1080/17434440.2019.1626233
53. Tsuiki S, Nagaoka T, Fukuda T, et al. Machine learning for image-based detection of patients with obstructive sleep apnea: an exploratory study. Sleep Breath. 2021;25(4):2297–2305. doi:10.1007/s11325-021-02301-7
54. Hanif U, Leary E, Schneider L, et al. Estimation of apnea-hypopnea index using deep learning on 3-D craniofacial scans. IEEE J Biomed Health Inform. 2021;25(11):4185–4194. doi:10.1109/JBHI.2021.3078127
55. Gutiérrez-Tobal GC, Álvarez D, Kheirandish-Gozal L, Del Campo F, Gozal D, Hornero R. Reliability of machine learning to diagnose pediatric obstructive sleep apnea: systematic review and meta-analysis. Pediatr Pulmonol. 2022;57(8):1931–1943. doi:10.1002/ppul.25423
56. Slaats MA, Van Hoorenbeeck K, Van Eyck A, et al. Upper airway imaging in pediatric obstructive sleep apnea syndrome. Sleep Med Rev. 2015;21:59–71. doi:10.1016/j.smrv.2014.08.001
57. Vos WG, De Backer WA, Verhulst SL. Correlation between the severity of sleep apnea and upper airway morphology in pediatric and adult patients. Curr Opin Allergy Clin Immunol. 2010;10(1):26–33. doi:10.1097/ACI.0b013e328334f659
58. Fagundes NCF, Gianoni-Capenakas S, Heo G, Flores-Mir C. Craniofacial features in children with obstructive sleep apnea: a systematic review and meta-analysis. J Clin Sleep Med. 2022;18(7):1865–1875. doi:10.5664/jcsm.9904
59. Cheung K, Ishman SL, Benke JR, et al. Prediction of obstructive sleep apnea using visual photographic analysis. J Clin Anesth. 2016;32:40–46. doi:10.1016/j.jclinane.2015.12.020
60. Masoud AI, Alwadei AH, Gowharji LF, Park CG, Carley DW. Relating three-dimensional airway measurements to the apnea-hypopnea index in pediatric sleep apnea patients. Orthod Craniofac Res. 2021;24(1):137–146. doi:10.1111/ocr.12417
61. Kirk V, Baughn J, D’Andrea L, et al. American Academy of Sleep Medicine position paper for the use of a home sleep apnea test for the diagnosis of OSA in children. J Clin Sleep Med. 2017;13(10):1199–1203. doi:10.5664/jcsm.6772
62. Spilsbury JC, Storfer-Isser A, Rosen CL, Redline S. Remission and incidence of obstructive sleep apnea from middle childhood to late adolescence. Sleep. 2015;38(1):23–29. doi:10.5665/sleep.4318
63. Howard NS, Brietzke SE. Pediatric tonsil size: objective vs subjective measurements correlated to overnight polysomnogram. Otolaryngol Head Neck Surg. 2009;140(5):675–681. doi:10.1016/j.otohns.2009.01.008
64. Brockmann PE, Schlaud M, Poets CF, Urschitz MS. Predicting poor school performance in children suspected for sleep-disordered breathing. Sleep Med. 2015;16(9):1077–1083. doi:10.1016/j.sleep.2015.03.021
65. Spruyt K, Gozal D. Pediatric sleep questionnaires as diagnostic or epidemiological tools: a review of currently available instruments. Sleep Med Rev. 2011;15(1):19–32. doi:10.1016/j.smrv.2010.07.005
66. Bseikri M, Zhang J, Kirley J, Lee C, Castillo A, Feliciano EMC. Predicting obstructive sleep apnea severity in children referred for polysomnography: use of the pediatric sleep questionnaire and subscales. Sleep Breath. 2023;27(2):545–552. doi:10.1007/s11325-022-02647-6
67. wai CK, Ng DK, li KK, et al. Application of videotape in the screening of obstructive sleep apnea in children. Sleep Med. 2008;9(4):442–445. doi:10.1016/j.sleep.2007.06.011
68. Walter LM, Biggs SN, Cikor N, et al. The efficacy of the OSA-18 as a waiting list triage tool for OSA in children. Sleep Breath. 2016;20(2):837–844. doi:10.1007/s11325-015-1289-5
69. Isaiah A, Shikara M, Pereira KD, Das G. Refining screening questionnaires for prediction of sleep apnea severity in children. Sleep Breath. 2020;24(4):1349–1356. doi:10.1007/s11325-019-01964-7
70. Kennedy CL, Onwumbiko BE, Blake J, Pereira KD, Isaiah A. Prospective validation of a brief questionnaire for predicting the severity of pediatric obstructive sleep apnea. Int J Pediatr Otorhinolaryngol. 2022;153:111018. doi:10.1016/j.ijporl.2021.111018
71. Raman VT, Splaingard M, Tumin D, Rice J, Jatana KR, Tobias JD. Utility of screening questionnaire, obesity, neck circumference, and sleep polysomnography to predict sleep-disordered breathing in children and adolescents. Paediatr Anaesth. 2016;26(6):655–664. doi:10.1111/pan.12911
72. Lewis KC, Schroeder JW, Ayub B, Bhushan B. Clinical symptoms that predict the presence of obstructive sleep apnea. Int J Pediatr Otorhinolaryngol. 2017;95:139–144. doi:10.1016/j.ijporl.2017.02.018
73. Rosen CL, Wang R, Taylor HG, et al. Utility of symptoms to predict treatment outcomes in obstructive sleep apnea syndrome. Pediatrics. 2015;135(3):e662–671. doi:10.1542/peds.2014-3099
 © 2024 The Author(s). This work is published and licensed by Dove Medical Press Limited. The full terms of this license are available at https://www.dovepress.com/terms.php and incorporate the Creative Commons Attribution - Non Commercial (unported, v3.0) License.
By accessing the work you hereby accept the Terms. Non-commercial uses of the work are permitted without any further permission from Dove Medical Press Limited, provided the work is properly attributed. For permission for commercial use of this work, please see paragraphs 4.2 and 5 of our Terms.
© 2024 The Author(s). This work is published and licensed by Dove Medical Press Limited. The full terms of this license are available at https://www.dovepress.com/terms.php and incorporate the Creative Commons Attribution - Non Commercial (unported, v3.0) License.
By accessing the work you hereby accept the Terms. Non-commercial uses of the work are permitted without any further permission from Dove Medical Press Limited, provided the work is properly attributed. For permission for commercial use of this work, please see paragraphs 4.2 and 5 of our Terms.