Back to Journals » International Journal of Nanomedicine » Volume 15
Zn-Incorporated TiO2 Nanotube Surface Improves Osteogenesis Ability Through Influencing Immunomodulatory Function of Macrophages
Authors Chen B, You Y, Ma A, Song Y, Jiao J, Song L, Shi E, Zhong X, Li Y, Li C
Received 31 December 2019
Accepted for publication 29 February 2020
Published 27 March 2020 Volume 2020:15 Pages 2095—2118
DOI https://doi.org/10.2147/IJN.S244349
Checked for plagiarism Yes
Review by Single anonymous peer review
Peer reviewer comments 2
Editor who approved publication: Dr Mian Wang
Bo Chen,1 Yapeng You,1 Aobo Ma,1 Yunjia Song,1 Jian Jiao,2 Liting Song,1 Enyu Shi,1 Xue Zhong,1 Ying Li,1 Changyi Li1
1School of Dentistry, Stomatological Hospital, Tianjin Medical University, Tianjin, People’s Republic of China; 2Department of Stomatology, Tianjin Medical University General Hospital, Tianjin, People’s Republic of China
Correspondence: Ying Li; Changyi Li
Stomatological Hospital, Tianjin Medical University, No. 12 of Observatory Road, Heping District, Tianjin 300070, People’s Republic of China
Tel +86-22-23332034
; +86-22-23332003
Fax +86-22-23332122
Email [email protected]; [email protected]
Purpose: Zinc (Zn), an essential trace element in the body, has stable chemical properties, excellent osteogenic ability and moderate immunomodulatory property. In the present study, a Zn-incorporated TiO2 nanotube (TNT) was fabricated on titanium (Ti) implant material. We aimed to evaluate the influence of nano-scale topography and Zn on behaviors of murine RAW 264.7 macrophages. Moreover, the effects of Zn-incorporated TNT surface-regulated macrophages on the behaviors and osteogenic differentiation of murine MC3T3-E1 osteoblasts were also investigated.
Methods: TNT coatings were firstly fabricated on a pure Ti surface using anodic oxidation, and then nano-scale Zn particles were incorporated onto TNTs by the hydrothermal method. Surface topography, chemical composition, roughness, hydrophilicity, Zn release pattern and protein adsorption ability of the Zn-incorporated TiO2 nanotube surface were characterized by scanning electron microscopy (SEM), X-ray diffraction (XRD) and X-ray photoelectron spectroscopy (XPS), surface profiler, contact angle test, Zn release test and protein adsorption test. The cell behaviors and both pro-inflammatory (M1) and pro-regenerative (M2) marker gene and protein levels in macrophages cultured on Zn-incorporated TNTs surfaces with different TNT diameters were detected. The supernatants of macrophages were extracted and preserved as conditioned medium (CM). Furthermore, the behaviors and osteogenic properties of osteoblasts cultured in CM on various surfaces were evaluated.
Results: The release profile of Zn on Zn-incorporated TNT surfaces revealed a controlled release pattern. Macrophages cultured on Zn-incorporated TNT surfaces displayed enhanced gene and protein expression of M2 markers, and M1 markers were moderately inhibited, compared with the LPS group (the inflammation model). When cultured in CM, osteoblasts cultured on Zn-incorporated TNTs showed strengthened cell proliferation, adhesion, osteogenesis-related gene expression, alkaline phosphatase activity and extracellular mineralization, compared with their TNT counterparts and the Ti group.
Conclusion: This study suggests that the application of Zn-incorporated TNT surfaces may establish an osteogenic microenvironment and accelerate bone formation. It provided a promising strategy of Ti surface modification for a better applicable prospect.
Keywords: titanium surface modification, TiO2 nanotube, zinc nanoparticles, immunomodulatory function, osseointegration
Introduction
Although titanium (Ti) and its alloy implants have good biocompatibility and high success rates,1,2 implant failure occasionally occurs and is mostly attributed to its bio-inertness.3,4 In order to improve the bioactivity of Ti-based material, numerous methods have been applied. Strategies for implant surface modification include modifying the surface topography5 (such as nanoscale or microscale structures); adjusting the surface chemistry6 (hydrophilicity and electric potential); incorporating bioactive molecules or drugs7–9 (such as IL-10, TNF-alpha, IL-4, steroid and non-steroidal anti–inflammatory drugs); and incorporating trace elements10–12 (such as calcium, magnesium, strontium and zinc).
In addition, immune cells including macrophages attracted to the site of implantation also play a crucial role in implant success by supplying a suitable immune microenvironment for bone regeneration around the implant.13–15 Therefore, the effects of implant material on cell behaviors of macrophages, the important immune cell, have gradually attracted researchers’ attention.16–19 After the implant surgery, blood clots form around the implant through activation of the complement system.20,21 Meanwhile, chemokines are secreted to enhance the immune response by recruiting immune cells.22 The macrophages release the relevant cytokines that regulate the osteoclast/osteogenesis balance and induce or inhibit bone formation.23 Therefore, it is urgent to develop implant materials with immunomodulatory roles to accelerate osteogenesis.
In recent years, the TiO2 nanotube (TNT) has been widely considered for its excellent osteogenic functions24 and immunomodulatory capacity.25 The TNT structure has the advantages of simple preparation, economy, controlled pore size, uniform structure and stable properties. Several studies have shown that the TNT coating could improve adhesion, proliferation and differentiation of osteoblasts.3,26 Meanwhile, it could also accelerate osseointegration.27–29 The TNT topography was also reported to balance in vitro immune response.30 However, the mechanism of the immunomodulatory function of the TNT coating has not been fully elucidated.
In addition, the TNT coating serves as an optimal loading and release platform for inorganic elements such as argentum (Ag) and trace elements including strontium (Sr) and zinc (Zn).12,24,31 Excess Ag could induce cytotoxicity and DNA damage;32 while the dose of Sr should be strictly controlled to avoid a deleterious effect during bone formation.24 On the contrary, Zn is one of the essential trace elements in the body, it could regulate cell proliferation, differentiation and apoptosis,33–35 and a lack of Zn can cause retardation of bone growth.36 Moreover, Zn is not easy to inactivate, and its stable chemical nature is also more conducive to its application in implant surface modification.37 Meanwhile, Zn plays an important role in both the innate immune system and the adaptive immune system.35 Zn regulates T cell activation via stimulating auto-phosphorylation by interaction with the cytoplasmic tails of CD4 and CD8.38 In addition, the cytokine signaling pathways are also influenced by the status of Zn. Zn deficiency could, on one hand, increase the effect of IL-6 stimulation, and then cause the proliferative response of T and B lymphocytes. On the other hand, Zn deficiency could adversely influence the IL-4 signaling, and then impair the immune system.35,39,40 It has also been reported that Zn could reduce the expression of TNF-alpha and IL-1beta, and maintain immune homeostasis.41,42
Although the osteogenic properties of TNT and Zn have been separately reported before, the combined function of both TNT structure and Zn addition, especially the osteoimmunomodulatory (OIM) effects of the Zn-incorporated TNT surface, have not been fully elucidated. Thus, in the present work, a series of Zn-incorporated TNT structures were established and the Zn release profile was measured. We examined the effects of Zn and TNT topography on cell responses of macrophages. Moreover, the influence of Zn-incorporated TNT surface-modified macrophages on the cell behaviors and osteogenic ability of osteoblasts was also examined. We hypothesize that superimposing Zn onto a TNT structured titanium surface could accelerate the osteogenic ability of osteoblasts, through the improved immunomodulatory function of macrophages.
Materials and Methods
Specimen Preparation and Surface Characterization
Preparation of TiO2 Nanotubes
Pure Ti discs with a diameter of 14 mm and thickness of 1.2 mm (ASTM F67 unalloyed Ti, grade 2; purity 99.7%; impurities content: O, 0.14%; Fe, 0.09%; C, 0.04%; N, 0.02%; other elements, 0.01%) were obtained from Baoji Titanium Industry (Baoji, Shanxi, China), and polished by 320, 400, 800 and 1200 grit sandpaper in sequence. After that, Ti disks were ultrasonically cleaned using acetone, ethanol and deionized water for 10 min in turn and dried in air. The electrolyte consisted of 0.49% hydrofluoric acid (HF) in deionized water. The platinum sheet was used as a cathode and the titanium plate as an anode. The nanotubes were fabricated under a voltage of 5 V, 15 V and 25 V for 40 min by high-voltage DC power supply (Dongwen High Voltage Power Supply Factory, Tianjin, China). All TNT groups were annealed at 450 °C for 3 h and named 5V, 15V and 25V, respectively.
Combination of Zn with TNTs
Three TNT groups of samples (5V, 15V and 25V) were hydrothermally reacted at 200 °C for 90 min in 0.01 M zinc acetate solution, followed by drying in air and washing twice with 1 mL phosphate buffer solution (PBS; Solarbio, Beijing, China) to clean out the extra Zn on the surface. All Zn-incorporated TNT groups were denoted 5VZn, 15VZn and 25VZn, respectively. Figure 1 illustrates the flow diagram of the present experiment.
 |
Figure 1 Flow diagram of the experiment. Abbreviations: Ti, titanium; DC, direct current; HF, hydrofluoric acid; TNT, TiO2 nanotube; Zn, zinc; ZnO, zinc oxide; SEM, scanning electron microscopy; XPS, X-ray photoelectron spectroscopy; XRD, X-ray diffraction; LPS, lipopolysaccharides; CCK-8, cell counting kit-8 assay; LDH, lactate dehydrogenase assay; CLSM, confocal laser scanning microscopy; qPCR, quantitative real-time polymerase chain reaction; ELISA, enzyme-linked immunosorbent assay; ALP, alkaline phosphatase assay; ARS, Alizarin red S assay. |
Surface Characterization
Surface morphologies were observed using scanning electron microscopy (SEM; Hitachi Ltd, Tokyo, Japan). X-ray diffraction (XRD; Philips X’Pert PRO, MA, USA) was applied to detect the sample phase compositions, X-ray photoelectron spectroscopy (XPS; Kratos Analytical Ltd, Manchester, UK) was used to survey the bonding states of sample’s constituents and energy-dispersive X-ray spectrometry (EDS; Hitachi Ltd) was applied to detect the sample phase compositions.
The surface roughness was measured by a surface profiler (Taylor Hobson, PA, USA) at a 5 mm scan distance and reported as the Ra (arithmetical mean deviation of the profile) values. The hydrophilicity was assessed by a contact angle goniometer (Chongda Intelligent Technology Co., Ltd, Xiamen, China). All experiments were repeated three times.
Zinc Release and Loading Amount Measurement
Different samples were immersed into 10 mL PBS, and then the solution was collected at each denoted time point and fresh PBS was added to replace the extracted solution. The test period continued for 21 days. The collected solution was detected by inductively coupled plasma atomic emission spectrometry (ICP-AES; Varian, CA, USA).
In order to measure the total loading amount of Zn on various Zn-loaded TNT surfaces, samples were totally dissolved in the solution of 1% HF and 1.5% HNO3 for ICP-AES detection.
Protein Absorption Assay
To assay the protein absorption of the samples, 1 mL of essential medium alpha (MEM alpha; Gibco, CA, USA) containing 10% fetal bovine serum (FBS; Gibco) was added to the sample and incubated at 37 °C for 24 h. Afterward, the samples were transferred into a new 24-well plate and 1% sodium dodecyl sulfate (SDS) solution was added. Different samples were shaken for 1 h to transfer the protein adsorbed on the samples into the solution. The protein amount in the SDS solution was measured via a micro BCA kit (Solarbio).
Behaviors of RAW 264.7 Cells Cultured on Different Surfaces
RAW 264.7 cells (American Type Culture Collection, ATCC, VA, USA) were cultured in Dulbecco’s Modified Eagle's Medium (DMEM; Gibco) supplemented with 10% FBS, and 1% (v/v) penicillin/streptomycin (Gibco) in a 5% CO2 incubator (Thermo Fisher Scientific, MA, USA) at 37 °C. All samples used for cell culture were sterilized using a 25 kGy dose of gamma radiation (cobalt-60; Huanming Gaoke Fuzhao Co., Tianjin, China). The cells were seeded on different samples in a 24-well plate at a density of 3×10⁴ cells per well. Lipopolysaccharides (LPS, 1 µg/mL; Sigma-Aldrich, MO, USA) were added except for the Ti group after 24 h, and this point was defined as day 0. There were in total 8 groups in this part of the experiment, named Ti, LPS (Ti surface added with LPS, the inflammation model), 5VZn, 15VZn, 25VZn, 5V, 15V and 25V, respectively.
Cell Proliferation Assay
Cell proliferation was tested by a cell counting kit-8 (CCK-8; NCM Biotech, Zhejiang, China) on day 1, 3, 5 and 7. A 10% (v/v) concentration of CCK-8 reagent was added to complete medium. After incubation for 90 min at 37 °C, the culture medium was transferred into a new 96-well plate and then measured by a microplate reader (Cytation 5; Bio-Tek, VT, USA) at 450 nm.
Cytotoxicity Assay
As a marker of cytotoxicity, the LDH level in cell supernatant was detected by a lactate dehydrogenase kit (LDH kit; Solarbio) on day 1, 3, 5 and 7. After collecting and centrifuging the cell supernatant, the activity of LDH was tested, and then calculated with the standard curve and relative optical density (OD) values.
Cell Morphology and Cytoskeleton Actin Staining
To observe the cell morphology, RAW 264.7 cells grown on the samples were fixed on day 1 and day 3 with 2.5% glutaraldehyde solution (Solarbio) at 4 °C for 2 h. Then, samples were further fixed with 1% osmic acid without light for 1 h. Dehydration was performed in sequential ethanol solutions (30%, 50%, 75%, 90%, 95% and 100% [v/v]) and dried by critical point dryer (Leica, Hesse-Darmstadt, Germany). Cell morphologies on different substrates were photographed by SEM (Hitachi Ltd).
Macrophages cultured on the samples were fixed with 4% paraformaldehyde and permeabilized with 0.25% Triton X-100 (Solarbio) on day 1 and day 3. Cytoskeleton actin and nuclei were stained with TRITC–rhodamine phalloidin (Thermo Fisher Scientific) and DAPI (Thermo Fisher Scientific), respectively, without light. Photographs were taken by confocal laser scanning microscopy (CLSM; Zeiss, Baden-Württemberg, Germany).
Pro-Inflammatory (M1) and Pro-Regenerative (M2) Marker Gene Expression
On day 1, 3 and 5, the cells on samples were extracted by TRIzol (Thermo Fisher Scientific). Mouse mRNA encoding genes for interleukin-6 (IL-6), tumor necrosis factor-alpha (TNF-alpha), transforming growth factor-beta (TGF-beta) and heme oxygenase-1 (HO-1) were selected, using the housekeeping gene glyceraldehyde-3-phosphate dehydrogenase (GAPDH) as the internal control. Reverse transcription and quantitative real-time polymerase chain reaction (qPCR) was performed and results were calculated by the 2−ΔΔCt method. Primers used for both the target genes and the housekeeping gene are shown in Table 1.
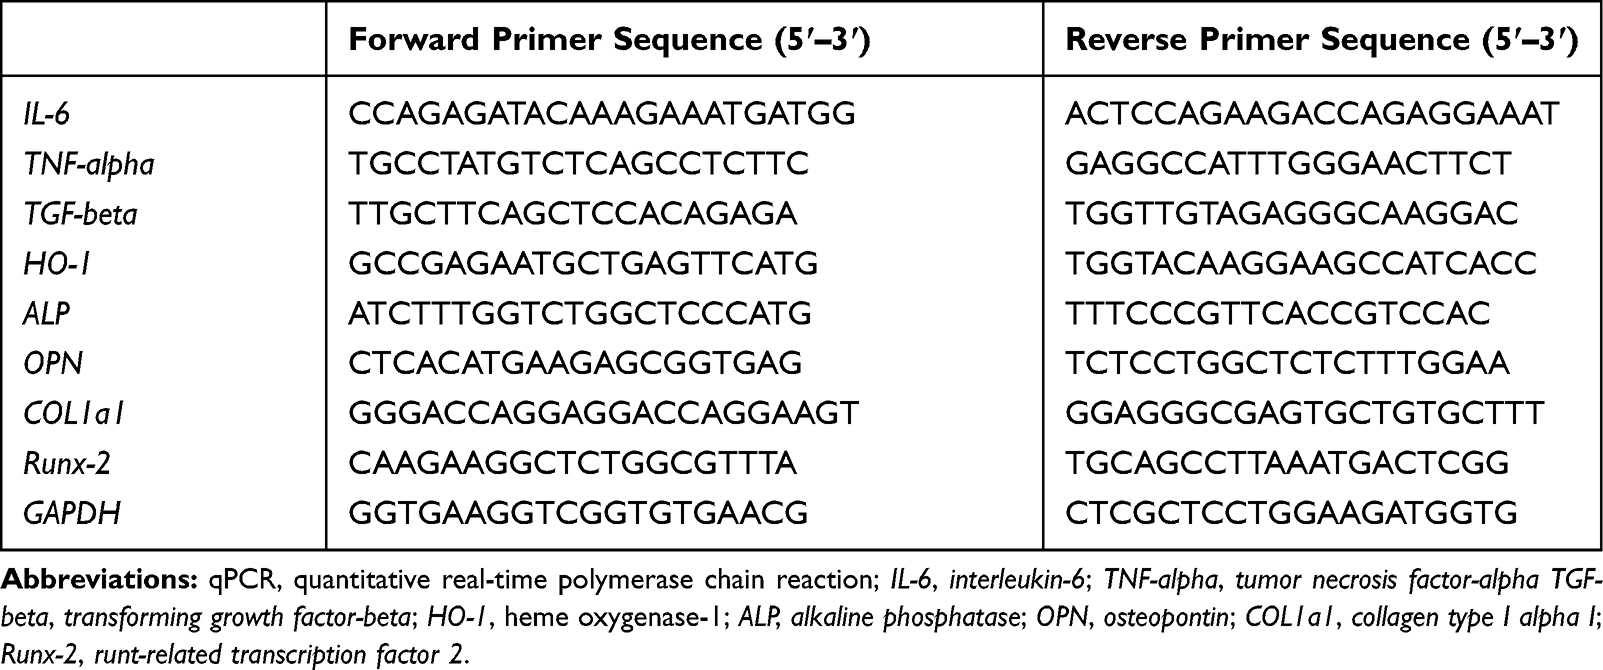 |
Table 1 Primers Used for qPCR |
Enzyme-Linked Immunosorbent Assay (ELISA)
The concentrations of inflammatory protein markers in cell supernatant were determined by ELISA kits (ImmunoWay, TX, USA). The concentrations of interleukin-6 (IL-6), tumor necrosis factor-alpha (TNF-alpha), transforming growth factor-beta (TGF-beta) and heme oxygenase-1 (HO-1) were calculated by the OD values and standard curve.
Behaviors of MC3T3-E1 Cells on Different Material Surfaces in Conditioned Medium (CM)
Collection and Preparation of CM
RAW 264.7 cells were seeded onto different samples in a 24-well plate at a density of 3×10⁴ cells per well and cultured for 7 days. The culture medium of each group was collected every day and centrifuged at 1500 rpm for 15 min. After collecting the supernatant, it was filtered through a 0.22-μm filter. The MEM alpha with 10% FBS and 1% penicillin/streptomycin were mixed with the filtered supernatant at a ratio of 1:1 to get CM, and stored at 4 °C. The prepared CM of each group was used for the first 7 days in this part of the experiment. After that, all groups were cultured in osteogenic medium (OM, MEM alpha with 10% FBS, 1% penicillin/streptomycin, 10 mM beta-glycerophosphate disodium and 50 μg/mL ascorbic acid).
Cell Proliferation Assay
The CCK-8 kit was used to examine cell proliferation on day 1, 3, 5 and 7.
Cytotoxicity Assay
The LDH kit was used to evaluate cytotoxicity on day 1, 3, 5 and 7.
Cell Morphology and Cell Adhesion
MC3T3-E1 cells (CRL-2593; American Type Culture Collection) were cultured in MEM alpha containing 10% FBS and 1% (v/v) penicillin/streptomycin in a 5% CO2 incubator at 37 °C, with the culture medium changed every day. Cells were seeded on different samples and observed on day 1 and 3 by SEM. The processes of the prepared SEM sample were the same as the experiment for macrophage cell morphology. For cell adhesion, osteoblasts on different samples were fixed with paraformaldehyde and permeabilized with Triton X-100 on day 1 and 3. Vinculin antibody (1:50 dilution; Sigma Aldrich) and FITC-secondary antibody (1:200 dilution; Sigma Aldrich) were used successively to stain the vinculin protein. The cytoskeleton and nucleus were stained with TRITC–rhodamine phalloidin and DAPI, respectively. Images were photographed by CLSM. ImageJ software (National Institutes of Health, MD, USA) was applied to analyze the intensity of fluorescence.
Osteogenic-Related Gene Expression
On day 7 and 14, cells on the samples were extracted by TRIzol. Expression levels of mouse mRNA encoding genes for alkaline phosphatase (ALP), osteopontin (OPN), collagen type 1 alpha 1 (COL1a1) and runt-related transcription factor-2 (Runx-2) were detected, with the housekeeping gene GAPDH treated as the internal control. Reverse transcription and RT-PCR were used and data were calculated by the 2−ΔΔCt method. Primers used for the target genes and the housekeeping gene are shown in Table 1.
Alkaline Phosphatase (ALP) Assay
After 3, 5, 7 and 14 days of cultivation, ALP activity in cells was measured by an ALP activity kit (Jiancheng Co., Ltd, Jiangsu, China), and calculated by the OD values.
Alizarin Red S (ARS) Staining
Cells on different surfaces were cultured for 21 days. Afterward, cells were stained with 2% Alizarin red S (Sigma-Aldrich) for 30 min at 37 °C. A digital camera (Canon, Japan) was used to record the images of each group. For quantitative results, 1 mL of 10% cetylpyridinium chloride (CPC; Sigma-Aldrich) was added into each plate and then incubated for 30 min. Then, 200 μL of the aliquots were transferred into a 96-well plate, and the absorbance was read by microplate reader at 562 nm.
Statistical Analysis
The experiments were conducted in triplicate and the data were expressed as mean ± standard deviation (SD). One-way ANOVA combined with the Tukey post hoc test was applied to examine the statistical difference among groups. All p values were two-tailed and the level of significance was set at 0.05. Statistical analyses were performed using SAS version 9.4 (SAS Institute Inc., NC, USA) or Origin 2019b (OriginLab, MA, USA).
Results and Discussion
Characterization of the Zn-Incorporated TNT Surface
Surface Topography
Figure 2 shows the surface topographies of different samples observed by SEM. The original Ti surface displayed a relatively smooth surface with only scratches mainly produced by the grinding step (Figure 2G). While on the 5V, 15V and 25V TNT surfaces (Figure 2A–C), homogeneous nanotube structures were observed. The average diameters of Zn-loaded nanotubes on the surfaces of 5V, 15V and 25V TNT substrates were approximately 30±5 nm, 70±7 nm and 100±12 nm, respectively. Similar to previous studies,43 as the anodization voltage rose, the thickness of the nanotube wall also gradually increased. This phenomenon is explained by the increased voltage enhancing the movement of ions over the oxide layer, so as to increase the wall thickness of TNT.44 Figure 2D–F illustrates that Zn nanoparticles were uniformly attached around the open end of the TNT wall. It was observed that as the TNT diameter increased from 30 nm to 100 nm, the particle size of Zn attached to the TNT also increased, from around 10 nm to 30 nm, respectively. Previous scholars used a similar method to prepare Zn-loaded TNT and reported that ZnO nanoparticles were distributed along the walls.24,45 Thus, we speculated that ZnO nanoparticles exist not only around the open end but also inside the TNT wall. This speculation is partly proved by the following fact. As the total Zn content decreased from 26.2±1.5 (5VZn group) to 13.5±0.8 (15VZn group) to 8.4±1.0 μg (25VZn group), the surface Zn wt% decreased from 15.43±0.52 (5VZn group) to 10.18±0.61 (15VZn group) to 7.85±0.73 (25VZn group). The discrepancy between the decreasing trend of the total Zn content and surface Zn wt% implied that the origin of Zn was both around the open end and inside the TNT wall (Table 2). Macrophages utilized particles by macropinocytosis and clathrin/caveolin-independent endocytosis while smaller than 500 nm.23,46,47 At the same time, nanoscale particles could increase the specific surface area and enhance biological effects.48 Therefore, we constructed nanoscale Zn particles in order to improve the activity of Zn and improve its biological effects. The anodic oxidation and heat treatment determine the bonding strength between Zn-loaded TNT and the Ti basement. In previous studies, when using similar methods to fabricate Zn-loaded TNT structures, the interface bonding strength between TNT and Ti-basement substrate,49 the in vivo long-term corrosion resistance ability50 and the implant fixation strength in rat models51,52 all displayed satisfied results. All of these results suggested that the bonding strength of the Zn-loaded TNT substrate meets the requirement of implantation in the human body, and future experiments are planned to further verify this.
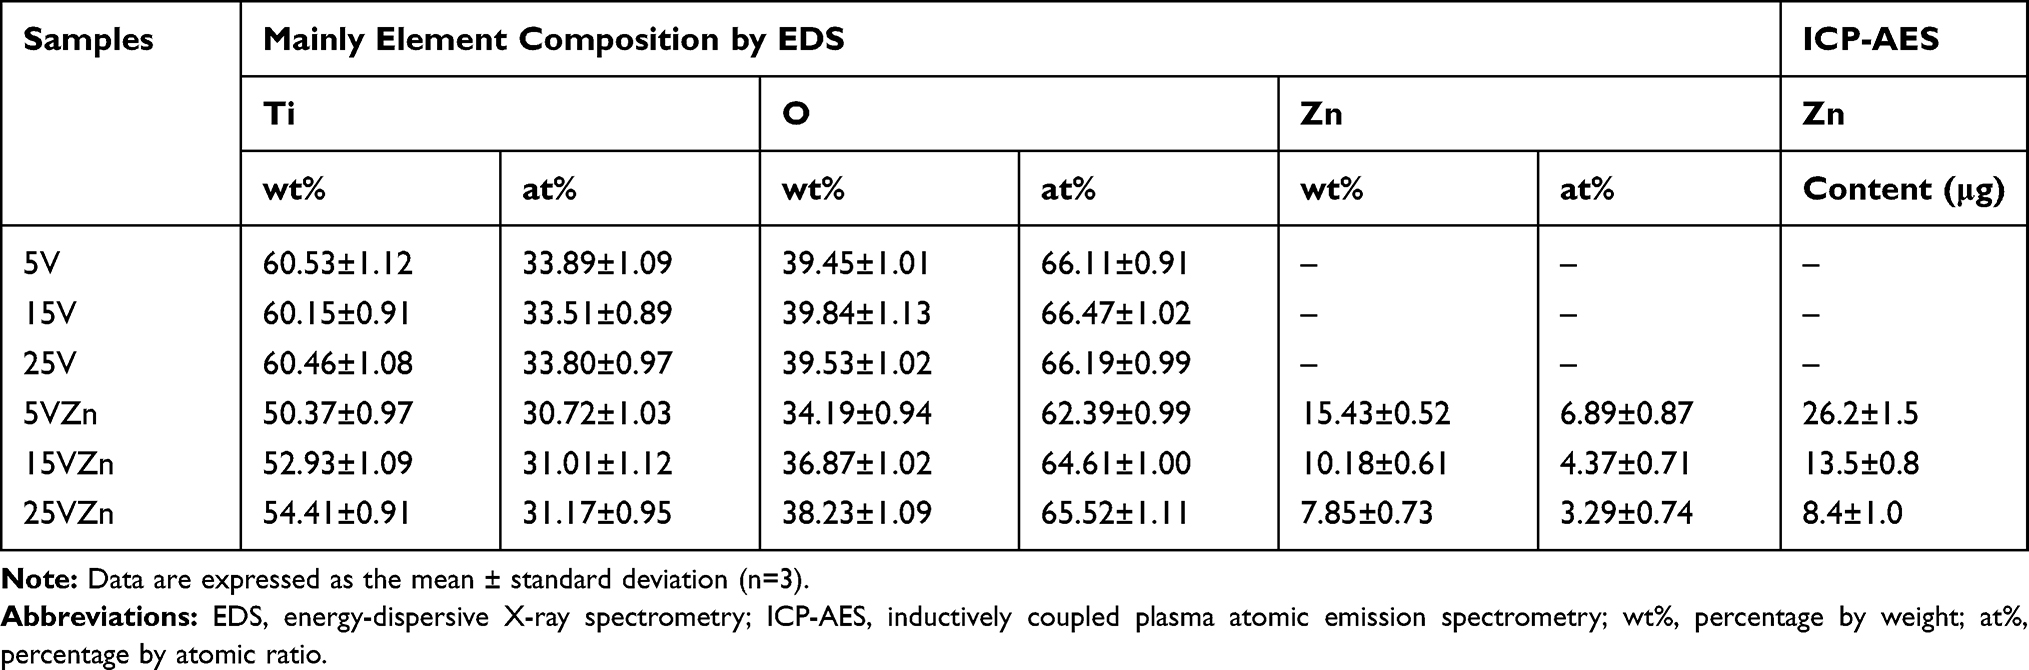 |
Table 2 EDS and ICP-AES Assay for TNT and Zinc-Incorporated TNT Samples |
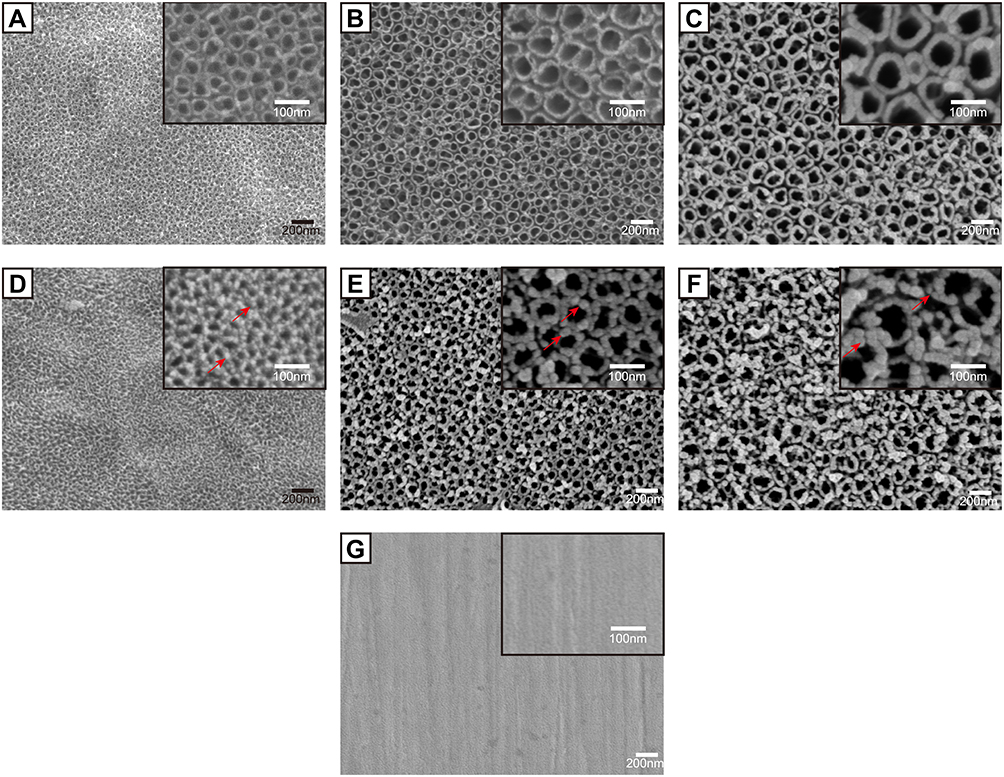 |
Figure 2 Surface morphology of the samples observed by SEM with the insets showing the higher-magnification images. Notes: (A) 5V, (B) 15V, (C) 25V, (D) 5VZn, (E) 15VZn, (F) 25VZn, (G) pure Ti. The red arrows indicate zinc nanoparticles. Abbreviations: SEM, scanning electron microscopy; Ti, titanium; Zn, zinc; 5V/15V/25V, TNTs formed by anodization at a voltage of 5V/15V/25V; 5VZn/15VZn/25VZn, ZnO nanoparticles incorporated in 5V/15V/25V TNTs. |
Chemical Composition, Surface Profile and Wettability
The XRD spectra displayed in Figure 3A show that anatase TiO2 and Ti peaks were detected in the single TNT and Zn-incorporated TNT groups. ZnO peaks were discovered in all Zn-incorporated TNT groups. The XPS spectra of different samples are shown in Figure 3B. The wide scan spectrum showed that the main components of all samples included Ti and O. The C signals were most likely present due to contamination. In Zn-loaded TNT groups, the rising of peaks in Zn further proved the successful combination of nano-scale Zn particles with TNTs. As shown in Table 2, the EDS results displayed that the atomic ratio (at%) of Ti to O for all of the TNT groups was about 1:2, which suggested that TNT surfaces were mainly composed of TiO2. While for the zinc-incorporated samples, the weight percentage (wt%) of Zn decreased from 15.43±0.52 to 7.85±0.73 as the TNT diameter increased from 30 nm (5VZn group) to 100 nm (25VZn group). This implies that the TNT surface with a smaller diameter has higher Zn loading ability.
 |
Figure 3 Surface chemical composition analyses by XRD (A) and XPS (B). Abbreviations: XRD, X-ray diffraction; XPS, X-ray photoelectron spectroscopy. |
The surface profiler showed that the TNT coating could enhance the surface roughness (Figure 4A), while Zn incorporation could moderately decrease this effect. As shown in Figure 4B, larger diameter TNTs exert better hydrophilicity, and the incorporation of Zn did not impair the TNTs’ original excellent hydrophilic properties.
 |
Figure 4 Roughness values (A) and contact angles (B) of samples. Notes: Data are expressed as the mean ± standard deviation (n=3). $Denotes the statistical significance between Ti and other groups. #Denotes the statistical significance between each Zn-incorporated TNT group and its TNT counterpart group. &Denotes the statistical significance between different labeled groups. ($P<0.05, #P<0.05, &P<0.05, ANOVA.) Abbreviation: Ra, arithmetical mean deviation of the profile. |
Zn Loading Ability and Release Profile
The total zinc contents in the 5VZn, 15VZn and 25VZn groups detected by ICP-AES are shown in Table 2. The zinc content reduced along with increasing TNT diameter, and the possible reason for this negative correlation could be explained as follows. As the diameter of the formed TNTs increased, the specific surface area reduced and the adsorption capacity of the nano-scale zinc particles decreased, which resulted in reduced zinc content.
The cumulative release amount curve (Figure 5A) and the cumulative release percentage curve (Figure 5B) were assessed by ICP-AES. Previous studies have shown that 0.01–1 ppm zinc can effectively promote osteogenesis, while a dose of more than 1 ppm may affect cell proliferation and osteogenesis, or even produce toxicity.53–57 Since the loading amount of Zn determines its release concentration and release duration, we conducted a preliminary experiment to obtain technological parameters for fabricating Zn-loaded surfaces with an ideal release concentration and release duration of Zn (data not shown). We adjusted the loading amount of Zn by changing the concentration of zinc acetate solution, hydrothermal reaction time and temperature. Finally, we chose the parameter that different TNT diameter samples reacted in a 0.01 M zinc acetate solution at 200 °C for 90 min. In the present study, the Zn release amounts of all Zn-loaded TNT groups were lower than 1 ppm per day, within the range of promoting osteogenesis. In all of the Zn-loaded TNT groups, the Zn release time lasted for at least 21 days. Although the 5VZn group had the highest zinc release amount, its release curves were fluctuant with two release peaks observed around day 3–5 and day 6–7. In contrast, the release curves of the 15VZn and 25VZn groups were relatively smooth, without obvious fluctuation of release.
 |
Figure 5 Zinc release profiles of zinc-incorporated samples. Notes: The cumulative release amount curve (A) and cumulative release percentage curve (B) were assessed by ICP-AES; data are expressed as the mean ± standard deviation (n=3). Abbreviation: ICP-AES, inductively coupled plasma atomic emission spectrometry. |
The initial stage (1–2 weeks) after implant surgery is the key period to regulate bone remodeling and the foundation of early osseointegration.23,58 The cumulative release percentage curve (Figure 5B) further showed that for all of the Zn-loaded NT groups, 81.7–96.6% of Zn was released during the first 21 days, which may play an important role in the initial stage after implant surgery.
Liu et al24 built TNTs incorporated with ZnO nanoparticles to optimize stem cell functions and antibacterial properties, and the materials could achieve sustained Zn release for 9 days. Huo et al45 established a Zn-incorporated nanotube array to improve the osteogenic activity and antibacterial effects of titanium surfaces, and about 0.06 ppm Zn was detected on the first day and this nanotube array could effectively enhance the ability of bone formation. The Zn-loaded nanotube surfaces displayed a long period of controlled release of Zn, within the effective concentration of Zn for osteogenesis during the 21-day release period. Our release profile data are consistent with previous results. Moreover, when comprehensively considering the safe effective concentration of zinc, total zinc contents and zinc release profiles among the three Zn-loaded NT groups, the 15VZn group was superior to the 5VZn and 25VZn groups.
Protein Absorption Assay
The protein adsorption assay is shown in Figure 6. All TNT groups and zinc-loaded TNT groups showed superior protein adsorption ability compared with the Ti group, with statistical significance. The surface of the implant with excellent adsorption capacity could adsorb more compact components and vitronectin in the blood, which have been proven to have a significantly better effect on the immune response.59 Other experiments also showed that both Zn and TNT loading can increase the protein adsorption capacity of the material surface.45 Our results showed that, consistent with previous studies, TNT surfaces displayed more advanced protein adsorption ability than the smooth Ti surface; while the Zn-loaded TNT substrate maintained the superior protein adsorption ability of the original TNT surface, compared with pure Ti.
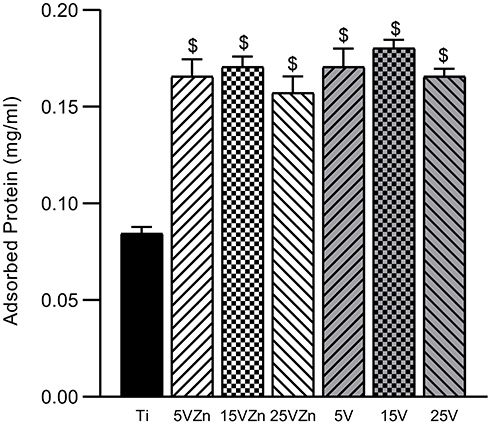 |
Figure 6 Protein absorption assay of samples. Notes: Data are expressed as the mean ± standard deviation (n=3). $Denotes the statistical significance between Ti and other groups. ($P<0.05, ANOVA.) |
Behaviors of RAW 264.7 Cells Cultured on Different Surfaces
Cell Viability and Cytotoxicity
The CCK-8 kit was used to detect cell viability, while the LDH kit was applied to detect the amount of lactate dehydrogenase in the cell supernatant to evaluate cell apoptosis. As shown in Figure 7, there was no statistical significance on day 1 and 3 for cell viability and on day 1, 3 and 5 for the number of apoptotic cells between all groups (p>0.05). On day 5 and 7, the cell viability of all Zn-loaded groups and TNT groups was higher than that of the Ti group, with the cell viability of the 5VZn group lower than the other Zn-loaded groups (p<0.05). However, for the LDH assay, the amount of cell apoptosis for all groups increased obviously on day 7 compared with day 5, with the number of apoptotic cells of all Zn-loaded TNT groups and TNT groups significantly lower than that of the Ti group. Consistent with previous research,60–62 our results showed that TNT could promote proliferation and reduce apoptosis of RAW264.7 macrophages, compared with pure Ti. At the same time, the concentration of Zn loaded on TNT had no apparent effect on cell apoptosis, and the addition of appropriate zinc did not impair cell viability compared to their TNT counterparts. The cell viability of the 5VZn group was lower than 5V and the other Zn-loaded groups on day 5 and day 7. The decreased cell viability at these time points coincided with the two increased release peaks in the 5VZn sample around day 3–5 and day 6–7 (Figure 5A). This suggested that the increased release of Zn led to a decrease in cell activity and a slow down in proliferation, but did not increase cell apoptosis.
 |
Figure 7 CCK-8 (A) and LDH activity (B) results of RAW264.7 cells after culturing for 1, 3, 5 and 7 days on different surfaces. Notes: Data are expressed as the mean ± standard deviation (n=3). nsDenotes no statistical significance between all different groups. $Denotes the statistical significance between Ti and other groups. #Denotes the statistical significance between each Zn-incorporated TNT group and its TNT counterpart group. &Denotes the statistical significance between different labeled groups. ($P<0.05, #P<0.05, &P<0.05, ANOVA.) Abbreviations: CCK-8, cell counting kit-8; LDH, lactate dehydrogenase. |
Cell Morphology and Cytoskeleton Actin Staining
SEM and CLSM were used to observe cell morphology and the cytoskeleton. Previous research has shown that inflammatory activation of macrophages led to the change of cell morphology.63 The unactivated MΦ phenotype macrophages were spherical-like. The pro-inflammatory M1 phenotype macrophages presented rounded-like shapes accompanied by enlargement of the spreading area. Pro-regenerative M2 cells are usually characterized by slender shapes.14 In this study, the SEM images showed that on day 1, macrophages seeded on the Ti surface (Figure 8A) showed a spherical and clustered morphology, which indicated the MΦ phenotype. Almost all of the LPS group’s cells (Figure 8B) were activated, and showed significantly rounded-like shapes, with enlargement of the spreading areas and signally stretched filopodia. In the 5V, 15V and 25V groups on day 1, some cells were activated, and both round-like cells (M1) and elongated (M2) cells were found in these groups; while the others retained MΦ shape (Figure 8D, F and H). While in the 15VZn group (Figure 8E), almost all cells were activated, displaying M1 or M2 shape, and showed numerous pseudopods on day 1. For cells cultured on all surfaces, the number of cells on day 3 (Figure 8a–h) was obviously more than that on day 1 (Figure 8A–H). The cells proliferated into clusters and were stacked one on the top of the other. Both M1 and M2 shapes of cells were found in the Zn-incorporated groups (Figure 8c, e and g), and M2 phenotype domination was most obviously observed in the 15VZn and 25VZn groups. In summary, the majority of macrophages in the LPS group confirmed the M1 phenotype; some of the macrophages on the TNT surface displayed the M1 and M2-polarized phenotype. While in the 15VZn and 25VZn groups, almost all cells were activated, the minority of macrophages transformed to the M1-polarized phenotype and the majority converted to the M2-polarized phenotype.
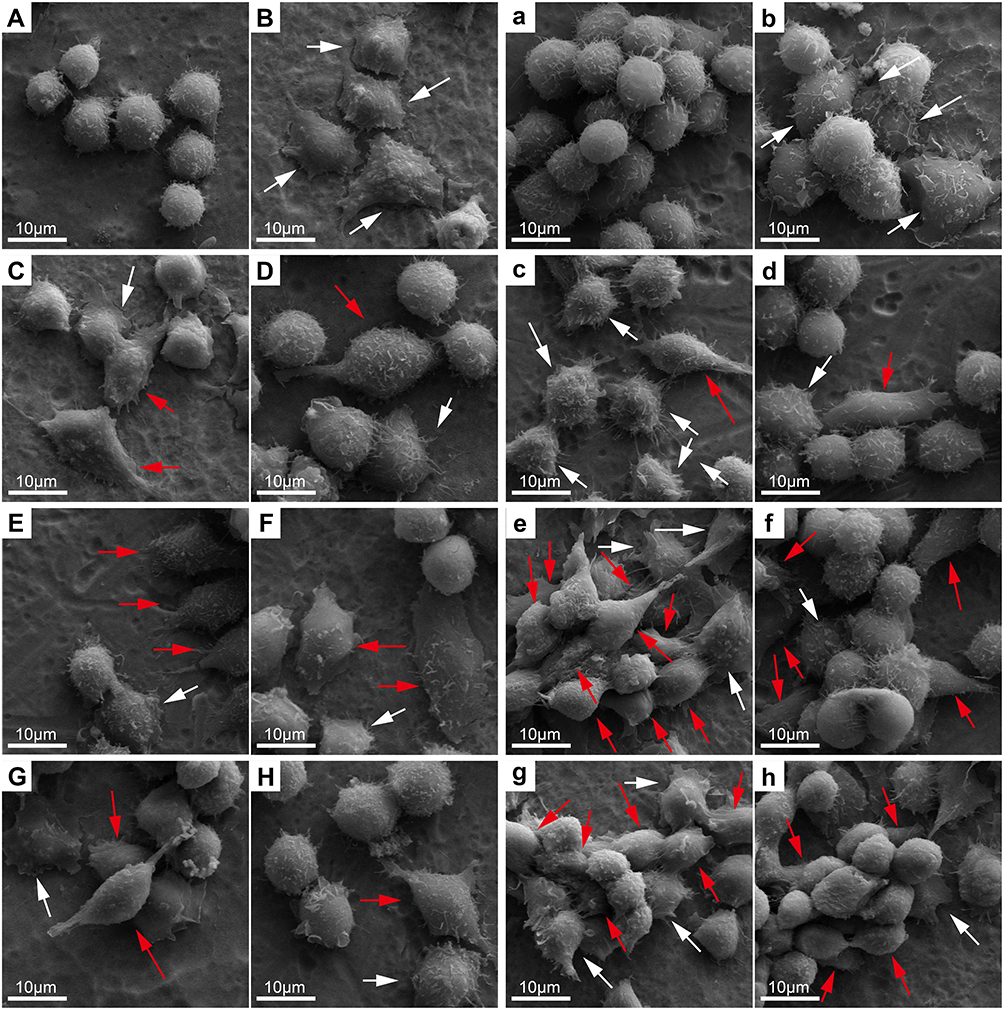 |
Figure 8 SEM images of RAW 264.7 cell morphology after culturing for 1 and 3 days on different samples. Notes: Uppercase letters and lowercase letters indicate the images after 1 and 3 days of culture: (A, a), Ti; (B, b), Ti surface with 1 μg/mL LPS treatment; (C, c), 5VZn surface with 1 μg/mL LPS treatment; (D, d), 5V surface with 1 μg/mL LPS treatment; (E, e), 15VZn surface with 1 μg/mL LPS treatment; (F, f), 15V surface with 1 μg/mL LPS treatment; (G, g), 25VZn surface with 1 μg/mL LPS treatment; (H, h), 25V surface with 1 μg/mL LPS treatment. White arrows indicate M1-like cell shape and red arrows indicate M2-like cell shape. Abbreviations: SEM, scanning electron microscopy; LPS, lipopolysaccharides. |
The results of CLSM were in line with the SEM data. On day 1, the nucleus of the Ti group (Figure 9A) was obvious, and the cytoskeleton was close to the nucleus without conspicuous spreading. For the LPS group (Figure 9B), cells were rounded in shape, with actin showing obvious spreading around the nucleus. On the surface of the Zn-incorporated groups (Figure 9C, E and G), cells showed improved polarization ability compared with the Ti group (Figure 9A) and their TNT counterparts (Figure 9D, F and H), with the cytoskeleton revealing more actin filaments, which stretched in all directions. After 3 days of culture, the cytoskeleton of cells in the Zn-incorporated groups (Figure 9c, e and g), in particular the 15VZn group, continued to show a superior status of polarization than the Ti group and their TNT counterparts. Zhang et al11 reported that a micro-arc oxidation TiO2/nanostructured ZnO coating could facilitate the polarization of macrophages better than the micro-arc oxidation coating. Our data led to a similar conclusion.
 |
Figure 9 CLSM images of RAW 264.7 cells after culturing for 1 and 3 days on different samples. Notes: Uppercase letters indicate the day 1 images, lowercase letters indicate the day 3 images: (A, a), Ti; (B, b), Ti surface with 1 μg/mL LPS treatment; (C, c), 5VZn surface with 1 μg/mL LPS treatment; (D, d), 5V surface with 1 μg/mL LPS treatment; (E, e), 15VZn surface with 1 μg/mL LPS treatment; (F, f), 15V surface with 1 μg/mL LPS treatment; (G, g), 25VZn surface with 1 μg/mL LPS treatment; (H, h), 25V surface with 1 μg/mL LPS treatment. Abbreviations: CLSM, confocal laser scanning microscope; LPS, lipopolysaccharides. |
Pro-Inflammatory and Pro-Regenerative Gene Expression and ELISA Analysis
When cultured on different substrates, macrophages showed varied inflammation-related gene expression and protein synthesis. This may be attributed to the immunoregulatory roles played by different surface characteristics, which suggested that the various substrates had effectively regulated the immune response of macrophages. The gene expression levels and the protein synthesis amounts in the supernatant of macrophages cultured on different surfaces are shown in Figures 10 and 11, respectively. In general, the gene expression levels were consistent with their corresponding protein levels, with the latter having a delayed tendency compared to the former. The inflammation model (LPS group) was successfully constructed, proved by the increased expression of pro-inflammatory marker gene and protein levels, and the decreased expression of pro-regenerative marker gene and protein levels compared with the Ti group.
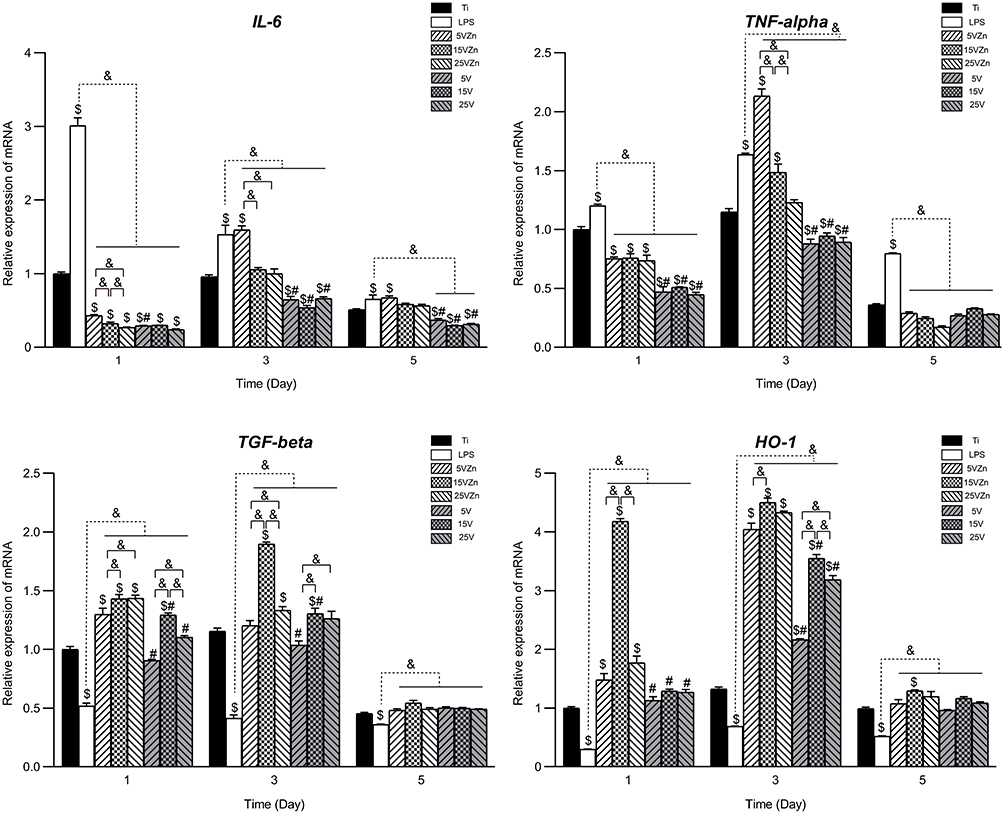 |
Figure 10 Gene expression changes of inflammation-associated cytokines assayed by qPCR. Notes: Data are expressed as the mean ± standard deviation (n=3). $Denotes the statistical significance between Ti and other groups. #Denotes the statistical significance between each Zn-incorporated TNT group and its TNT counterpart group. &Denotes the statistical significance between different labeled groups. ($P<0.05, #P<0.05, &P<0.05, ANOVA.) Abbreviation: qPCR, quantitative real-time polymerase chain reaction. |
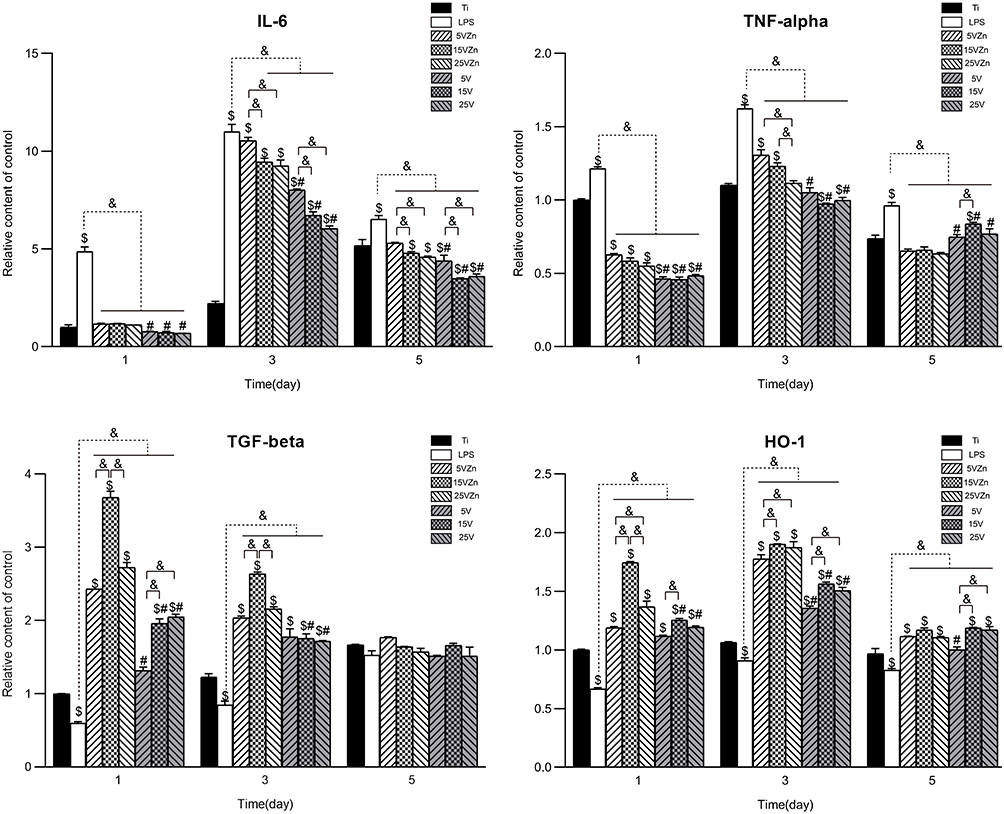 |
Figure 11 Secretion level changes of inflammation-associated cytokines in cell supernatant assayed by ELISA. Notes: Data are expressed as the mean ± standard deviation (n=3). $Denotes the statistical significance between Ti and other groups. #Denotes the statistical significance between each Zn-incorporated TNT group and its TNT counterpart group. &Denotes the statistical significance between different labeled groups. ($P<0.05, #P<0.05, &P<0.05, ANOVA.) Abbreviation: ELISA, enzyme-linked immunosorbent assay. |
For the M1-related pro-inflammatory gene and protein expression (IL-6 and TNF-alpha) levels, the single TNT groups showed strong inhibition ability compared with the LPS group on all test days. On the contrary, compared with the LPS groups and their TNT counterparts, the 15VZn and 25VZn groups showed moderate inhibition of both gene and protein expression levels both on day 1 and day 3. On day 5, similar trends exist except for the expression of TNF-alpha, which may be explained by the fact that the inflammation process entered a stationary phase at this time point. The 5VZn group showed some inconsistent trends compared with the other Zn-loaded groups, which might be related to the increased release peaks of Zn around day 3–5. For the expression of M2 pro-regenerative genes and protein (TGF-beta and HO-1), both the TNT and the Zn-loaded TNT groups showed positive promotion from day 1 until day 3 compared with the LPS group. In the Zn-loaded TNT groups, Zn and TNT displayed synergistic effects on promoting M2 pro-regenerative genes and cytokine expression, with the most obvious effect observed in the 15VZn group, based on both qPCR and ELISA results. Similar to pro-inflammatory genes and protein secretion, the difference between different groups decreased until day 5, which may be explained by the fact that the inflammation process entered a stationary phase.
Osteoimmunomodulation, as a new concept, has been proposed to describe the ability of biological materials to induce osteogenesis by regulating immunity.23 Macrophages are cells that first reach the surface of the implant, and they play a major part in inducing or inhibiting bone formation by releasing different cytokines.20,64,65 An abnormal quantity and function of macrophages can lead to imbalance between osteoclasts and osteoblasts, opening the process of osteolysis, causing osteoporosis, bone resorption and even implant failure.23 The osseointegration process of the implant is accompanied by osteogenesis and osteolysis, and the coordinated balance of the two processes plays an important role in implant success.11 The excessive release of M1-type pro-inflammatory factors (TNF-alpha and IL-6) is usually accompanied by an increased RANKL/OPG ratio and increased osteoclast activity.66 Whereas moderate concentrations of TNF-alpha can increase ALP activity and mineralization,67,68 and IL-6 can accelerate osteophyte maturation, mineralization and remodeling in the early stage of fracture healing.69 M2-type cytokines such as TGF-beta and HO-1 play a prominent role in the middle and late stages of the repair reaction. TGF-beta accelerates the formation of fibrous wraps and separates inflamed tissue from normal tissue, to reduce the formation of inflammatory granulation tissue,70 while the increase of HO-1 can effectively inhibit the excessive action of osteoclasts.71–73 Macrophages of the M1 and M2 phenotypes are indispensable in osteogenesis. Therefore, some scholars suggested that the key factor in determining macrophage-induced osteogenic or osteoclastic effects is the macrophage switch pattern rather than the specific macrophage phenotype.23 Previous studies have shown that surface characterization and chemical composition could both affect the biological behavior of macrophages.74,75 In this research, inflammatory-related gene expression and ELISA analysis showed that TNT topography and Zn could synergistically promote the release of pro-regenerative cytokines and moderately inhibited the secretion of pro-inflammatory cytokines. This may exert the immunomodulatory effect which switches the macrophage to promote osseointegration, which will be further verified in the latter part.
Behaviors of MC3T3-E1 Cells on Different Material Surfaces in Conditioned Medium (CM)
MC3T3-E1 cells are in two microenvironments, one is provided by the CM, and the other is the surface of the material. On one hand, previous research24,45 and our preliminary experiment (data not shown) displayed that the surface of the zinc-loaded TNT material substrate could promote proliferation, differentiation and mineralization of osteoblasts. On the other hand, previous research indicated that all materials implanted into living tissue would initiate an immune response,76 and the discrepancies between in vitro and in vivo biological responses to biomaterials are partially explained by the absence of immune cells involved during the in vitro experiment stage.23 Therefore, considering the crucial effect of the immune environment in evaluating the biological responses to mimic the in vivo environment, we employed the conditioned medium from macrophages in the cell co-culture model and focused on the OIM effect of the zinc-loaded TNT material substrate.
Assessing OIM is a complex process because it involves the interaction between biological materials, immune cells and bone cells. It needs to be implemented using a culture system consisting of the above three factors. Indirect co-culture using condition media, indirect co-culture using Boyden chambers and direct co-culture are three methods of co-culture system to assess OIM.23 Since it was fraught with difficulties to sort different types of cells, we used an indirect co-culture mode using condition medium instead of a direct co-culture model to test the effects of inflammation-related cytokines on osteoblasts.23 Boyden chambers cannot be used in this experiment because there is not enough space to accommodate the material. By comparison with the two alternative methods mentioned above, conditioned medium co-culture was chosen in this experiment to assess OIM because of its simple, rapid procedure and good testing repeatability.77 Since MC3T3-E1 cells are widely used as cell model systems in bone biology,3 we employed this cell line to evaluate the OIM capabilities of different biomaterials in this experiment.
Cell Viability and Cytotoxicity
The CCK-8 kit was used to detect cell viability, and the results are shown in Figure 12A. For each group, the absolute value of cell viability increased from day 1 to day 7. On day 1, there was no statistical significance for any comparison among groups (P>0.05). On day 3, the 5V group showed higher cell viability than the Ti, 5VZn and other TNT groups. On day 5, the Ti group showed the highest cell viability, followed by the 15VZn, 5V and 25VZn groups. On day 7, the advantages of Ti continued to increase, and the advantages of 15VZn, 25VZn and 5V were also obvious.
 |
Figure 12 CCK-8 (A) and LDH activity (B) results of MC3T3-E1 cells after culturing for 1, 3, 5 and 7 days on different surfaces. Notes: Data are expressed as the mean ± standard deviation (n=3). nsDenotes no statistical significance between all different groups. $Denotes the statistical significance between Ti and other groups. #Denotes the statistical significance between each Zn-incorporated TNT group and its TNT counterpart group. &Denotes the statistical significance between different labeled groups. ($P<0.05, #P<0.05, &P<0.05, ANOVA.) Abbreviations: CCK-8, cell counting kit-8; LDH, lactate dehydrogenase. |
LDH levels were used to show cell cytotoxicity and the results are shown in Figure 12B. There was no statistical significance among each group on day 1 and 3. Corresponding with the cell viability results, the 5VZn group showed the highest cell apoptosis level on day 5 and 7. The three TNT groups acted out an intermediate level of cell apoptosis, while the Ti, 15VZn, and 25VZn groups revealed a lower level of cell apoptosis on both day 5 and day 7.
Combing the above-mentioned results, we can conclude that the 15VZn and 25VZn groups displayed advanced cell proliferation and reduced cell apoptosis, compared to other Zn-loaded groups and TNT groups. In particular, the 15VZn substrate (Zn loaded on a 70-nm-diameter nanotube) was more favorable for osteoblast proliferation and cell viability, with the best biocompatibility among all of the groups. The advanced bioactivity of the 15VZn surface may serve as the basis for promoting immune osteogenesis.
Cell Morphology and Cell Adhesion
The SEM images (Figure 13) showed that on day 1 and 3, the cell spreading status of the Zn-loaded TNT group was better than the corresponding TNT and Ti groups, with the best performance in the 15VZn group. The filopodia and the lamellipodia were evenly distributed. The spreading stage was sorted by a decreasing trend in the sequence of the 15VZn, the 25VZn and the 5VZn groups. The cell spreading of the TNT group was better than that of the Ti group, but worse than the Zn-loaded group, and the sequence was 15V>25V>5V. The cells in the Ti group showed growth along with the direction of scratches and poor spreading.
 |
Figure 13 SEM images of MC3T3-E1 cell morphology on different samples after culturing for 1 and 3 days with the insets showing the higher-magnification images from the red box. Notes: Uppercase letters indicate the day 1 images, lowercase letters indicate the day 3 images: (A, a), 5VZn surface cultured with CM; (B, b), 15VZn surface cultured with CM; (C, c), 25VZn surface cultured with CM; (D, d), 5V surface cultured with CM; (E, e), 15V surface cultured with CM; (F, f), 25V surface cultured with CM; (G, g), Ti. Abbreviations: SEM, scanning electron microscopy; CM, conditioned medium. |
Cytoskeleton actin and vinculin were observed by immunofluorescence staining on day 1 (Figure 14A–G) and day 3 (Figure 14a–g), with the relative vinculin intensity shown in Figure 14H. The cytoskeletal morphology data were consistent with the SEM data. In the Zn-loaded groups, the cells showed more actin filaments, followed by the TNT group, and finally the Ti group. Among the zinc-loaded groups, cells on the 15VZn substrate had the best performance, displaying more widely spread actin filaments than the other groups. At the same time, the relative immunofluorescence strength of vinculin showed that zinc and TNT had a synergistic effect on cell adhesion. The decreasing trend was 15VZn>25VZn>15V>5VZn>25V>5V>Ti. These results indicate that the 15VZn group revealed the best cell adhesion, which implies its superior cell communication ability.
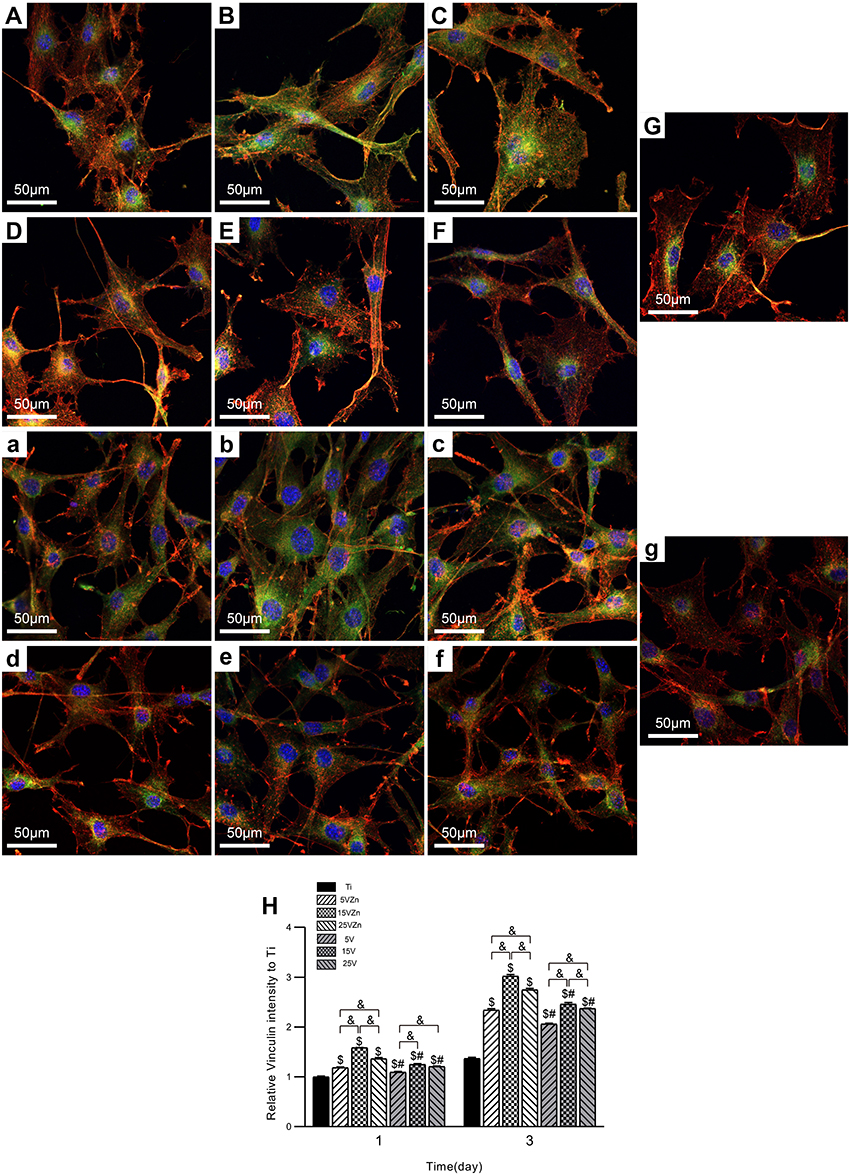 |
Figure 14 CLSM images of MC3T3-E1 cell morphology on different samples after culturing for 1 and 3 days (A–G, a–g); the quantitative analysis of immunofluorescence intensity of vinculin is also shown (H). Notes: Uppercase letters indicate the day 1 images, lowercase letters indicate the day 3 images: (A, a), 5VZn surface cultured with CM; (B, b), 15VZn surface cultured with CM; (C, c), 25VZn surface cultured with CM; (D, d), 5V surface cultured with CM; (E, e), 15V surface cultured with CM; (F, f), 25V surface cultured with CM; (G, g), Ti. (H) The relative immunofluorescence intensity of vinculin on different surfaces, compared to Ti. Data are expressed as the mean ± standard deviation (n=3). $Denotes the statistical significance between Ti and other groups. #Denotes the statistical significance between each Zn-incorporated TNT group and its TNT counterpart group. &Denotes the statistical significance between different labeled groups. ($P<0.05, #P<0.05, &P<0.05, ANOVA.) Abbreviations: CLSM, confocal laser scanning microscope; CM, conditioned medium. |
Osteogenic-Related Gene Expression
The transcriptional level of the osteogenic-related genes on day 7 and 14 is shown in Figure 15. Cells in the TNT groups showed a tendency of increased transcription levels of osteogenic-related genes compared with the pure Ti surface. Moreover, the 15VZn and 25VZn groups revealed obviously higher osteogenic gene expressions than the other groups, with the highest ALP, OPN and Runx-2 gene expressions in the 15VZn group and the highest levels of COL1a1 gene expression in the 25VZn group. These results suggested that, similar to previous reports,3,11,24 the TNT structure could increase osteogenic gene expression. More importantly, the addition of Zn on the TNT surface could gain additional osteogenic effect, with the 15VZn group displaying substantially superior osteogenic effect compared with the other Zn-loaded groups. Combined with the previous part, we found an interesting trend. The 15VZn group showed the strongest effects on promoting M2 pro-regenerative genes and cytokine expression, followed by the 25VZn and 5VZn groups. At the same time, the osteogenic-related gene expression levels displayed a similar trend, which decreased following the sequence of 15VZn, 25VZn and 5VZn. There is a dose-dependent relationship between M2 pro-regenerative genes and cytokine expression and osteogenic-related gene expression. In other words, among the zinc-loaded groups, the more obvious the effect on promoting M2 pro-regenerative gene and cytokine expression, the higher the osteogenic-related gene expression.
 |
Figure 15 Expression of osteogenic-related gene levels assayed by qPCR. Notes: Data are expressed as the mean ± standard deviation (n=3). $Denotes the statistical significance between Ti and other groups. #Denotes the statistical significance between each Zn-incorporated TNT group and its TNT counterpart group. &Denotes the statistical significance between different labeled groups. ($P<0.05, #P<0.05, &P<0.05, ANOVA.) Abbreviation: qPCR, quantitative real-time polymerase chain reaction. |
Alkaline Phosphatase Assay and Alizarin Red S Staining
The results of ALP expression in the cell supernatant are shown in Figure 16A, and the tendency was similar to the ALP gene expression level on day 7 and 14 shown in Figure 15. The ALP expression level of the 15VZn group showed significant superiority, followed by the 25VZn group. Compared with the Ti group, the TNT groups could promote more ALP secretion, but the effect was weaker than their Zn-loaded counterparts. In addition, the Alizarin red staining photographs (Figure 16B) and quantitative results (Figure 16C) both displayed that on the 21st day, osteoblast cells in the TNT groups all displayed increased extracellular mineralization compared with the Ti group. In addition, the Zn-loaded TNT groups all revealed higher calcium nodule formation than their TNT counterparts, with the 15VZn group displaying the best extracellular mineralization ability. These results suggest that the TNT structure could improve calcium nodule formation and the superimposed Zn may further promote such an effect. The superior extracellular mineralization ability of the 15VZn group may be attributed to the synergistic effect of Zn and nanotubes.
 |
Figure 16 ALP activity of MC3T3-E1 cells cultured in CM for 3, 5, 7 and 14 days (A); and images (B) and OD values (C) of extracellular mineralization of MC3T3-E1 cells cultured in CM for 21 days. The Ti group was used as control (cultured without CM). Notes: Data are expressed as the mean ± standard deviation (n=3). $Denotes the statistical significance between Ti and other groups. #Denotes the statistical significance between each Zn-incorporated TNT group and its TNT counterpart group. &Denotes the statistical significance between different labeled groups. ($P<0.05, #P<0.05, &P<0.05, ANOVA.) Abbreviations: ALP, alkaline phosphatase; CM, conditioned medium. |
Combined with the previous part, the most remarkable osteogenic ability of the 15VZn group was inseparable with its outstanding surface characteristics. The 15VZn group (with an average diameter of 70 nm) showed good surface topography to promote cell differentiation, moderate and stable release amounts of nano-scale Zn, a low level of cytotoxicity and superior ability to induce the osteoclast/osteogenesis balance developing into osteogenesis. 25VZn surface modification could also promote osteogenesis, but the effect was weaker than that of the 15VZn group. This may be related to its smaller Zn release amount and slightly larger diameter. The ability of 5VZn to promote osteogenesis was the weakest, which may be related to its increased release peaks of Zn around day 3–5 and day 6–7. As previously discussed, the Zn release amount can promote osteogenesis and activate the macrophages. Besides, ZnO nanoparticles serve as the source of Zn ions and also play an important role in the bone formation process. ZnO nanoparticles, well-accepted bacteriostatic reagents78,79 to effectively inhibit the occurrence of peri-implantitis, maintained the stability of the immune osteogenesis microenvironment in this study. In the future, we will further conduct in vivo experiments to validate the in vitro findings.
Conclusion
In the current work, the Zn-incorporated TNT surface was established, allowing Zn to be continuously released for at least 3 weeks in a controlled manner. To evaluate the performance of the Zn-loaded TNT surface on osteogenesis, an osteogenic microenvironment model consisting of biomaterial–macrophage–osteoblast was created in accordance with the OIM principle by CM. Based on the results, Zn-loaded TNT surfaces with a suitable diameter (15VZn group) could release cytokines through macrophages to act on osteoblasts, thereby inducing the osteoclast/osteogenesis balance developing toward osteogenesis. In addition, the 15VZn group could also promote cell adhesion and proliferation, increase the transcription level of osteogenesis-related genes, improve the early osteogenic differentiation and promote extracellular matrix mineralization of osteoblasts. In summary, our study suggested that the Zn-incorporated TNT surface may activate the immunomodulatory function of macrophages, which could create an osteogenic microenvironment. The established osteogenic microenvironment could further enhance the osteogenic ability of osteoblast cells and accelerate the process of bone binding with implant materials. It provided a promising strategy of Ti surface modification for better application prospects.
Acknowledgments
We sincerely acknowledge Professor Baoe Li and Dr Xianrui Zou from the School of Materials Science and Engineering, Hebei University of Technology, for their precious help in manuscript review and technical support. We also thank Huanhuan Zhai from Tianjin Institute of Industrial Biotechnology, Chinese Academy of Sciences, for her important work in preparing SEM images. This study was supported by grants from the National Natural Science Foundation of China (No 81870809, 81500886, 31470920); the Natural Science Foundation of Tianjin City of China (No 16JCYBJC28700); the Science & Technology Development Fund of Tianjin Education Commission for Higher Education (No 2017KJ220); and the Science & Technology Development Fund of Tianjin Medical University Stomatological Hospital (2015YKYQ02).
Disclosure
The authors report no conflicts of interest in this work.
References
1. Bandyopadhyay A, Shivaram A, Tarafder S, Sahasrabudhe H, Banerjee D, Bose S. In vivo response of laser processed porous titanium implants for load-bearing implants. Ann Biomed Eng. 2017;45(1):249–260. doi:10.1007/s10439-016-1673-8
2. Neoh KG, Hu X, Zheng D, Kang ET. Balancing osteoblast functions and bacterial adhesion on functionalized titanium surfaces. Biomaterials. 2012;33(10):2813–2822. doi:10.1016/j.biomaterials.2012.01.018
3. Ma A, Shang H, Song Y, et al. Icariin-functionalized coating on TiO2 nanotubes surface to improve osteoblast activity in vitro and osteogenesis ability in vivo. Coatings. 2019;9(5):327. doi:10.3390/coatings9050327
4. Wang C, Wang S, Yang Y, et al. Bioinspired, biocompatible and peptide-decorated silk fibroin coatings for enhanced osteogenesis of bioinert implant. J Biomater Sci Polym Ed. 2018;29(13):1595–1611. doi:10.1080/09205063.2018.1477316
5. Moon JJ, Huang B, Irvine DJ. Engineering nano- and microparticles to tune immunity. Adv Mater. 2012;24(28):3724–3746. doi:10.1002/adma.v24.28
6. Jones JA, Chang DT, Meyerson H, et al. Proteomic analysis and quantification of cytokines and chemokines from biomaterial surface-adherent macrophages and foreign body giant cells. J Biomed Mater Res A. 2007;83(3):585–596. doi:10.1002/jbm.a.31221
7. Hachim D, LoPresti ST, Yates CC, Brown BN. Shifts in macrophage phenotype at the biomaterial interface via IL-4 eluting coatings are associated with improved implant integration. Biomaterials. 2017;112:95–107. doi:10.1016/j.biomaterials.2016.10.019
8. Nyangoga H, Aguado E, Goyenvalle E, Baslé MF, Chappard D. A non-steroidal anti-inflammatory drug (ketoprofen) does not delay beta-TCP bone graft healing. Acta Biomater. 2010;6(8):3310–3317. doi:10.1016/j.actbio.2010.01.042
9. Son JS, Kim SG, Oh JS, et al. Hydroxyapatite/polylactide biphasic combination scaffold loaded with dexamethasone for bone regeneration. J Biomed Mater Res A. 2011;99(4):638–647. doi:10.1002/jbm.a.33223
10. Wu C, Chen Z, Yi D, Chang J, Xiao Y. Multidirectional effects of Sr-, Mg-, and Si-containing bioceramic coatings with high bonding strength on inflammation, osteoclastogenesis, and osteogenesis. ACS Appl Mater Interfaces. 2014;6(6):4264–4276. doi:10.1021/am4060035
11. Zhang R, Liu X, Xiong Z, et al. The immunomodulatory effects of Zn-incorporated micro/nanostructured coating in inducing osteogenesis. Artif Cells Nanomed Biotechnol. 2018;46(sup1):1123–1130. doi:10.1080/21691401.2018.1446442
12. Zhang W, Lu X, Yuan Z, et al. Establishing an osteoimmunomodulatory coating loaded with aspirin on the surface of titanium primed with phase-transited lysozyme. Int J Nanomedicine. 2019;14:977–991. doi:10.2147/IJN.S190766
13. Chen Z, Visalakshan RM, Guo J, et al. Plasma deposited poly-oxazoline nanotextured surfaces dictate osteoimmunomodulation towards ameliorative osteogenesis. Acta Biomater. 2019;96:568–581. doi:10.1016/j.actbio.2019.06.058
14. Sadowska JM, Wei F, Guo J, et al. The effect of biomimetic calcium deficient hydroxyapatite and sintered beta-tricalcium phosphate on osteoimmune reaction and osteogenesis. Acta Biomater. 2019;96:605–618. doi:10.1016/j.actbio.2019.06.057
15. Wei F, Li Z, Crawford R, Xiao Y, Zhou Y. Immunoregulatory role of exosomes derived from differentiating mesenchymal stromal cells on inflammation and osteogenesis. J Tissue Eng Regen Med. 2019;13(11):1978–1991. doi:10.1002/term.v13.11
16. Milleret V, Tugulu S, Schlottig F, Hall H. Alkali treatment of microrough titanium surfaces affects macrophage/monocyte adhesion, platelet activation and architecture of blood clot formation. Eur Cell Mater. 2011;21:
17. Sun SJ, Yu WQ, Zhang YL, Jiang XQ, Zhang FQ. Effects of TiO2 nanotube layers on RAW 264.7 macrophage behaviour and bone morphogenetic protein-2 expression. Cell Prolif. 2013;46(6):685–694. doi:10.1111/cpr.2013.46.issue-6
18. Rajyalakshmi A, Ercan B, Balasubramanian K, Webster TJ. Reduced adhesion of macrophages on anodized titanium with select nanotube surface features. Int J Nanomedicine. 2011;6:1765–1771. doi:10.2147/IJN.S22763
19. Hotchkiss KM, Reddy GB, Hyzy SL, Schwartz Z, Boyan BD, Olivares-navarrete R. Titanium surface characteristics, including topography and wettability, alter macrophage activation. Acta Biomater. 2016;31:425–434. doi:10.1016/j.actbio.2015.12.003
20. Franz S, Rammelt S, Scharnweber D, Simon JC. Immune responses to implants - a review of the implications for the design of immunomodulatory biomaterials. Biomaterials. 2011;32(28):6692–6709. doi:10.1016/j.biomaterials.2011.05.078
21. Kobayashi SD, Voyich JM, Burlak C, DeLeo FR. Neutrophils in the innate immune response. Arch Immunol Ther Exp (Warsz). 2005;53(6):505–517.
22. Anderson JM, Rodriguez A, Chang DT. Foreign body reaction to biomaterials. Semin Immunol. 2008;20(2):86–100. doi:10.1016/j.smim.2007.11.004
23. Chen Z, Klein T, Murray RZ, et al. Osteoimmunomodulation for the development of advanced bone biomaterials. Mater Today. 2016;19(6):304–321. doi:10.1016/j.mattod.2015.11.004
24. Liu W, Su P, Gonzales A
25. Wang J, Meng F, Song W, et al. Nanostructured titanium regulates osseointegration via influencing macrophage polarization in the osteogenic environment. Int J Nanomedicine. 2018;13:4029–4043. doi:10.2147/IJN.S163956
26. Chen M, Hu Y, Li M, et al. Regulation of osteoblast differentiation by osteocytes cultured on sclerostin antibody conjugated TiO nanotube array. Colloids Surf B Biointerfaces. 2019;175:663–670. doi:10.1016/j.colsurfb.2018.12.023
27. Bandyopadhyay A, Shivaram A, Mitra I, Bose S. Electrically polarized TiO nanotubes on Ti implants to enhance early-stage osseointegration. Acta Biomater. 2019;96:686–693. doi:10.1016/j.actbio.2019.07.028
28. Li T, Li XL, Hu SX, Wu J. Enhanced osteoporotic effect of silicon carbide nanoparticles combine with nano-hydroxyapatite coated anodized titanium implant on healthy bone regeneration in femoral fracture. J Photochem Photobiol B Biol. 2019;197:111515. doi:10.1016/j.jphotobiol.2019.111515
29. Li Y, Song Y, Ma A, Li C. Surface immobilization of TiO nanotubes with bone morphogenetic protein-2 synergistically enhances initial preosteoblast adhesion and osseointegration. Biomed Res Int. 2019;2019:5697250.
30. Yu W, Qian C, Jiang X, Zhang F, Weng W. Mechanisms of stem cell osteogenic differentiation on TiO2 nanotubes. Colloids Surf B Biointerfaces. 2015;136:779–785. doi:10.1016/j.colsurfb.2015.10.019
31. Li B, Ma J, Wang D, et al. Self-adjusting antibacterial properties of Ag-incorporated nanotubes on micro-nanostructured Ti surfaces. Biomater Sci. 2019;7(10):4075–4087. doi:10.1039/C9BM00862D
32. Gao X, Topping VD, Keltner Z, Sprando RL, Yourick JJ. Toxicity of nano- and ionic silver to embryonic stem cells: a comparative toxicogenomic study. J Nanobiotechnology. 2017;15(1):31. doi:10.1186/s12951-017-0265-6
33. Apostolova MD, Ivanova IA, Cherian MG. Signal transduction pathways, and nuclear translocation of zinc and metallothionein during differentiation of myoblasts. Biochem Cell Biol. 2000;78(1):27. doi:10.1139/o99-070
34. Beyersmann D, Haase H. Functions of zinc in signaling, proliferation and differentiation of mammalian cells. Biometals. 2001;14(3–4):331–341. doi:10.1023/A:1012905406548
35. Bonaventura P, Benedetti G, Albarède F, Miossec P. Zinc and its role in immunity and inflammation. Autoimmun Rev. 2015;14(4):277–285. doi:10.1016/j.autrev.2014.11.008
36. Kim JT, Baek SH, Lee SH, et al. Zinc-deficient diet decreases fetal long bone growth through decreased bone matrix formation in mice. J Med Food. 2009;12(1):118–123. doi:10.1089/jmf.2007.0647
37. Arakawa T, Philo JS, Kita Y. Kinetic and thermodynamic analysis of thermal unfolding of recombinant erythropoietin. Biosci Biotechnol Biochem. 2001;65(6):1321–1327. doi:10.1271/bbb.65.1321
38. Hönscheid A, Dubben S, Rink L, Haase H. Zinc differentially regulates mitogen-activated protein kinases in human T cells ☆. J Nutr Biochem. 2012;23(1):18–26. doi:10.1016/j.jnutbio.2010.10.007
39. Gammoh NZ, Rink L. Zinc in infection and inflammation. Nutrients. 2017;9(6):E624.
40. Gruber K, Maywald M, Rosenkranz E, Haase H, Plumakers B, Rink L. Zinc deficiency adversely influences interleukin-4 and interleukin-6 signaling. J Biol Regul Homeost Agents. 2013;27(3):661.
41. Grandjean-laquerriere A, Laquerriere P, Jallot E, et al. Influence of the zinc concentration of sol-gel derived zinc substituted hydroxyapatite on cytokine production by human monocytes in vitro. Biomaterials. 2006;27(17):3195–3200. doi:10.1016/j.biomaterials.2006.01.024
42. Velard F, Braux J, Amedee J, Laquerriere P. Inflammatory cell response to calcium phosphate biomaterial particles: an overview. Acta Biomater. 2013;9(2):4956–4963. doi:10.1016/j.actbio.2012.09.035
43. Aguirre R, Echeverry-rendón M, Quintero D, et al. Formation of nanotubular TiO structures with varied surface characteristics for biomaterial applications. J Biomed Mater Res Part A. 2018;106(5):1341–1354. doi:10.1002/jbm.a.36331
44. Khudhair D, Bhatti A, Li Y, et al. Anodization parameters influencing the morphology and electrical properties of TiO2 nanotubes for living cell interfacing and investigations. Mater Sci Eng C. 2016;59:1125–1142. doi:10.1016/j.msec.2015.10.042
45. Huo K, Zhang X, Wang H, Zhao L, Liu X, Chu PK. Osteogenic activity and antibacterial effects on titanium surfaces modified with Zn-incorporated nanotube arrays. Biomaterials. 2013;34(13):3467–3478. doi:10.1016/j.biomaterials.2013.01.071
46. Dobrovolskaia MA, McNeil SE. Immunological properties of engineered nanomaterials. Nat Nanotechnol. 2007;2(8):469–478. doi:10.1038/nnano.2007.223
47. Nel AE, Mädler L, Velegol D, et al. Understanding biophysicochemical interactions at the nano–bio interface. Nat Mater. 2009;8:543. doi:10.1038/nmat2442
48. Oh WK, Kim S, Choi M, et al. Cellular uptake, cytotoxicity, and innate immune response of silica-titania hollow nanoparticles based on size and surface functionality. ACS Nano. 2010;4(9):5301–5313. doi:10.1021/nn100561e
49. Yu H, Huang X, Yang X, et al. Synthesis and biological properties of Zn-incorporated micro/nano-textured surface on Ti by high current anodization. Mater Sci Eng C. 2017;78:175–184. doi:10.1016/j.msec.2017.04.063
50. Grotberg J, Hamlekhan A, Butt A, et al. Thermally oxidized titania nanotubes enhance the corrosion resistance of Ti6Al4V. Mater Sci Eng C. 2016;59:677–689. doi:10.1016/j.msec.2015.10.056
51. Zhao X, Wang T, Qian S, Liu X, Sun J, Li B. Silicon-doped titanium dioxide nanotubes promoted bone formation on titanium implants. Int J Mol Sci. 2016;17(3):292. doi:10.3390/ijms17030292
52. Bjursten LM, Rasmusson L, Oh S, Smith GC, Brammer KS, Jin S. Titanium dioxide nanotubes enhance bone bonding in vivo. J Biomed Mater Res Part A. 2010;92(3):1218–1224. doi:10.1002/jbm.a.32463
53. Hu D, Li K, Xie Y, et al. Different response of osteoblastic cells to Mg(2+), Zn(2+) and Sr(2+) doped calcium silicate coatings. J Mater Sci Mater Med. 2016;27(3):56. doi:10.1007/s10856-016-5672-y
54. Suh KS, Lee YS, Seo SH, Kim YS, Choi EM. Effect of zinc oxide nanoparticles on the function of MC3T3-E1 osteoblastic cells. Biol Trace Elem Res. 2013;155(2):287–294. doi:10.1007/s12011-013-9772-y
55. Xiao S, Wang M, Wang L, Zhu Y. Environment-friendly synthesis of trace element Zn, Sr, and F codoping hydroxyapatite with non-cytotoxicity and improved osteoblast proliferation and differentiation. Biol Trace Elem Res. 2018;185(1):148–161. doi:10.1007/s12011-017-1226-5
56. Zhang X, Wang J, Wu J, et al. Dimethyloxalylglycine improves angiogenesis of ZIF-8-coated implant. J Biomater Appl. 2019;34:396–407.
57. Zaveri TD, Dolgova NV, Chu BH, et al. Contributions of surface topography and cytotoxicity to the macrophage response to zinc oxide nanorods. Biomaterials. 2010;31(11):2999–3007. doi:10.1016/j.biomaterials.2009.12.055
58. Kalfas HI. Principles of bone healing. Neurosurg Focus. 2001;10(4):1–4. doi:10.3171/foc.2001.10.4.2
59. Underhill DM. Mechanisms of phagocytosis in macrophages. Annu Rev Immunol. 1999;17(1):593–623. doi:10.1146/annurev.immunol.17.1.593
60. Bai L, Liu Y, Zhang X, et al. Favorable manipulation of macrophage/endothelial cell functionality and their cross-talk on silicon-doped titania nanotube arrays. Nanoscale. 2019;11(13):5920–5931. doi:10.1039/C8NR08381A
61. Shen X, Yu Y, Ma P, et al. Titania nanotubes promote osteogenesis via mediating crosstalk between macrophages and MSCs under oxidative stress. Colloids Surf B Biointerfaces. 2019;180:39–48. doi:10.1016/j.colsurfb.2019.04.033
62. Yin X, Li Y, Yang C, et al. Alginate/chitosan multilayer films coated on IL-4-loaded TiO nanotubes for modulation of macrophage phenotype. Int J Biol Macromol. 2019;132:495–505. doi:10.1016/j.ijbiomac.2019.03.184
63. Mantovani A, Biswas SK, Galdiero MR, Sica A, Locati M. Macrophage plasticity and polarization in tissue repair and remodelling. J Pathol. 2013;229(2):176–185. doi:10.1002/path.4133
64. Chen J, Li M, Yang C, et al. Macrophage phenotype switch by sequential action of immunomodulatory cytokines from hydrogel layers on titania nanotubes. Colloids Surf B Biointerfaces. 2018;163:336–345. doi:10.1016/j.colsurfb.2018.01.007
65. Horwood NJ. Macrophage polarization and bone formation: a review. Clin Rev Allergy Immunol. 2016;51(1):79–86. doi:10.1007/s12016-015-8519-2
66. Mosser DM, Edwards JP. Exploring the full spectrum of macrophage activation. Nat Rev Immunol. 2008;8(12):958–969. doi:10.1038/nri2448
67. Ding J, Ghali O, Lencel P, et al. TNF-alpha and IL-1beta inhibit RUNX2 and collagen expression but increase alkaline phosphatase activity and mineralization in human mesenchymal stem cells. Life Sci. 2009;84(15–16):499–504. doi:10.1016/j.lfs.2009.01.013
68. Hess K, Ushmorov A, Fiedler J, Brenner RE, Wirth T. TNFalpha promotes osteogenic differentiation of human mesenchymal stem cells by triggering the NF-kappaB signaling pathway. Bone. 2009;45(2):367–376. doi:10.1016/j.bone.2009.04.252
69. Yang X, Ricciardi BF, Hernandez-soria A, Shi Y, Pleshko Camacho N, Bostrom MP. Callus mineralization and maturation are delayed during fracture healing in interleukin-6 knockout mice. Bone. 2007;41(6):928–936. doi:10.1016/j.bone.2007.07.022
70. Freytes DO, Kang JW, Marcos-campos I, Vunjak-novakovic G. Macrophages modulate the viability and growth of human mesenchymal stem cells. J Cell Biochem. 2013;114(1):220–229. doi:10.1002/jcb.v114.1
71. Kang H, Yan Y, Jia P, et al. Desferrioxamine reduces ultrahigh-molecular-weight polyethylene-induced osteolysis by restraining inflammatory osteoclastogenesis via heme oxygenase-1. Cell Death Dis. 2016;7(10):e2435. doi:10.1038/cddis.2016.339
72. Yamaguchi Y, Kanzaki H, Katsumata Y, et al. Dimethyl fumarate inhibits osteoclasts via attenuation of reactive oxygen species signalling by augmented antioxidation. J Cell Mol Med. 2018;22(2):1138–1147. doi:10.1111/jcmm.13367
73. Yang L, Shen ZY, Wang RR, et al. Effects of heme oxygenase-1-modified bone marrow mesenchymal stem cells on microcirculation and energy metabolism following liver transplantation. World J Gastroenterol. 2017;23(19):3449–3467. doi:10.3748/wjg.v23.i19.3449
74. Paul NE, Skazik C, Harwardt M, et al. Topographical control of human macrophages by a regularly microstructured polyvinylidene fluoride surface. Biomaterials. 2008;29(30):4056–4064. doi:10.1016/j.biomaterials.2008.07.010
75. Smith BS, Capellato P, Kelley S, Gonzalez-juarrero M, Popat KC. Reduced in vitro immune response on titania nanotube arrays compared to titanium surface. Biomaterialsence. 2013;1(3):322–332.
76. Chen Z, Yuen J, Crawford R, Chang J, Wu C, Xiao Y. The effect of osteoimmunomodulation on the osteogenic effects of cobalt incorporated β-tricalcium phosphate. Biomaterials. 2015;61:126–138. doi:10.1016/j.biomaterials.2015.04.044
77. Malekshah AK, Moghaddam AE, Daraka SM. Comparison of conditioned medium and direct co-culture of human granulosa cells on mouse embryo development. Indian J Exp Biol. 2006;44(3):189–192.
78. Lallo da Silva B, Caetano BL, Chiari-andréo BG, Pietro RCLR, Chiavacci LA. Increased antibacterial activity of ZnO nanoparticles: influence of size and surface modification. Colloids Surf B Biointerfaces. 2019;177(440–447). doi:10.1016/j.colsurfb.2019.02.013
79. Bai X, Li L, Liu H, Tan L, Liu T, Meng X. Solvothermal synthesis of ZnO nanoparticles and anti-infection application in vivo. ACS Appl Mater Interfaces. 2015;7(2):1308–1317. doi:10.1021/am507532p
 © 2020 The Author(s). This work is published and licensed by Dove Medical Press Limited. The
full terms of this license are available at https://www.dovepress.com/terms
and incorporate the Creative Commons Attribution
- Non Commercial (unported, 3.0) License.
By accessing the work you hereby accept the Terms. Non-commercial uses of the work are permitted
without any further permission from Dove Medical Press Limited, provided the work is properly
attributed. For permission for commercial use of this work, please see paragraphs 4.2 and 5 of our Terms.
© 2020 The Author(s). This work is published and licensed by Dove Medical Press Limited. The
full terms of this license are available at https://www.dovepress.com/terms
and incorporate the Creative Commons Attribution
- Non Commercial (unported, 3.0) License.
By accessing the work you hereby accept the Terms. Non-commercial uses of the work are permitted
without any further permission from Dove Medical Press Limited, provided the work is properly
attributed. For permission for commercial use of this work, please see paragraphs 4.2 and 5 of our Terms.