Back to Journals » Risk Management and Healthcare Policy » Volume 19
Why Do Stunting Interventions Remain Unequal in Urban Areas? A Multivariate Analysis of Subdistrict Risk Profiles in Cirebon City, Indonesia
Authors Saliaputri L ![]() , Ginanjar I, Handoko B
, Ginanjar I, Handoko B
Received 9 January 2026
Accepted for publication 7 May 2026
Published 20 May 2026 Volume 2026:19 594491
DOI https://doi.org/10.2147/RMHP.S594491
Checked for plagiarism Yes
Review by Single anonymous peer review
Peer reviewer comments 2
Editor who approved publication: Professor Mecit Can Emre Simsekler
Leivina Saliaputri, Irlandia Ginanjar, Budhi Handoko
Department of Statistics, Faculty of Mathematics and Natural Sciences, Universitas Padjadjaran, Sumedang, West Java, Indonesia
Correspondence: Irlandia Ginanjar, Department of Statistics, Faculty of Mathematics and Natural Sciences, Universitas Padjadjaran, Jl. Raya Bandung–Sumedang Km. 21, Hegarmanah, Jatinangor, Sumedang, 45363, Indonesia, Email [email protected]
Purpose: Childhood stunting remains a persistent human development barrier in Indonesia. While national prevalence has declined to 19.8% as of 2024, aggregate data frequently mask profound micro-level disparities that threaten the 14% national target. A critical research gap exists in meso-level diagnostics; traditional monitoring evaluates indicators in silos, failing to capture the systemic convergence of interventions. We selected four principal indicators, namely Health Insurance (PBI-JKN), Food Assistance (BPNT), Iron Supplementation, and Unmet Contraceptive Need, as they represent the essential intersection of social protection and reproductive health required for effective prevention. This study addresses the problem of localized systemic risk, where standardized city-wide policies fail to reach “red zones” within urban villages. Our objective was to quantify subdistrict-level inequality and identify specific performance typologies across 22 subdistricts in Cirebon City.
Patients and Methods: We conducted a retrospective, cross-sectional analysis of 2023 administrative data. ANOVA-Simultaneous Component Analysis (ASCA) with 1000 permutations was used to decompose variance, followed by SVD-based biplot visualization to map the multivariate performance landscape.
Results: The subdistrict effect was statistically significant (), with the first two components capturing 92.99% of total variance. Biplot analysis distinguished between “access-lagging” facing structural deficits in social protection and “compliance-lagging” clusters hampered by behavioral and service-outreach gaps.
Conclusion: Urban stunting risk is not monolithic; geography remains a decisive determinant of intervention coverage. This study contributes to the precision public health paradigm by providing a diagnostic framework that enables local governments to move beyond one-size-fits-all models. By identifying neighborhood-specific vulnerabilities, including administrative exclusion and behavioral barriers, policymakers can implement targeted, risk-informed governance to ensure more equitable health outcomes.
Plain Language Summary: Stunting is a significant health issue that affects a child’s ability to grow and reach their full potential. In Indonesia, national averages often hide the fact that some neighborhoods receive much more support than others. This study was done to find these hidden gaps so that local leaders can provide better, more targeted help to every family. The researchers looked at 22 neighborhoods in Cirebon City to see how well four key programs were reaching the community. These programs include health insurance for vulnerable families, food assistance, iron supplements for women planning to marry, and family planning services. Instead of looking at these programs one by one, the study used a modern analytical tool to see how all these services work together in each specific area. The results show that each neighborhood has its own unique strengths and needs. For example, some areas are very successful at providing food aid but need more support with health supplements. Other neighborhoods have the opposite situation. This means that a “one-size-fits-all” approach is not the best way to help children. These findings are a valuable resource for city officials. By understanding the specific needs of each neighborhood, they can now move away from general plans and instead create “precision” solutions. This approach ensures that resources go exactly where they are needed most, helping more families benefit from health services and ensuring a healthier future for all children in the city.
Keywords: stunting interventions, health inequality, multivariate analysis, ASCA, principal component analysis, local health policy, Indonesia
Introduction
Childhood stunting, a condition characterized by a height-for-age z-score (HAZ) more than two standard deviations below the World Health Organization (WHO) Child Growth Standards median, represents one of the most persistent barriers to human development in the Global South.1–3 It is not merely a measure of linear growth retardation but a “stunting syndrome” characterized by multiple pathological changes resulting from chronic nutrient deprivation, repeated infections, and inadequate psychosocial stimulation.4–7 The implications extend far beyond physical stature; stunting is robustly associated with delayed cognitive development and diminished economic productivity in adulthood.8 Furthermore, early-life growth restriction predisposes individuals to a higher risk of non-communicable diseases (NCDs) later in life, reinforcing an intergenerational cycle of poverty that is difficult to break.9,10 Consequently, stunting reduction is a central tenet of the Sustainable Development Goals (SDGs), specifically Target 2.2, which aims to end all forms of malnutrition by 2030.11
The 2025 Joint Child Malnutrition Estimates (JME) released by UNICEF, WHO, and the World Bank indicate that approximately 150.2 million children worldwide remain stunted.12 Although this represents a decline from 1990 levels, progress has stagnated in the post-pandemic period, particularly in many Low- and Middle-Income Countries (LMICs).13 Global research highlights a growing “urban paradox” in LMICs: while urban areas generally show better aggregate health outcomes, rapid urbanization has created significant intra-urban inequalities. In these settings, children in “hidden cities” or informal settlements often exhibit stunting prevalence rates that rival or exceed those found in rural areas, driven by overcrowding, poor environmental sanitation, and limited access to quality healthcare.14 This suggests that national-level data frequently mask significant sub-national disparities, necessitating a shift toward micro-level policy diagnostics.15
Indonesia continues to experience a high prevalence of stunting. According to the 2024 Indonesian Nutritional Status Survey (SSGI), the national prevalence declined to 19.8%, moving below the WHO “high” public health threshold for the first time. In response, the government issued Presidential Regulation No. 72 of 2021, a multi-sectoral strategy aiming to reduce prevalence to 14% by 2024.16–18 This policy relies on “convergence”, defined as the simultaneous delivery of nutrition-specific and nutrition-sensitive interventions. While this multisectoral approach is theoretically robust, its implementation remains contested. Proponents argue that it is essential for addressing the distal determinants of stunting, whereas critics warn that it risks becoming a “tick-box” bureaucratic exercise that prioritizes administrative compliance over meaningful community engagement.
At the operational level, several components exhibit suboptimal performance. The Health Insurance scheme (PBI-JKN), intended to remove financial barriers to care, is often constrained by administrative rigidity. The Food Assistance program (BPNT), designed to improve household nutrition, is prone to targeting errors. Iron supplementation for prospective brides, aimed at improving preconception nutritional status, suffers from low compliance due to sensory aversion and persistent social misconceptions. Meanwhile, efforts to address unmet need for contraception remain limited, particularly among urban working women who face significant time constraints in accessing services.
These implementation gaps are further exacerbated by regional characteristics. Coastal urban centers like Cirebon face a “triple burden”: high population density, environmental risks such as tidal flooding (rob), and seasonal income volatility among fishing communities. Indonesia’s decentralized governance structure amplifies these challenges, as authority is devolved to local governments with varying capacities.19 This creates a “decentralization paradox”, where aggregate city data mask profound micro-level inequality. For instance, a city may report moderate progress while concealing “red zones”, defined as marginalized subdistricts where intervention coverage remains critically low.20,21
From a risk management perspective, this masked inequality represents a failure to identify and protect vulnerable populations. Therefore, there is an urgent need for analytical tools that can peer beneath the aggregate surface and quantify performance disparities at the specific unit of implementation: the subdistrict or village. Despite the mandate for convergence, there is a distinct research gap regarding multivariate performance analysis at the meso-level. This study aims to address systemic implementation failure and the increasing vulnerability of specific sub-urban groups rather than assessing individual clinical outcomes. By identifying distinct risk typologies through four principal indicators, this research contributes to the development of precision public health strategies for targeted urban governance.22,23
Materials and Methods
Methodological Rationale and Study Design
Evaluating the performance of convergent policies like Presidential Regulation No. 72 of 2021 requires multivariate methods capable of analyzing multiple indicators simultaneously. This study employs ANOVA-Simultaneous Component Analysis (ASCA), a method originally developed in chemometrics to decompose variance in complex experimental designs.24–28 ASCA is uniquely suited for health systems research because it mathematically separates the variation attributable to administrative units (the “Subdistrict Effect”) from residual noise.24–28 This separation is crucial for risk management; if the subdistrict effect is significant, it proves that inequalities are structural and systemic, rather than accidental, thereby mandating a specific governance response. To translate these complex data into actionable insights for local planners, we utilize SVD-based biplots derived from Principal Component Analysis (PCA) to map subdistricts and indicators in a common geometric space, identifying specific service-delivery failure modes.29
The study was designed as a quantitative, descriptive-exploratory evaluation of public health policy implementation at the meso-level (subdistrict). This study contributes to the literature on Risk Management and Healthcare Policy by demonstrating how advanced multivariate techniques can be repurposed to support “precision public health”, enabling local governments to transition from blanket interventions to targeted, data-driven strategies that directly address the inequalities hindering the achievement of the SDGs.
Research Objectives
This research focuses on Cirebon City, a strategic urban center on the north coast of Java, Indonesia, characterized by high density and heterogeneous service delivery. The study aims to:
- Quantify Inequality: Determine the magnitude of disparity in intervention coverage across 22 subdistricts.
- Test Significance: Apply the ASCA permutation test to assess if performance differences are statistically significant.
- Map Risk: Construct biplots to identify typologies of success and failure to inform targeted policy responses.
Data Collection And Analysis
Data Source and Timeframe
This study utilizes secondary administrative data from the 2023 fiscal year, compiled by the Regional Development Planning, Research, and Innovation Agency of Cirebon City. The dataset captures the performance of stunting convergence actions across all 22 subdistricts. All variables are continuous, expressed as percentages ranging from 0 to 100, forming a data matrix  of dimensions
  .
.
Variable Justification
The selection of indicators is strictly aligned with the convergence mandate of Perpres 72/2021, targeting the preconception and reproductive phases as a form of “upstream” risk management. The four indicators represent a strategic mix of “sensitive” (social protection) and “specific” (health sector) interventions, as presented in Table 1.
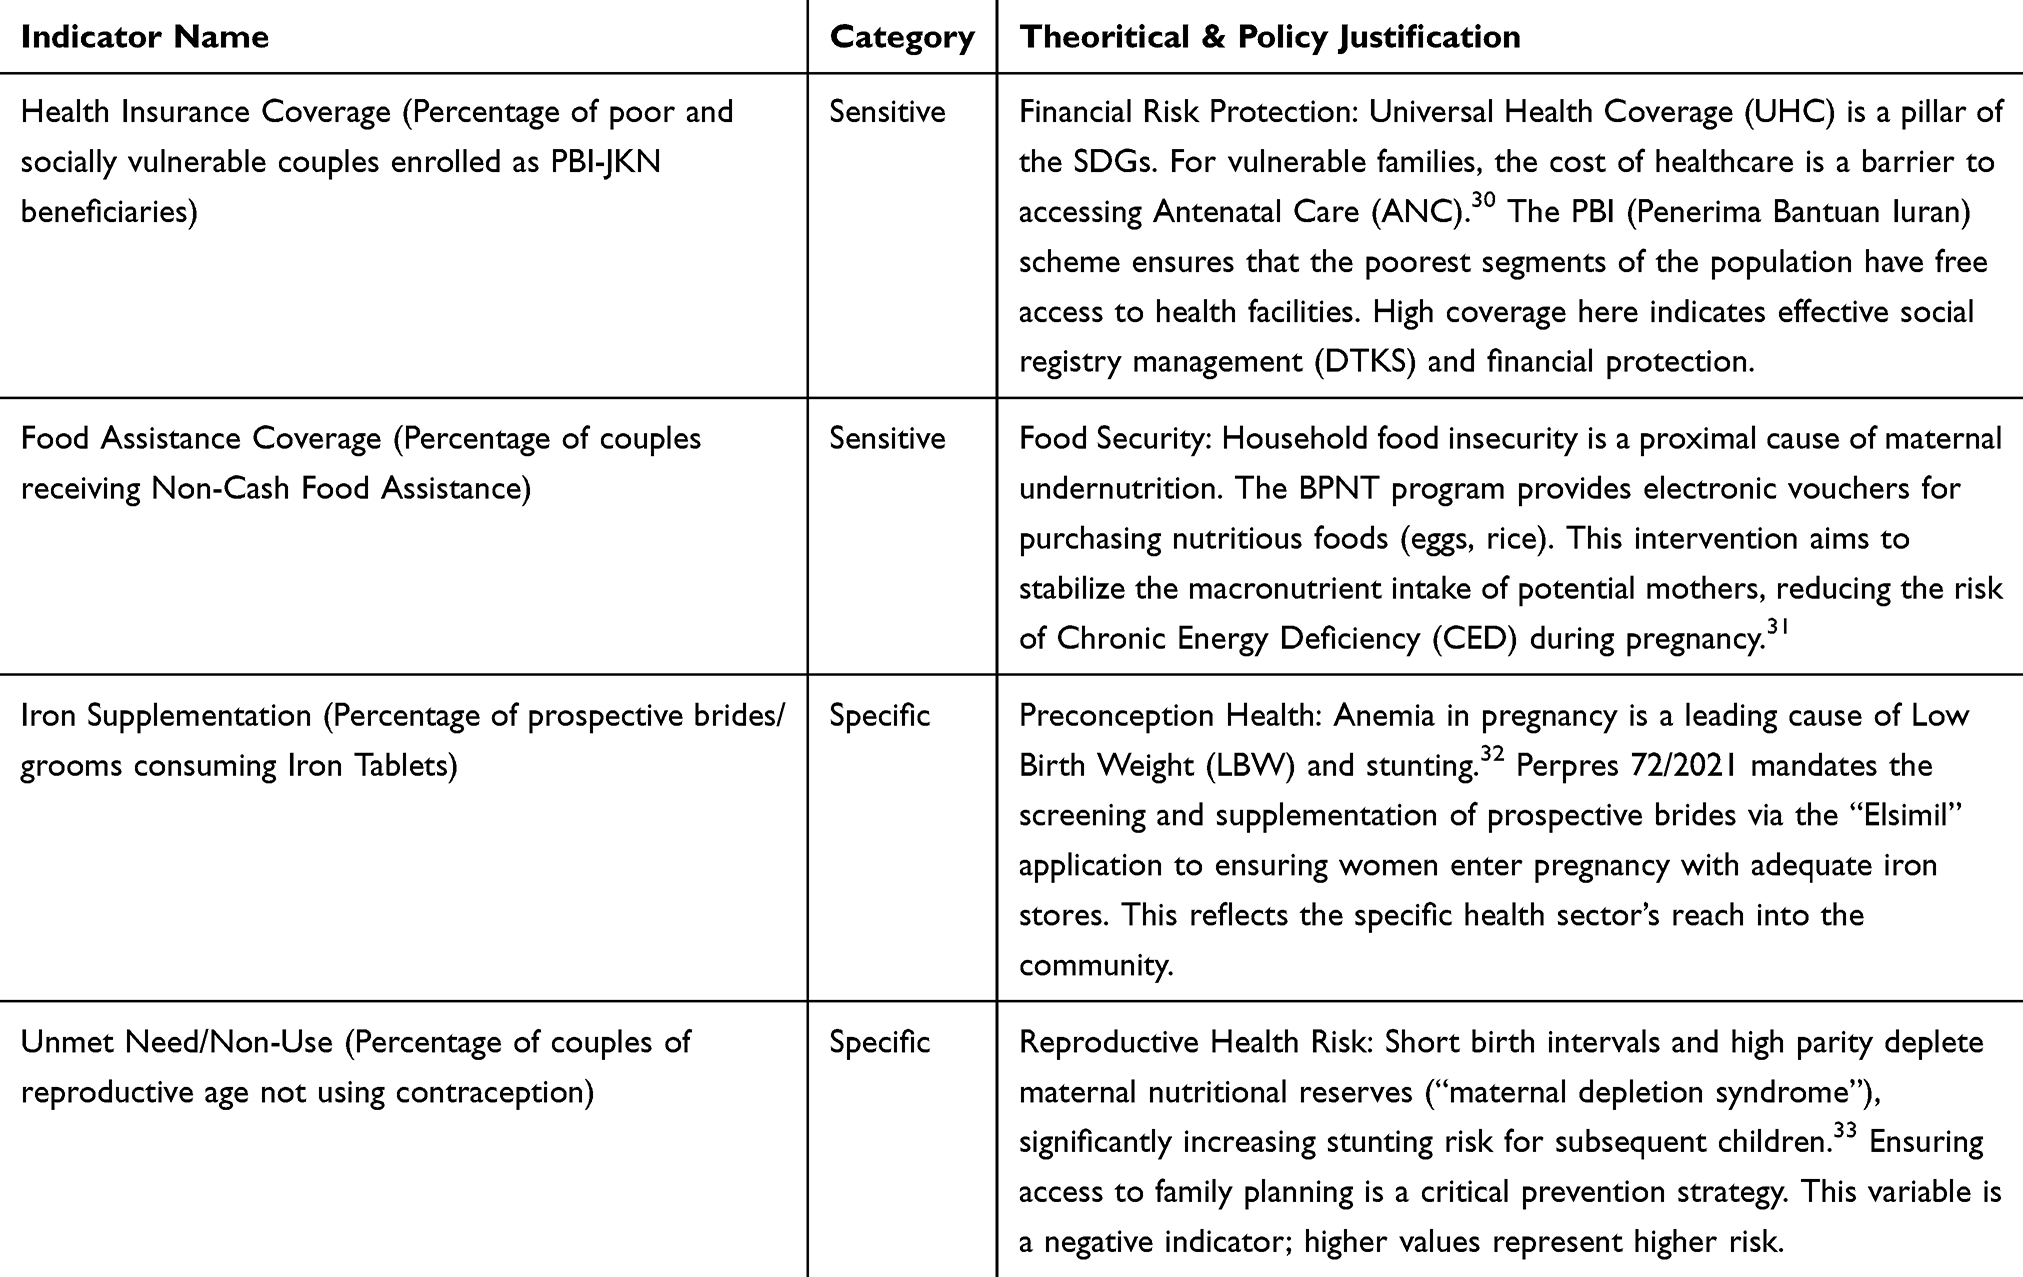 |
Table 1 Selected Indicators for Stunting Prevention Among Couples of Reproductive Age |
Data Preprocessing
The data matrix  was column-centered. Centering involves subtracting the city-wide mean from each variable. The calculation method is as follows:
 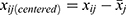 . This transformation removes the offset (the average performance level) and focuses the analysis purely on the variation or disparity between subdistricts.
ANOVA-Simultaneous Component Analysis (ASCA)
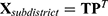
ASCA is a method generally used in the analysis of metabolomics data from designed experiments to separate variation due to experimental factors (eg., time, dose) from residual noise.26–28 However, its mathematical properties make it highly suitable for regional disparity analysis. In this study, the “experimental factor” is the administrative unit (the Subdistrict). The ASCA model decomposes the data matrix  into additive matrices:
By calculating the Sum of Squares ( ) for each matrix, we can quantify the “importance” of the subdistrict effect. A high percentage of variance explained by
  indicates that geography (where one lives) is a massive determinant of intervention coverage.
The row labels (subdistrict names) of the data matrix were randomly reshuffled 1,000 times. This destroys the biological/administrative structure of the data while preserving its statistical distribution. For each permutation, the ASCA model was recalculated, and the Sum of Squares for the subdistrict effect ( ) was recorded to create a “null distribution”..
The observed  from the original (un-permuted) data was compared to this null distribution. A
  was calculated as the fraction of permuted
  values that exceeded the observed
  . A result of
  indicates that the observed inequality between subdistricts is statistically significant and unlikely to have arisen by chance.27
Principal Component Analysis (PCA)
Once the subdistrict effect was proven significant, Principal Component Analysis (PCA) was applied specifically to the matrix  . This differs from applying PCA to raw data. By applying it to the effect matrix, the resulting Principal Components (PCs) focus exclusively on the patterns of disparity between the administrative units. The PCA decomposes the effect matrix into Scores
  and Loadings
  .
.  . Scores
  represent the coordinates of each subdistrict in the reduced dimensional space, Loadings
  represent the contribution of each indicator (Insurance, Food, Iron, Contraception) to the components.
SVD-Based Biplot Visualization
The final output is a Biplot, constructed using Singular Value Decomposition (SVD). The biplot is a graphical display that simultaneously represents the  observations (subdistricts) and the p variables (indicators) in a 2-dimensional space.34,35
This visual tool allows for the identification of “risk clusters”, defined as groups of subdistricts that share specific failure modes (eg., high social aid but low contraceptive use), thereby directly supporting policy decision-making.
All statistical analyses, including ASCA, PCA, and biplot visualization, were conducted using R Studio (version 2025.05.1+513).
Results
Descriptive Statistics
The analysis of the four stunting intervention indicators across the 22 urban villages of Cirebon City reveals distinct patterns of coverage and variability (Table 2). These indicators are established in the literature as key determinants of stunting reduction: health insurance (PBI-JKN) ensures financial access to prenatal care; food assistance (BPNT) addresses household food security; iron supplementation optimizes preconception health; and managing unmet contraceptive need prevents maternal depletion syndrome. In a dense, heterogeneous coastal hub like Cirebon, these factors are critical for achieving SDG 2 (Zero Hunger) and SDG 3 (Good Health and Well-being) at the micro-level.
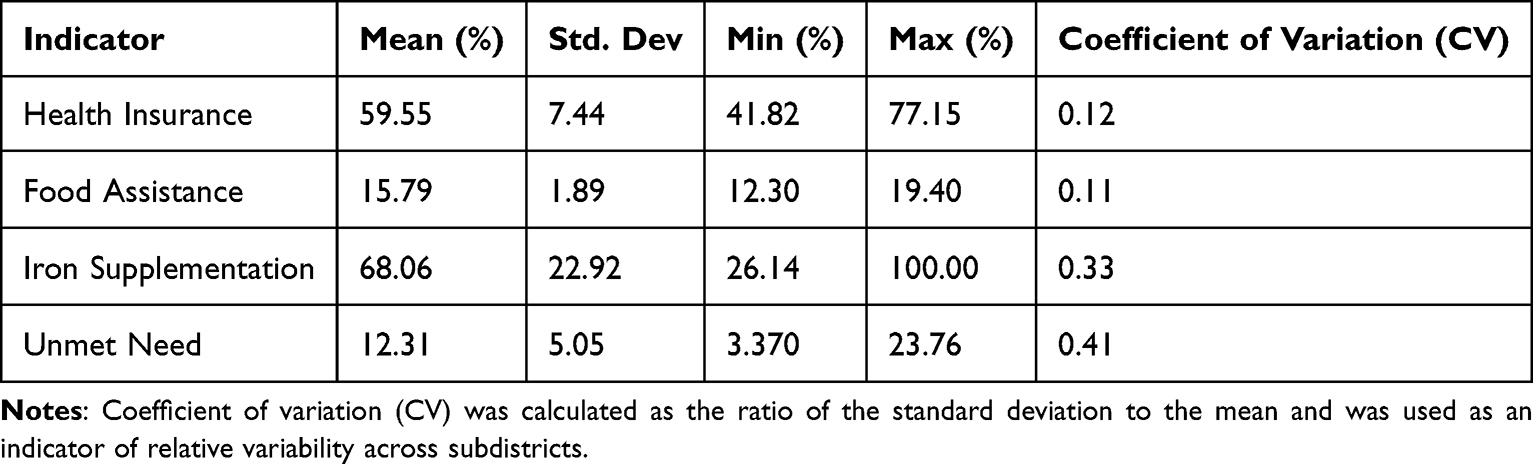 |
Table 2 Descriptive Statistics of Stunting Intervention Indicators Across Urban Villages |
The health insurance indicator shows a moderate mean coverage of 59.55% with relatively low variability (CV = 0.12). Although coverage is not yet universal, the relatively narrow dispersion across subdistricts (range: 41.82–77.15%) suggests that enrollment in the subsidized national health insurance scheme is implemented with relative administrative consistency across the city. In contrast, food assistance coverage exhibits a lower average (15.79%) but also exhibits low relative variability (CV = 0.11), with a limited range across subdistricts (12.30–19.40%).
Iron supplementation among prospective brides shows substantial variability, with a mean of 68.06% and a high coefficient of variation (CV = 0.33). Coverage ranges widely from 26.14% to 100%, This sharp contrast between subdistricts suggests uneven program implementation and behavioral compliance, identifying iron supplementation as a primary driver of inequality in Cirebon’s prevention efforts. Such variability signals elevated policy risk, as subdistricts with low coverage may undermine citywide stunting reduction goals.
The unmet need indicator exhibits the highest relative variability (CV = 0.41), despite having a low mean value (12.31%). The wide range (3.37–23.76%) reflecting pronounced disparities in access to or utilization of family planning services across the administrative landscape.
Decomposition of Variance and Significance Test
The permutation test (1,000 permutations) yielded a  of
of  . This result confirms that the observed subdistrict effect is highly statistically significant, allowing us to reject the null hypothesis that intervention coverage is uniform across the city. The differences between subdistricts are structural and systemic, necessitating a targeted “precision public health” response rather than generalized municipal strategies.
Principal Component Analysis (PCA) of the Subdistrict Effect
Given the significant subdistrict effect, PCA was applied to the effect matrix to summarize the multivariate structure. The analysis indicated that the variation is highly structured and low-dimensional. As shown in Table 3, the first two principal components (PCs) explain 92.99% of the total variance.
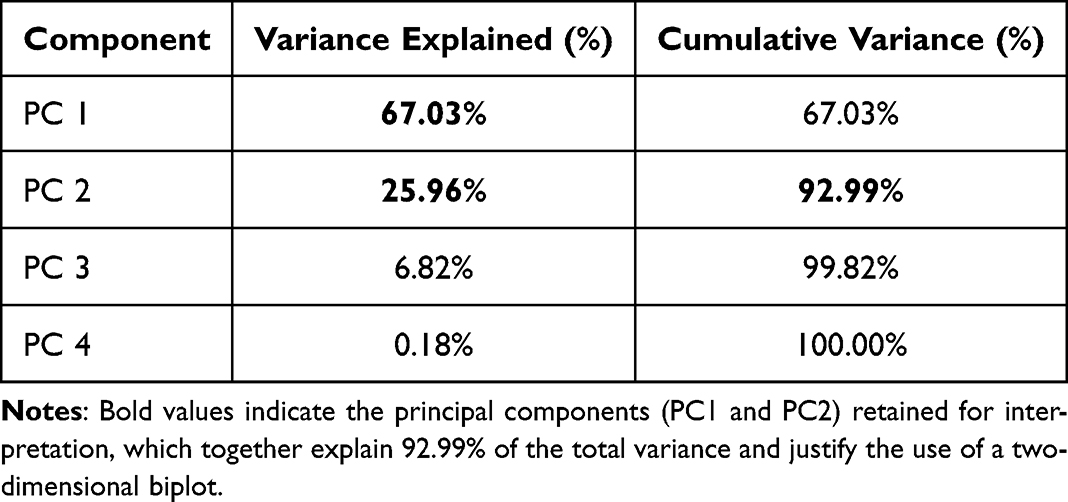 |
Table 3 Variance Explained by Principal Components |
Table 3 summarizes the variance explained by each principal component derived from the ASCA subdistrict effect matrix. The high cumulative variance explained by PC1 and PC2 (92.99%) confirms that a two-dimensional biplot is an adequate and robust tool for visualizing the performance landscape. Higher-order components contribute marginally (<7%) and were therefore excluded from further interpretation.
Biplot Visualization and Typology Identification
A PCA biplot based on the first two components was constructed to jointly visualize subdistricts and intervention indicators (Figure 1). The biplot provides an integrated representation of both the magnitude and direction of the relationships between subdistricts and intervention coverage patterns.
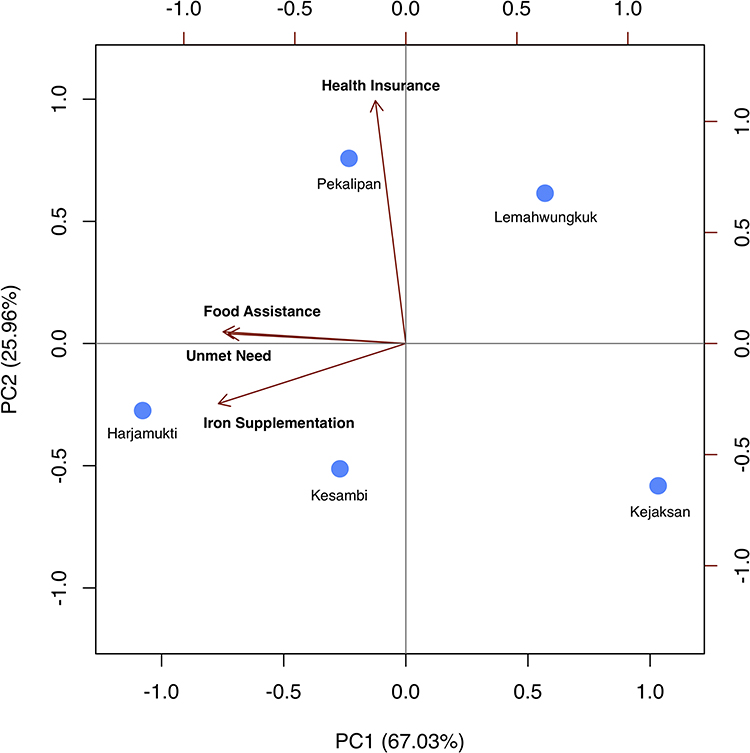 |
Figure 1 Biplot of subdistrict effects based on ASCA-derived principal components for stunting intervention indicators. Points represent subdistricts (1 = Harjamukti; 2 = Lemahwungkuk; 3 = Pekalipan; 4 = Kesambi; 5 = Kejaksan), while vectors represent intervention indicators (health insurance, food assistance, iron supplementation, and unmet need). Bold labels denote the intervention indicators, while non-bold labels represent subdistricts. The first two principal components explain 92.99% of the total variance. |
Based on their relative positions in the biplot, subdistricts can be broadly grouped into distinct performance profiles. Harjamukti and Kesambi cluster in the same direction as the vectors for iron supplementation and unmet need, identifying them as “compliance-lagging” areas where behavioral and service outreach challenges are prominent. Given that unmet need is measured as a case indicator, their alignment with this vector indicates a higher burden of unmet need in these subdistricts.
In contrast, Lemahwungkuk and Kejaksan are positioned in the opposite direction to the food assistance and iron supplementation vector, indicating relatively lower coverage of this structural intervention. This positioning supports their classification as “access-lagging” areas, where administrative exclusion and limited reach of social protection programs are likely to be key constraints.
Pekalipan shows a strong alignment with the health insurance vector along the second principal component, suggesting that it represents a subdistrict with comparatively stronger performance in health insurance coverage rather than merely an intermediate profile.
This typological differentiation highlights that subdistrict disparities are not uniform across intervention domains. Instead, each subdistrict exhibits a distinct combination of strengths and weaknesses, underscoring the need for geographically tailored policy responses rather than uniform, city-wide strategies.
Discussion
This study demonstrates that childhood stunting intervention coverage in Cirebon City is significantly determined by subdistrict administrative boundaries ( ), confirming that intra-urban inequality is structural rather than random. The finding that the subdistrict effect explains over 92% of the multivariate variance supports the “urban paradox” hypothesis in Low- and Middle-Income Countries (LMICs), where aggregate city-level success often masks deep pockets of deprivation in specific neighborhoods.36 From a risk management perspective, these subdistricts function as “units of failure” where the convergence mandated by national policy (Perpres 72/2021) breaks down due to localized administrative and behavioral barriers.37
The finding that the subdistrict effect explains a large proportion of total variance aligns with prior public health research showing that aggregated city- or district-level indicators often mask critical intra-urban inequalities. Urban settings, particularly in low- and middle-income countries, frequently exhibit sharp contrasts in access to social protection and health services within relatively small geographic areas.38,39 This study extends that literature by providing a multivariate, variance-based confirmation of such disparities, rather than relying on univariate comparisons or rank-based assessments.
The biplot-based typology highlights that subdistricts do not simply fall along a single gradient of “good” versus “poor” performance. Instead, distinct performance profiles emerge. Some subdistricts exhibit relatively strong coverage in social protection indicators but lag in reproductive health compliance, while others display the opposite pattern. This finding has direct policy relevance, as it suggests that uniform intervention strategies are unlikely to be effective. Subdistricts facing compliance-related challenges may require behaviorally focused interventions, such as intensified counseling, community engagement, or service delivery redesign, whereas access-lagging areas may benefit more from administrative reforms and improved targeting mechanisms.
Decomposing the Determinants: A Multi-Indicator Analysis
To translate these findings into concrete strategies, it is essential to interpret the performance of each selected indicator within the urban context of Cirebon:
- Food Assistance (BPNT): The biplot positions Lemahwungkuk and Kejaksan in the opposite direction of these structural vectors. This supports their classification as “access-lagging” subdistricts, where the primary risk lies in administrative exclusion rather than program availability. In coastal subdistricts like Lemahwungkuk, this often reflects errors in the social welfare registry (DTKS) or the administrative invisibility of mobile fishing communities and informal settlers who may lack local identity cards.40 Strategy: For these areas, the city government should prioritize “data sweeping” and mobile registration units to ensure that seasonal income volatility in fishing households does not lead to nutritional shocks due to lack of insurance or food aid.
- Iron Supplementation Compliance: This indicator exhibited the highest policy risk due to massive variability (CV = 0.33). The biplot shows that Lemahwungkuk and Kejaksan are positioned in the opposite direction to the iron supplementation vector, suggesting relatively lower coverage of this intervention. This pattern reinforces their classification as “access-lagging” areas, where the primary constraint lies in limited reach or administrative access rather than behavioral non-compliance. In these more developed, peri-urban subdistricts, low compliance often stems from a “tick-box” mentality in the “Elsimil” application usage, where couples register to fulfill marriage requirements but do not substantively consume the supplements due to sensory aversion or lack of persuasive education.41 Strategy: Transition from reporting-based incentives to outcome-based metrics for the Tim Pendamping Keluarga (TPK), focusing on verified consumption and intensive preconception counseling.
- Unmet Need for Contraception: Showing the highest relative variability (CV = 0.41), this indicator also clusters toward Harjamukti and Kesambi. This reflects a failure of service outreach to accommodate the “time poverty” of urban working women in commercial hubs. Despite being physically close to health centers, women in these areas may face logistical barriers related to work schedules or clinic operating hours.42,43 Strategy: Implementation of “twilight clinics” (Posyandu Sore/Malam) or workplace-based family planning services to bridge the “last mile” of service delivery.
- Health Insurance (PBI-JKN): The biplot illustrates that the subdistricts of Kejaksan, Harjamukti, and Kesambi are positioned inversely to the health insurance vector, indicating a significant coverage deficit in these administrative units. In the case of Kejaksan, this spatial orientation confirms an “access-lagging” typology, where the primary risk to stunting intervention performance is structural exclusion. This pattern often stems from administrative bottlenecks and the systemic exclusion of residents in the informal sector or high-density settlements from the social welfare registry. Strategy: utilizing mobile service units to reach marginalized households and prioritizing aggressive synchronization of the Integrated Social Welfare Data (DTKS) to close the health protection gap.44
The typological differentiation revealed by the ASCA biplot, namely access-lagging (structural deficits) versus compliance-lagging (behavioral gaps), provides a formal roadmap for targeted governance. Uniform municipal strategies are inherently inefficient in a heterogeneous environment like Cirebon. Instead, this study advocates for a Precision Public Health framework where resource allocation is informed by the specific risk profile of each subdistrict cluster.
By separating the “Subdistrict Effect” from random noise using ASCA, local planners can identify precisely which neighborhoods require administrative reforms and which require intensive community engagement. This risk-informed approach maximizes the impact of the municipal budget and ensures that interventions are tailored to the unique socio-geographic characteristics of each urban village, directly supporting the achievement of the Sustainable Development Goals (SDGs).
Several limitations should be acknowledged. First, the analysis relies on secondary administrative data, which may be subject to reporting inaccuracies or inconsistencies across subdistricts. Second, the cross-sectional design precludes causal inference and limits the ability to assess temporal dynamics in intervention performance. Third, the analysis focuses on a limited set of indicators targeting couples of reproductive age; while these indicators are strategically important within the lifecycle approach to stunting prevention, they do not capture the full spectrum of determinants influencing child growth outcomes. Future research could extend this framework by incorporating longitudinal data, additional indicators, or outcome measures such as stunting prevalence itself.
Despite these limitations, the findings provide actionable insights for local health governance. By identifying structurally distinct risk profiles at the subdistrict level, this study supports a shift from blanket intervention models toward targeted, risk-informed policy design. Such an approach is consistent with the principles of precision public health and is particularly relevant for urban settings characterized by heterogeneous populations and constrained resources.
Conclusion
This study provides empirical evidence that inequality in stunting intervention coverage in Cirebon City is a systemic risk driven by subdistrict-level administrative and behavioral factors. The application of ANOVA-Simultaneous Component Analysis (ASCA) successfully isolated a significant subdistrict effect ( ), confirming that the administrative unit of residence is a decisive determinant of health equity. The resulting biplot-based typology demonstrates that a “one-size-fits-all” approach is insufficient for complex urban environments.
To accelerate progress toward the 14% national stunting target, local governance must transition to a Precision Public Health strategy with the following indicator-specific policy alignments:
- Structural Access (Food Assistance and Health Insurance): For “access-lagging” subdistricts such as Lemahwungkuk, Kejaksan, Harjamukti, and Kesambi, the primary challenge lies in administrative exclusion and limited program reach. Errors in the social welfare registry (DTKS) and the administrative invisibility of mobile or informal populations reduce effective coverage of both food assistance and health insurance programs. Policymakers should implement integrated “data sweeping” initiatives, strengthen DTKS synchronization, and deploy mobile registration and service units to ensure that vulnerable populations are accurately identified and enrolled in social protection programs.
- Behavioral Compliance (Iron Supplementation): For compliance-lagging subdistricts like Lemahwungkuk and Kejaksan, the focus must shift to overcoming behavioral barriers in iron supplementation by incentivizing the TPK based on verified consumption rather than administrative reporting.
- Service Reach (Unmet Need for Contraception): To manage reproductive health risk in commercial hubs like Harjamukti and Kesambi, city authorities should implement “twilight clinics” or workplace-based family planning services. This strategy specifically targets the “time poverty” of urban working women who face logistical barriers despite physical proximity to health centers.
The integration of ASCA with PCA and SVD-based biplot visualization enables a nuanced characterization of subdistrict performance, revealing distinct typologies rather than a simple linear ranking. These findings suggest that a one-size-fits-all policy approach is insufficient to address the heterogeneous challenges faced by urban subdistricts. Instead, targeted strategies that differentiate between access-related and compliance-related gaps are required to accelerate progress toward stunting reduction targets.
Abbreviations
ASCA, ANOVA–Simultaneous Component Analysis; CV, Coefficient of Variation; PCA, Principal Component Analysis; PC, principal component; PUS, couples of reproductive age.
Ethical Statement
This study used secondary, aggregated administrative data at the subdistrict level obtained from local government records. The dataset contained no individual-level or personally identifiable information. Accordingly, ethical approval and informed consent were waived by the Institutional Review Board of Padjadjaran University, Bandung, Indonesia, in accordance with national regulations and institutional policies governing research using anonymized secondary data.
Acknowledgments
The authors would like to thank Universitas Padjadjaran and LPDP for supporting this publication.
Funding
This publication charge is funded by Universitas Padjadjaran through the Indonesian Endowment Fund for Education (LPDP) on behalf of the Indonesian Ministry of Higher Education, Science and Technology and managed under the EQUITY Program (Contract No. 4303/B3/DT.03.08/2025 and 3927/UN6.RKT/HK.07.00/2025).
Disclosure
Ms Leivina Saliaputri reports grants from Universitas Padjadjaran. The authors report no other conflicts of interest in this work.
References
1. World Health Organization. Joint child malnutrition estimates (JME) [homepage on the Internet]. Geneva: World Health Organization; 2025. Available from: https://www.who.int/data/gho/data/themes/topics/joint-child-malnutrition-estimates-unicef-who-wb.
2. Oduro M, Iddi S, Asiedu L, Asiki G, Kadengye D. A multi-state transition model for child stunting in two urban slum settlements of Nairobi: a longitudinal analysis, 2011–2014. medRxiv. 2022. doi:10.1101/2022.07.26.22278058
3. Harper A, Rothberg A, Chirwa E, Sambu W, Mall S. Household food insecurity and demographic factors, low birth weight and stunting in early childhood: findings from a longitudinal study in South Africa. Matern Child Health J. 2022;27(1):59–11. doi:10.1007/s10995-022-03555-7
4. Ogwel B, Mzazi V, Awuor A, et al. Predictive modelling of linear growth faltering among pediatric patients with diarrhea in rural western Kenya: an explainable machine learning approach. BMC Med Inf Decis Making. 2024;24. doi:10.21203/rs.3.rs-4047381/v1
5. Naibili M, Rua Y, Seuk S. Analyzing posyandu cadres’ motivation in combating stunting through the lens of maslow’s hierarchy of needs. JPKI. 2023;9(2):123–140. doi:10.17509/jpki.v9i2.64226
6. Izzah R, Ahmad A, Junita D, Arifin S. Exclusive breastfeeding and low birth weight as risk factors of stunting in under-five children: a case-control study in darul imarah sub-district, aceh besar, Indonesia. JAND. 2022;1(1):34–42. doi:10.30867/jand.v1i1.30
7. Afandy U, Fanny L, Mustamin M. Antenatal nutrient intake and the incidence of stunting in children: a systematic review. JURNAL RISET GIZI. 2024;12(2):155–160. doi:10.31983/jrg.v12i2.11671
8. Chen K, Liu C, Liu X, et al. Nutrition, cognition, and social emotion among preschoolers in poor, rural areas of south central China: status and correlates. Nutrients. 2021;13(4):1322. doi:10.3390/nu13041322
9. Vaivada T, Akseer N, Akseer S, Somaskandan A, Stefopulos M, Bhutta Z. Stunting in childhood: an overview of global burden, trends, determinants, and drivers of decline. Am J Clin Nutri. 2020;112:777S–791S. doi:10.1093/ajcn/nqaa159
10. Danaei G, Andrews K, Sudfeld C, et al. Risk factors for childhood stunting in 137 developing countries: a comparative risk assessment analysis at global, regional, and country levels. PLoS Med. 2016;13(11):e1002164. doi:10.1371/journal.pmed.1002164
11. Merawati D, Weningtyas A, Amelia D, et al. The role of family’s sociodemographic status at incidence of stunting in senggreng village, malang regency. GSC Biol Pharm Sci. 2023;24(2):328–334. doi:10.30574/gscbps.2023.24.2.0348
12. Fitri M, Zuraidi E, Yusuf M. Quantitative analysis of sanitation infrastructure and stunting prevalence: building rural community resilience in bener meriah regency, aceh-Indonesia. IOP Conf Ser Earth Environ Sci. 2025;1510(1):012065. doi:10.1088/1755-1315/1510/1/012065
13. Hildreth J, Vickers M, Buklijaš T, Bay J. Understanding the importance of the early-life period for adult health: a systematic review. J Dev Orig Health Dis. 2022;14(2):166–174. doi:10.1017/s2040174422000605
14. Majeed N, Sharif R, Sheeraz M, et al. Impact of climate change on agriculture & vice versa: a review. JQAAS. 2023;3(01):1–15. doi:10.38211/jqaas.2023.3.31
15. Nurjannah N, Taamu T, Dali D, Arum D. Effect of cognitive stimulation based on puzzle games on learning achievement in school-aged stunted children. Asian J Pharm Res Dev. 2023;11(2):20–24. doi:10.22270/ajprd.v11i2.1244
16. Handryastuti S, Pusponegoro H, Nurdadi S, et al. Comparison of cognitive and other developmental functions in children with stunting and malnutrition; 2020. doi: 10.21203/rs.3.rs-72816/v1.
17. Handayani B. The role of nasyiatul aisyiyah and fatayat nu cadres in preventing stunting cases in Indonesia. MIPHMP. 2021;1(1):329–338. doi:10.53947/miphmp.v1i1.70
18. Maaruf N, Triadi I. Analysis of the government’s role in implementing presidential regulation (perpres) number 72 of 2021 on accelerating stunting reduction in efforts to maintain national resilience. JHS. 2023;9(2). doi:10.37676/jhs.v9i2.4857
19. Akita T, Miyata S. Spatial inequalities in Indonesia, 1996–2010: a hierarchical decomposition analysis. Soc Indic Res. 2017;138(3):829–852. doi:10.1007/s11205-017-1694-1
20. Mulyaningsih T, Mohanty I, Widyaningsih V, Gebremedhin T, Miranti R, Wiyono V. Beyond personal factors: multilevel determinants of childhood stunting in Indonesia. PLoS One. 2021;16(11):e0260265. doi:10.1371/journal.pone.0260265
21. Shibre G, Zegeye B, Lemma G, Abebe B, Woldeamanuel G. Socioeconomic, sex and area related inequalities in childhood stunting in Mauritania: evidence from the mauritania multiple indicator cluster surveys (2007–2015). PLoS One. 2021;16(10):e0258461. doi:10.1371/journal.pone.0258461
22. Rukmana E, Purba R, Nurfazriah L, Purba E. The correlation between characteristics, knowledge of nutrition and nutritional status (h/a) among children aged 6–59 months in medan city. BIO Web Conf. 2022;54:00012. doi:10.1051/bioconf/20225400012
23. Hamzah M, Sofilda E, Kusairi S. How do socioeconomic indicators and fiscal decentralization affect stunting? Evidence from Indonesia. Int J Dev Issues. 2024;24(2):264–281. doi:10.1108/ijdi-05-2024-0150
24. Zwanenburg G, Hoefsloot H, Westerhuis J, Jansen J, Smilde A. Anova–principal component analysis and anova–simultaneous component analysis: a comparison. J Chemometrics. 2011;25(10):561–567. doi:10.1002/cem.1400
25. Madssen T, Giskeødegård G, Smilde A, Westerhuis J. Repeated measures asca+ for analysis of longitudinal intervention studies with multivariate outcome data. PLoS Comput Biol. 2021;17(11):e1009585. doi:10.1371/journal.pcbi.1009585
26. Smilde AK, Jansen JJ, Hoefsloot HCJ, Lamers RJAN, van der Greef J, Timmerman ME. ANOVA-simultaneous component analysis (ASCA): a new tool for analyzing designed metabolomics data. Bioinformatics. 2005;21(13):3043–3048. doi:10.1093/bioinformatics/bti476
27. Camacho J, Díaz C, Sánchez-Rovira P. Permutation tests for ASCA in multivariate longitudinal intervention studies. J Chemometrics. 2023;37(7):e3398. doi:10.1002/cem.3398
28. Bertinetto C, Engel J, Jansen J. ANOVA simultaneous component analysis: a tutorial review. Analyt Chim Acta X. 2020;6:100061. doi:10.1016/j.acax.2020.100061
29. Mewenemesse H, Yan Q, Acouetey P. Policy analysis of low-carbon energy transition in Senegal using a multi-criteria decision approach based on principal component analysis. Sustainability. 2023;15(5):4299. doi:10.3390/su15054299
30. Aregbeshola B, Khan S. Predictors of enrolment in the national health insurance scheme among women of reproductive age in nigeria. Int J Health Policy Manag. 2018;7(11):1015–1023. doi:10.15171/ijhpm.2018.68
31. Frongillo E, Nguyen P, Sanghvi T, et al. Nutrition interventions integrated into an existing maternal, neonatal, and child health program reduce food insecurity among recently delivered and pregnant women in Bangladesh. J Nutr. 2019;149(1):159–166. doi:10.1093/jn/nxy249
32. Swain D, Begüm J, Parida S. Effect of preconception care intervention on maternal nutritional status and birth outcome in a low-resource setting: proposal for a nonrandomized controlled trial. JMIR Res Protoc. 2021;10(8):e28148. doi:10.2196/28148
33. Ntambara J, Zhang W, Qiu A, Cheng Z, Chu M. Optimum birth interval (36–48 months) may reduce the risk of undernutrition in children: a meta-analysis. Front Nutr. 2023;9. doi:10.3389/fnut.2022.939747
34. Malik W, Piepho H. Biplots: do not stretch them! Crop Sci. 2018;58(3):1061–1069. doi:10.2135/cropsci2017.12.0747
35. Wang Y, Randolph T, Shojaie A, Ma J. The generalized matrix decomposition biplot and its application to microbiome data. mSystems. 2019;4(6). doi:10.1128/msystems.00504-19
36. Swanida N, Malonda H, Warouw F, Arthur P, Kawatu T, Sanggelorang Y. History of exclusive breastfeeding and complementary feeding as a risk factor of stunting in children age 36–59 months in coastal areas. JHMN. 2020. doi:10.7176/jhmn/70-07
37. Sufri S, Iskandar I, Nurhasanah N, et al. Implementation outcomes of convergence action policy to accelerate stunting reduction in Pidie district, Aceh province, Indonesia: a qualitative study. BMJ Open. 2024;14(11):e087432. doi:10.1136/bmjopen-2024-087432
38. Sanchez M, Ambrós A, Milà C, et al. Development of land-use regression models for fine particles and black carbon in peri-urban south India. Sci Total Environ. 2018;634:77–86. doi:10.1016/j.scitotenv.2018.03.308
39. Rai B, Clements M. Geographical variation in prostate cancer testing explained by socio-economic position in Stockholm. Eur J Public Health. 2024;34(Supplement_3). doi:10.1093/eurpub/ckae144.938
40. Rusliadi R, Widianingsih I, Buchari RA. Implementation of the Non-Cash Food Assistance Program (BPNT) in Takalar Regency. Jurnal Ilmiah Ilmu Administrasi Publik. 2023;13(1):359. doi:10.26858/jiap.v13i1.47257
41. Hidayanty H, Nurzakiah N, Irmayanti I, Yuliana Y, Helmizar H, Yahya Y. Perceived barriers and enablers for taking iron–folic acid supplementation regularly among adolescent girls in indonesia: a pilot study. Int J Environ Res Public Health. 2025;22(2):209. doi:10.3390/ijerph22020209
42. Patil S, Gopalakrishnan L, Sai VS, Matikanya R, Rajpal P. Markets, incentives, and health promotion can improve family planning and maternal health practices: a quasi-experimental evaluation of a tech-enabled social franchising and social marketing platform in India. BMC Public Health. 2024;24(1). doi:10.1186/s12889-023-17413-w
43. Jaleel A, Saha S, Arlappa N, et al. Nutritional Status of Children under five years in the slums of West Bengal, India: a cross-sectional study on prevalence, characteristics, and determinants. Nutrients. 2025;17(5):853. doi:10.3390/nu17050853
44. Mahardhika JC. Socio-economical Characteristics and Determinants of Indonesian National Health Insurance Subsidized By The Government in Jakarta. Med Clin Update. 2023;2(1):1–7. doi:10.58376/mcu.v2i1.20
 © 2026 The Author(s). This work is published and licensed by Dove Medical Press Limited. The
full terms of this license are available at https://www.dovepress.com/terms
and incorporate the Creative Commons Attribution
- Non Commercial (unported, 4.0) License.
By accessing the work you hereby accept the Terms. Non-commercial uses of the work are permitted
without any further permission from Dove Medical Press Limited, provided the work is properly
attributed. For permission for commercial use of this work, please see paragraphs 4.2 and 5 of our Terms.
© 2026 The Author(s). This work is published and licensed by Dove Medical Press Limited. The
full terms of this license are available at https://www.dovepress.com/terms
and incorporate the Creative Commons Attribution
- Non Commercial (unported, 4.0) License.
By accessing the work you hereby accept the Terms. Non-commercial uses of the work are permitted
without any further permission from Dove Medical Press Limited, provided the work is properly
attributed. For permission for commercial use of this work, please see paragraphs 4.2 and 5 of our Terms.