Back to Journals » Psychology Research and Behavior Management » Volume 14
Which Information Frame is Best for Reporting News on the COVID-19 Pandemic? An Online Questionnaire Study in China
Authors Kuang Y ![]() , Xu MX
, Xu MX ![]() , Yang SW
, Yang SW ![]() , Ding Y
, Ding Y ![]() , Zheng R
, Zheng R ![]() , Taplin J, Li S
, Taplin J, Li S ![]()
Received 2 March 2021
Accepted for publication 24 April 2021
Published 17 May 2021 Volume 2021:14 Pages 563—574
DOI https://doi.org/10.2147/PRBM.S309146
Checked for plagiarism Yes
Review by Single anonymous peer review
Peer reviewer comments 4
Editor who approved publication: Dr Igor Elman
Yi Kuang,1,2 Ming-Xing Xu,1,3 Shu-Wen Yang,1,2 Yang Ding,1,2 Rui Zheng,1,2 John Taplin,4 Shu Li1,5
1CAS Key Laboratory of Behavioural Science, Institute of Psychology, Chinese Academy of Sciences, Beijing, 100101, People’s Republic of China; 2Department of Psychology, University of Chinese Academy of Sciences, Beijing, 100049, People’s Republic of China; 3School of Transportation, Fujian University of Technology, Fuzhou, 350118, People’s Republic of China; 4School of Psychology, University of Adelaide, Adelaide, SA, 5005, Australia; 5Department of Psychology and Behavioral Sciences, Zhejiang University, Hangzhou, 310058, People’s Republic of China
Correspondence: Shu Li
CAS Key Laboratory of Behavioral Science, Institute of Psychology, Chinese Academy of Sciences, Beijing, 100101, People’s Republic of China
Tel +86-10-64841536
Fax +86-10-64841536
Email [email protected]
Introduction: The COVID-19 pandemic has received broad public attention and has been subject to social media discussion since the beginning of 2020. Previous research has demonstrated that framing could influence perception and behaviors of audience members in the mass media. The question addressed in this paper concerns which information frame is best for reporting negative news (eg, deaths) and positive news (eg, recoveries or cures) related to the outbreak of COVID-19.
Methods: During the Spring Festival holidays of 2020 in China, we investigated a sample of 8170 participants’ risk perceptions and emotional responses to the pandemic, and their willingness to forward updates when the information is presented in different frames by using a 2 (domain: living [good news] vs dying [bad news]) × 2 (count: absolute vs relative) × 2 (population base: excluding population base vs including population base) × 2 (content: text-only vs text-plus-graphic) mixed factorial design, with the first factor being a within-subjects factor and the last three being between-subjects factors.
Results: Results indicated that (1) participants were more willing to forward good news (eg, cures) than bad news (eg, deaths); (2) when reporting bad news, the inclusion of the “population base” was effective in minimizing negative emotions; (3) when reporting good news, excluding the “population base” was more effective than including it in order to maximize positive emotions; (4) a text-plus-graphic frame worked better than a text-only frame in lowering the level of risk perception and negative emotions.
Discussion: This study is relevant to how individuals and organizations communicate information about this viral pandemic and the probable impact of this news on the general public.
Keywords: COVID-19, information frame, perception, emotion
Introduction
The emergence of the coronavirus disease 2019 (COVID-19) in Wuhan in December 2019 and subsequent spread across China and to many other countries around the world have raised numerous challenges for health professionals. The pandemic has received broad media attention and been subject to significant and ongoing social media discussion, which can induce both positive and negative impacts on risk perception among people, which in turn may determine their behaviors.1–5 For instance, rural residents in the United States are more likely to practice social distancing if they live in a media market that is more impacted by COVID-19.3 Examining the first months of the COVID-19 news coverage may therefore help us to better understand what informed the public’s initial perceptions of COVID-19.2
As summarized in a prior review, people encounter unknown risks and experience predominantly negative emotions (eg, anxiety) during a pandemic.6 In the early days of the outbreak, negative news related to COVID-19 predominated, such as news of the increasing number of confirmed cases and lack of medical resources. This situation may have increased negative emotions and influenced people’s risk perception, which is often driven by emotions rather than factual information.6–8 In the case of strong emotional responses, people may ignore important numeric information, such as probabilities.9 Paulos argued that the inability to deal “rationally” with small likelihoods of large outcomes (eg, a highly unlikely but catastrophic outbreak of disease) results in misinformed government policies, confused personal decisions, and increased susceptibility to pseudoscience.10 A recent survey in Vietnam found that the exaggerated risk perception was significantly associated with misuse of precautionary measures (ie, wearing a mask) to contain COVID-19, suggesting that inadequately high-risk perception can lead to panic reactions and misuse of health measures.11 Thus, finding ways to relieve negative emotions and risk perception is crucial for responding to COVID-19.6
Risk perception can be affected by many factors, such as the spatial distance from the epicenter12–15 and risk communication messages.16 Previous research on the “Asian disease problem,” a hypothetical scenario developed by Tversky and Kahneman, has demonstrated that the extent to which people adopt risk-averse versus risk-seeking preferences is dependent on whether information about the hypothetical disease is phrased negatively in terms of “lives lost” or positively in terms of “lives saved.”17 The occurrence of changes in preferences (risk-seeking vs risk-averse) as a result of different descriptions of the same problem was labeled by Tversky and Kahneman as the “framing effect.” The framing effect is one of the most valuable approaches to investigating decisional biases and influencing factors in medical decision-making, and many studies have reported the framing effect in medical scenarios.18 The literature has shown that even well-trained physicians are not immune to this effect. Physicians’ preference for alternative therapies shifted depending on whether the outcomes were framed in terms of the probability of “living” or the probability of “dying.”19
In the mass media, by transmitting the importance of a specific aspect of reality, framing can influence the perception of audience members.20,21 For instance, citizens’ explanations of political issues have been found to be significantly influenced by the manner in which television news presentations “frame” these issues and, as a result, affect their assessments of presidential performance.22 Kapuściński and Richards found that people’s risk perception and feelings (ie, worry) would be influenced when different frames (eg, risk amplifying description frame and risk attenuating description frame) are used to describe tourist destinations in media reports.23
Given that the information environment around a pandemic underscores the importance of effective scientific communication, and finding ways to relieve negative emotions is crucial for responding to the pandemic,6 the present study sought to determine how the most appropriate information about the viral pandemic should be conveyed to encourage public health safety as much as possible without eliciting excessive levels of anxiety. To address this question, we developed a set of logically equivalent frames by using the basic pandemic information (ie, the “confirmed cases,” “death cases,” and “cured cases”) released by the National Health Commission (NHC) in China.24 We then conducted a nationwide survey to investigate people’s risk perceptions, emotional responses, and willingness to forward updates when faced with daily news presented in these different frames. We also developed additional pandemic information frames by including a population reference and graphic information and investigated how these additions might impact the message receivers’ responses.25 As per Simmons et al,26 for the present study “we report how we determined our sample size, all data exclusions (if any), all manipulations, and all measures in the study” (p. 1).
Method
Participants
For a public poll survey, about 1000 participants are considered an adequate sample size.27 We recruited a random sample of 8170 participants (4619 (56.5%) female; Mage = 29.38 years, SD = 9.31; age was missing in 69 cases) from 32 provinces, municipalities, and autonomous regions in China during the Spring Festival holidays of 2020 via an internet research source Sojump (https://www.wjx.cn/), and each participant was paid ¥6 (about $0.92). A sensitivity power analysis for our main ANOVA analysis, assuming an α of 0.05 and power of 0.80, indicated that the minimum effect size we had the power to detect was a very small effect of f = 0.03. This study was approved by the ethics review committee of the Institute of Psychology, Chinese Academy of Sciences, to protect the rights and welfare of the research participants (project identification code: H20029) and was conducted in accordance with the Declaration of Helsinki. An informed consent form was provided online specifying the study details, the participant’s rights, risks and benefits and the right to choose not to participate. The researchers analyzed only deidentified (anonymized) data.
Materials and Procedure
Pandemic Information Presented in Different Frames
Since the National Health Commission of the PRC began to release COVID-19 information on January 20, 2020, the “confirmed cases,” “death cases,” and “cured cases” have been regularly reported publicly.
Of these, death cases provide a measure of bad news, whereas cured cases represent good news. Death cases together with confirmed cases can be co-related to form a new count: a relative measure of bad news (case fatality rate). Similarly, the ratio of cured cases with confirmed cases can be seen to indicate a relative measure of good news (cure rate).
Inasmuch as the cumulative number of death cases was the same as the cumulative number of cured cases on February 1, 2020 in China, and both death and cured cases were exactly 1 each and the confirmed cases was 57 in Hainan Province on that date, the update on the outbreak of COVID-19 in Hainan Province on February 1, 2020 was chosen as the pandemic information to be presented in different frames.
Study Design and Procedure
According to the basic pandemic information, including one cured case (ie, good news), one death case (ie, bad news), and 57 confirmed cases on February 1, 2020 in Hainan Province, which has a permanent population of 9.2576 million inhabitants (ie, population base), we developed 16 frames to present the pandemic information by using a 2 (domain: living [good news] vs dying [bad news]) × 2 (count: absolute vs relative) × 2 (population base: excluding population base vs including population base) × 2 (content: text-only vs text-plus-graphic) mixed factorial design, with the first factor being a within-subjects factor and the last three being between-subjects factors. Specifically, the “variable count” denotes that only the number of cured/death cases was presented in the “absolute count” condition, while both the number of cured/death cases and that of confirmed cases were presented in the “relative count” condition. The “variable population base” denotes whether Hainan Province’s population base information would be added when the basic pandemic information is presented. Table 1 and Figure 1 show the details of experimental materials for each frame condition.
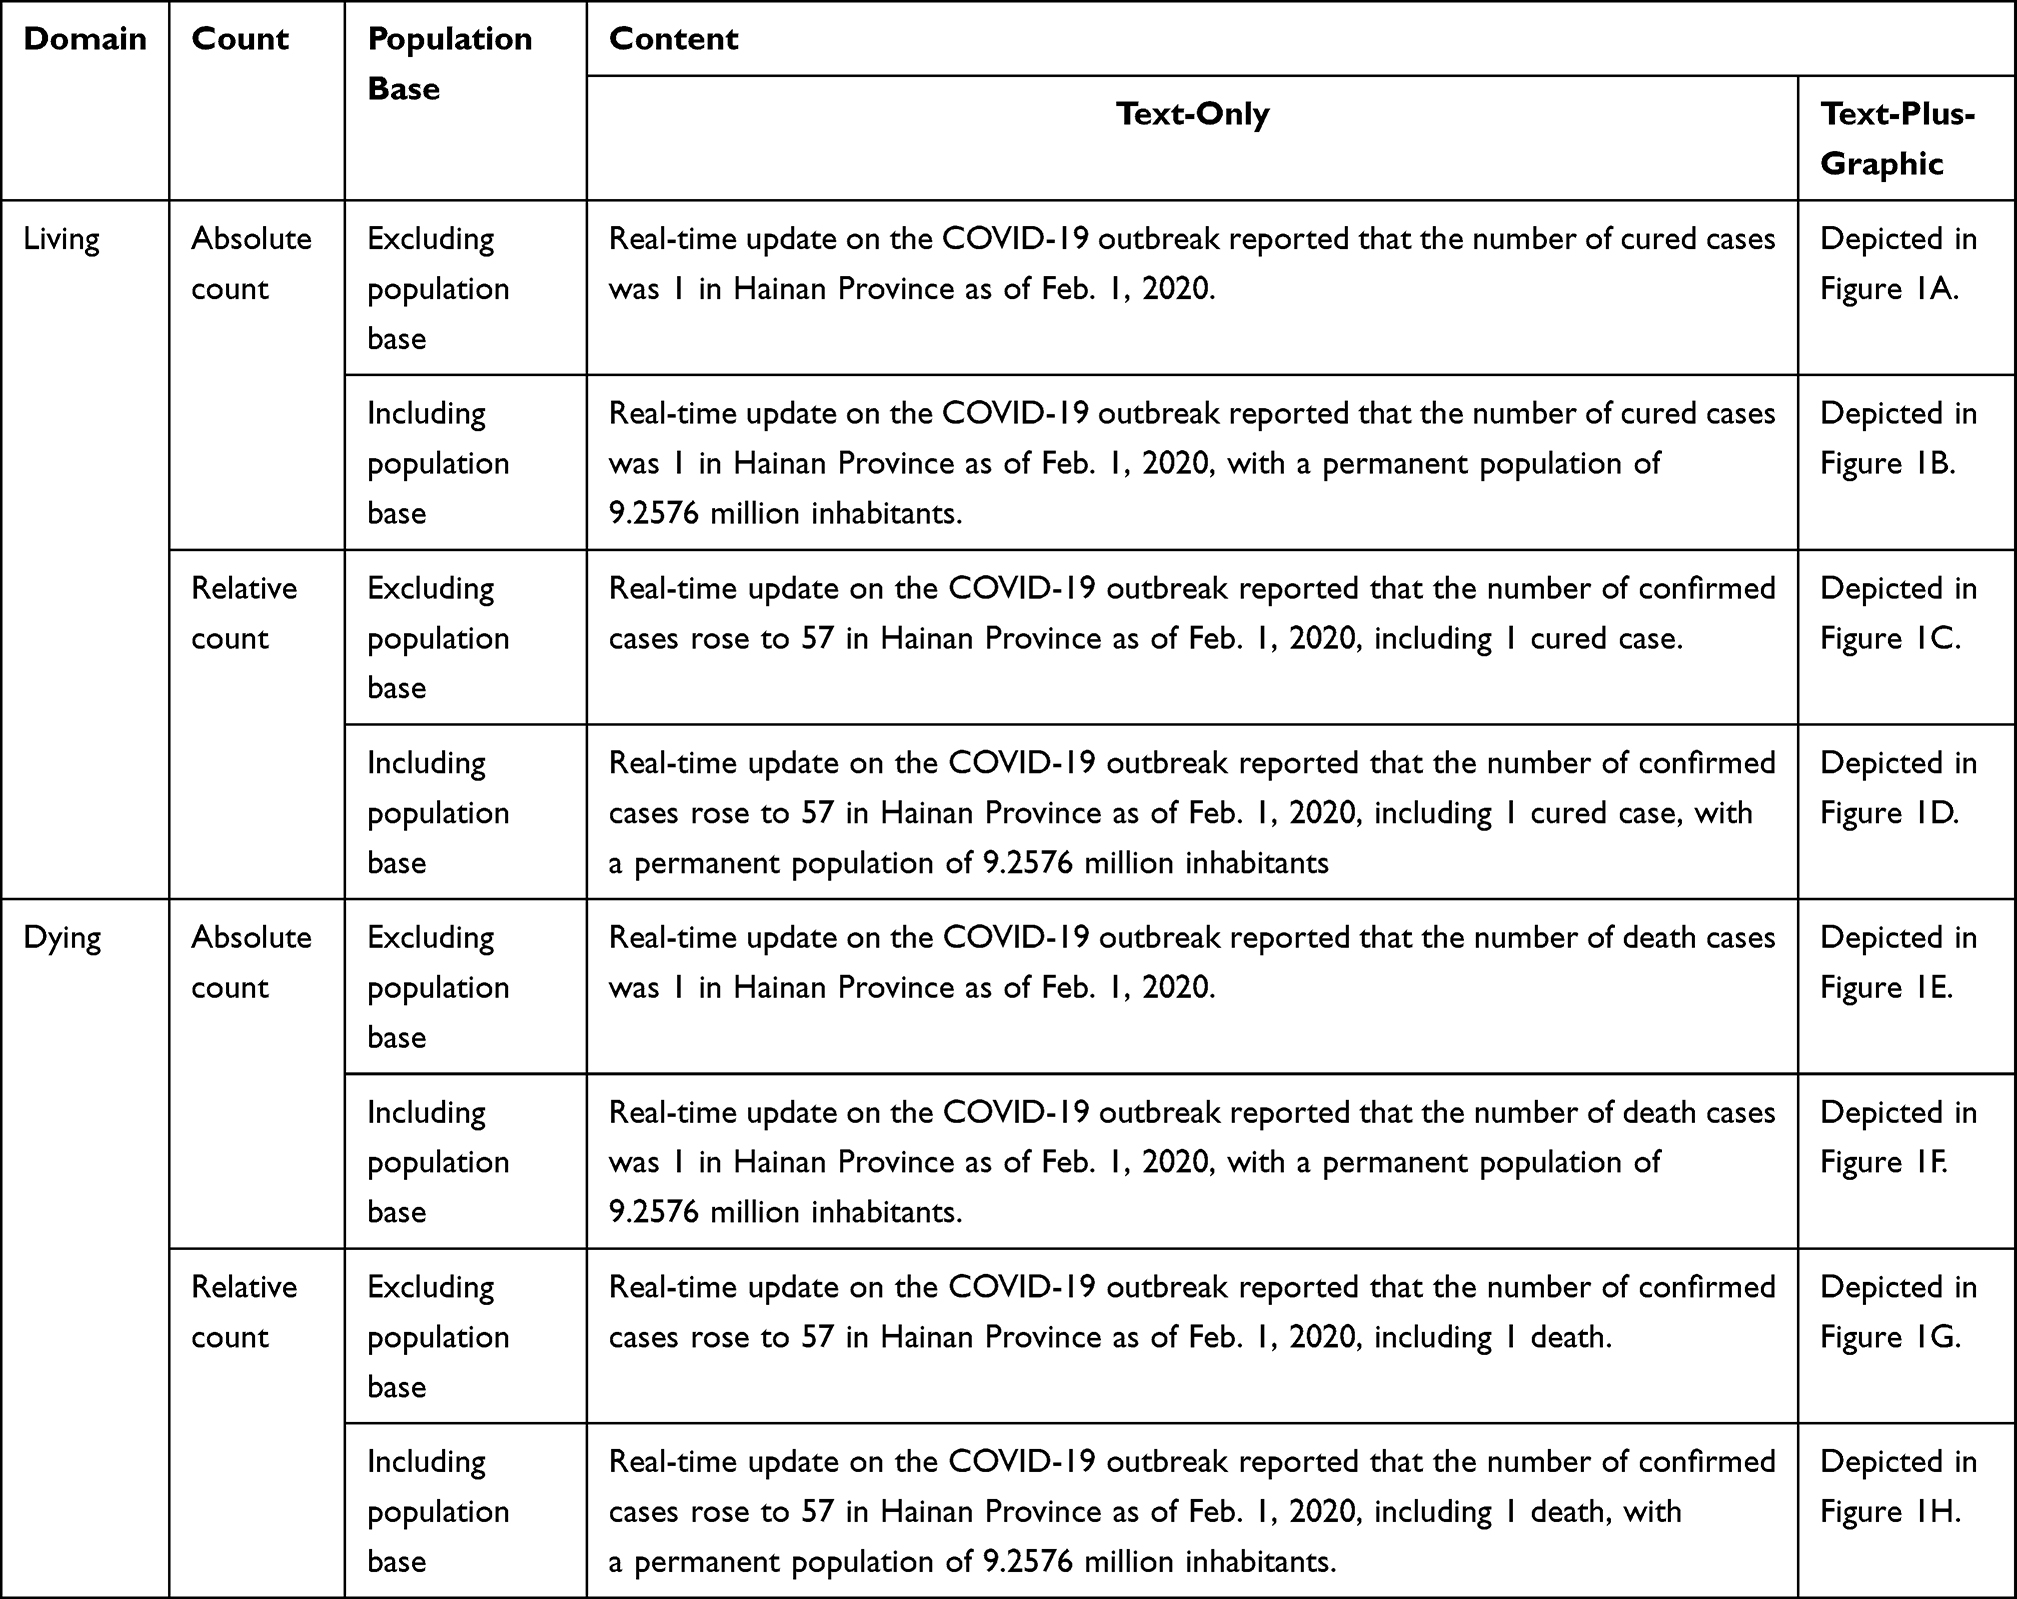 |
Table 1 Different Pandemic Information Frames Obtained by Crossing Four Factors: Domain versus Count versus Population Base versus Content |
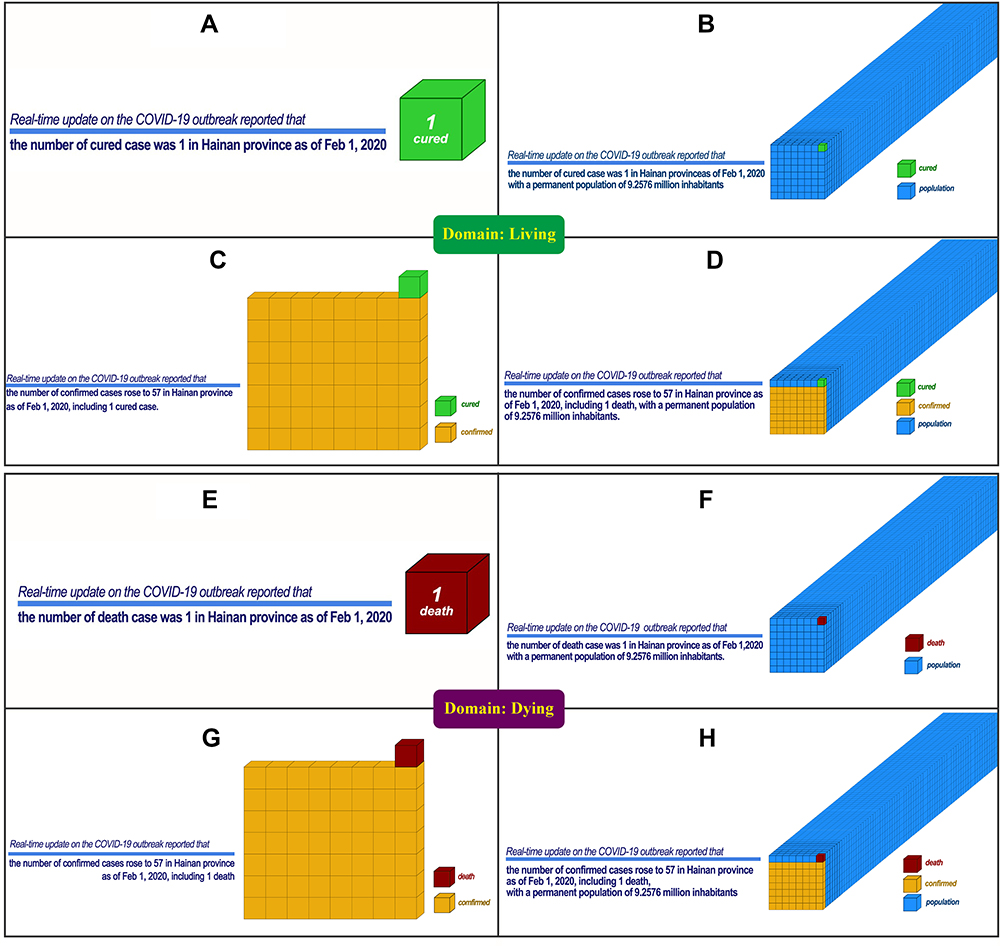 |
Figure 1 Graphics presented in the “text-plus-graphic” condition. (A–H) reflect the graphics explained in Table 1. |
Each participant was randomly assigned to one of eight frames (defined by the three between-subjects factors “count,” “population base,” and “content”) and asked to examine information containing, firstly, bad news (death) and then pandemic information conveying good news (cure; within-subjects factor “domain”). The participants were then asked to indicate their risk perception, emotional response, and willingness to forward the bad news and the good news message.
Outcome/Dependent Variable Measures
Three outcome (dependent) variables were measured by self-rating scales: risk perception, emotional response, and willingness to forward a message.
Risk Perception
We developed two items to assess each participant’s “objective danger” and “subjective fear” levels. They were asked to indicate their responses by dragging sliders on a scale from 1 (extremely low) to 100 (extremely high).
Emotional Response
A total of six items were selected from the Positive and Negative Affect Schedule (PANAS) developed by Watson et al to measure emotional responses.28 Three items (Excited, Inspired, and Active) were chosen for the positive and another three (Distressed, Nervous, and Jittery) for negative feelings. The participants were asked to provide answers on a 9-point Likert scale, respectively 1 = None at all; 5 = Moderately; 9 = Extremely.
Willingness to Forward a Message
One item was designed to measure the participant’s willingness to forward news. Participants were asked to rate their willingness to forward a message in WeChat Moments. They could drag a slider along a scale ranging from 0 (extremely unwilling) to 100 (extremely willing).
Statistical Analysis
Dependent measures were analyzed by analysis of variance (ANOVAs). No data exclusion criteria were used. All tests were two-tailed, and the level of significance was set to 0.01 to ensure that large sample size did not overly inflate the results.29 The effect sizes are shown by partial eta squared (ŋ2 p). Following Steiger’s recommendations,29 90% confidence intervals (CIs) for ŋ2 p are reported. As noted by Cohn,27 scientifically important (or at least meaningful) effects may be of the magnitude of “small” effect (ie, ŋ2 p = 0.01), which was used to evaluate our results by the effect size criterion. Only the values based on the effect-size criterion (ŋ2 p ≥ 0.01) show interpretable trends here.
We organized our statistical analyses of the survey data by focusing on 1) which easy-to-use frame may serve operationally to nudge participants into lowering their level of negative emotion induced by bad news; 2) which easy-to-use frame may serve operationally to nudge participants into raising their level of positive emotion induced by good news; and 3) which easy-to-use frame may serve operationally to nudge participants into lowering their level of risk perception regarding the pandemic information. Moreover, we aimed to determine which domain message (dying or living) people were more likely to choose to forward (or not forward).
Results
Which Frame Can Operationally Serve to Nudge Participants into Lowering Their Level of Negative Emotion Induced by Bad News?
To answer this question, a three-way ANOVA with factors count, population base, and content was conducted on the level of negative emotion induced by bad news. We took the mean score of all negative emotions (ie, distressed, nervous, and jittery) as the overall negative emotion, given that its internal reliability score was acceptable (α = 0.89). The results revealed that the overall negative emotion was significantly lower when (1) reporting the absolute count (M = 4.41, SE = 0.03) than reporting the relative count (M = 4.85, SE = 0.03), F(1, 8162) = 95.10, p < 0.001, ŋ2 p = 0.01, 90% CI [0.01, 0.02]); (2) reporting bad news including the population base (M = 4.43, SE = 0.03) than that excluding the population base (M = 4.84, SE = 0.03), F(1, 8162) = 80.62, p < 0.001, ŋ2 p = 0.01, 90% CI [0.01, 0.02] (see Figure 2, Panel A); (3) using the text-plus-graphic frame to present bad news (M = 4.57, SE = 0.03) than using the text-only frame (M = 4.69, SE = 0.03), F(1, 8162) = 7.32, p = 0.007, ŋ2 p = 0.001, 90% CI [0.000, 0.003], although the effect size was very small (see Figure 2, Panel B). The interaction effect of the population base and content was significant with a very small effect size, F(1, 8162) = 6.75, p = 0.009, ŋ2 p = 0.001, 90% CI [0.000, 0.003]. No other two- or three-way interaction effects were significant, ps > 0.01.
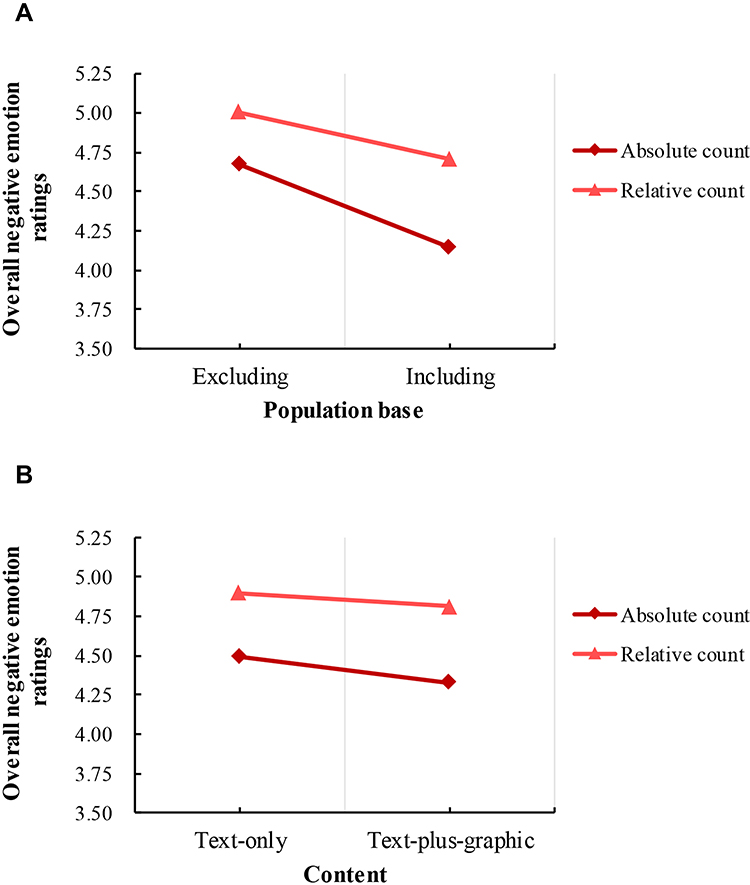 |
Figure 2 Graph of the effect of reducing the level of negative emotion induced by bad news. Panel (A) The effect of including the population base on reducing the overall negative emotion. Panel (B) The effect of using the text-plus-graphic frame on reducing the overall negative emotion. |
Which Frame Can Operationally Serve to Nudge Participants into Raising Their Level of Positive Emotion Induced by Good News?
To answer this question, the positive emotion induced by good news was analysed in the same way as described above. We computed the mean score of all positive emotions (ie, excited, inspired and active) as the overall positive emotion, given that its internal score reliability was acceptable (α = 0.90). The results revealed that the overall positive emotion was significantly higher when (1) reporting the absolute count (M = 4.32, SE = 0.03) than reporting the relative count (M = 3.48, SE = 0.03), F(1, 8162) = 311.71, p < 0.001, ŋ2 p = 0.04, 90% CI [0.03, 0.05]; (2) reporting good news excluding the population base (M = 4.21, SE = 0.32) than that including the population base (M = 3.60, SE = 0.03), F(1, 8162) = 163.71, p < 0.001, ŋ2 p = 0.02, 90% CI [0.01, 0.03] (see Figure 3, Panel A); (3) using the text-only frame to present good news (M = 4.07, SE = 0.03) than using the text-plus-graphic frame (M = 3.74, SE = 0.03), F(1, 8162) = 47.92, p < 0.001, ŋ2 p = 0.01, 90% CI [0.00, 0.01], although the effect size was very small (see Figure 3, Panel B). The interaction effect of count and population base was significant with a very small effect size (F(1, 8162) = 44.06, p < 0.001, ŋ2 p = 0.01, 90% CI [0.00, 0.01]). No other two- or three-way interaction effects were significant, ps > 0.01.
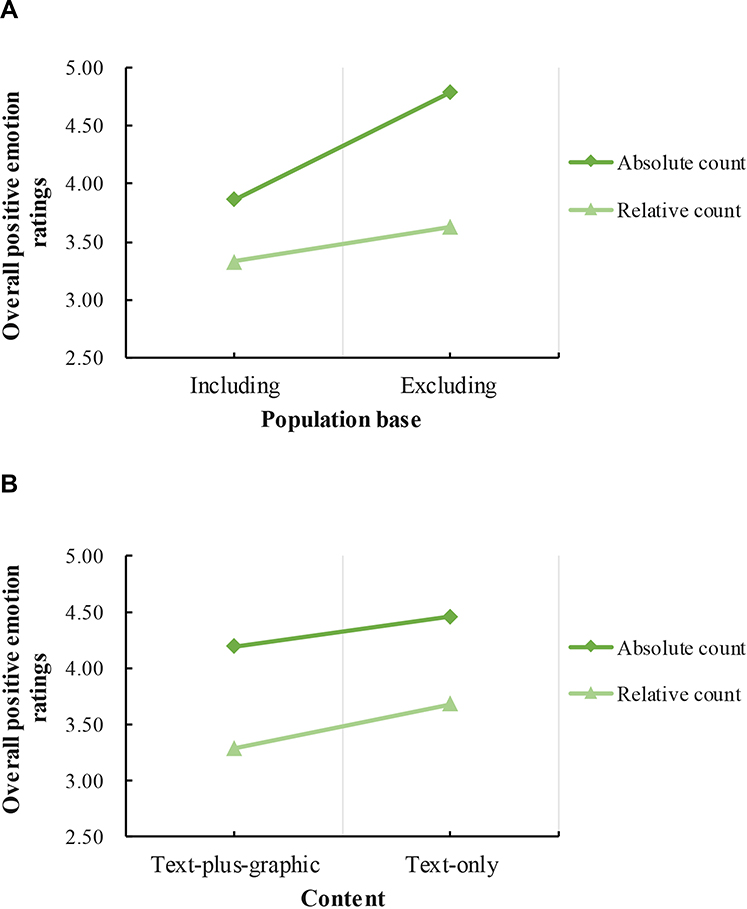 |
Figure 3 Graph of the effect of increasing the level of positive emotion induced by good news. Panel (A) The effect of excluding the population base on increasing the overall positive emotion. Panel (B) The effect of using the text-plus-graphic frame on increasing the overall positive emotion. |
Which Frame Can Operationally Serve to Nudge Participants into Lowering Their Level of Risk Perception Regarding the Pandemic Information?
The mean scores of “objective danger” and “subjective fear” posed by bad news and good news were considered as the individual’s overall risk perception of the pandemic information, and the internal reliability score across the four sub-levels of risk perception (α = 0.86) was acceptable A three-way ANOVA with factors count, population base, and content was conducted on the overall risk perception. The results revealed that the level of overall risk perception was significantly lower when (1) reporting the absolute count (M = 35.12, SE = 0.38) than reporting the relative count (M = 46.01, SE = 0.38), F(1, 8162) = 408.73, p < 0.001, ŋ2 p = 0.05, 90% CI [0.04, 0.06]; (2) reporting the pandemic information including the population base (M = 37.44, SE = 0.38) than that excluding the population base (M = 43.69, SE = 0.38), F(1, 8162) = 134.76, p < 0.001, ŋ2 p = 0.02, 90% CI [0.01, 0.02] (see Figure 4, Panel A); (3) using the text-plus-graphic frame to present news (M = 39.53, SE = 0.38) than using the text-only frame (M = 41.60, SE = 0.38), F(1, 8162) = 14.71, p < 0.001, ŋ2 p = 0.002, 90% CI [0.000, 0.004], although the effect size was very small (see Figure 4, Panel B). The interaction effects of count and population base (F(1, 8162) = 12.16, p < 0.001, ŋ2 p = 0.001, 90% CI [0.000, 0.004]), population base and content (F(1, 8162) = 21.322, p < 0.001, ŋ2 p = 0.003, 90% CI [0.001, 0.005]) and among count, population base and content (F(1, 8162) = 20.16, p < 0.001, ŋ2 p = 0.002, 90% CI [0.001, 0.005]) were significant with very small effect sizes. The interaction effect of count and content was not significant (F(1, 8162) = 4.88, p = 0.027, ŋ2 p = 0.001, 90% CI [0.000, 0.002]).
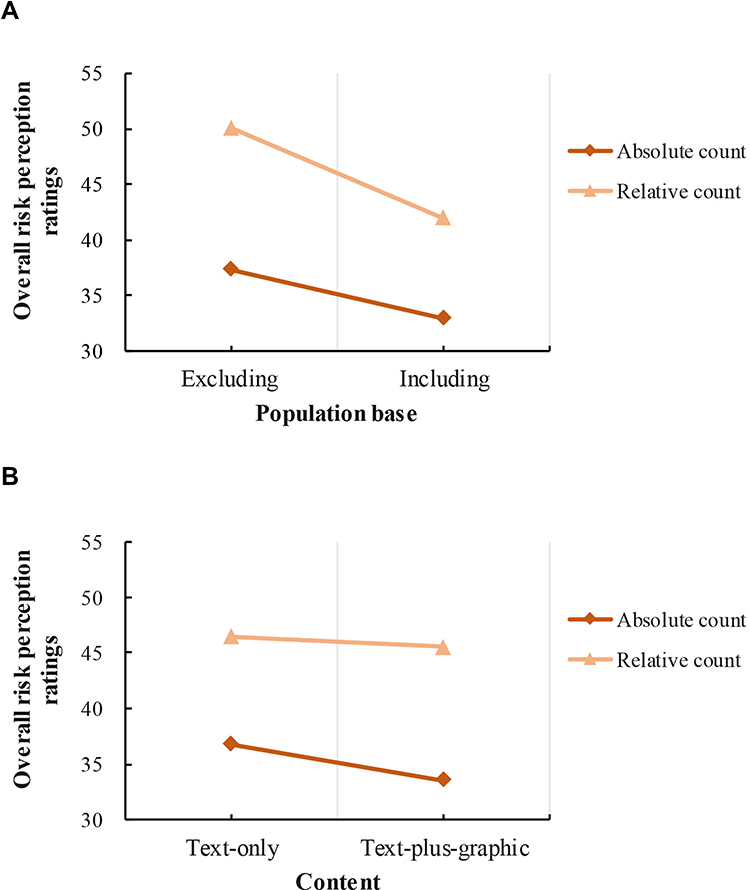 |
Figure 4 Graph of the effect of reducing the level of risk perception posed by pandemic information. Panel (A) The effect of including the population base on reducing the overall risk perception (both objective and subjective). Panel (B) The effect of using the text-plus-graphic frame on reducing the overall risk perception (both objective and subjective). |
Which Message Domain (Dying or Living) Do People Prefer to Forward?
To answer this question, we performed a four-way repeated measures ANOVA on willingness to forward message using the variables of count, population base, and content as between-subjects factors and domain as the repeated factor. The analyses were followed by a Bonferroni post-hoc test when a main effect of condition/treatment or an interaction was found. The results revealed that the main effect of domain was significant (F (1, 8162) = 1074.94, p < 0.001, ŋ2 p = 0.12, 90% CI [0.10, 0.13]), indicating that the scores for willingness to forward good news [living] (M = 55.97, SE = 0.35) were always higher than that of willingness to forward bad news [dying] (M = 47.79, SE = 0.35). This held true regardless of which of the eight frames was used to present the pandemic information. Figure 5 shows the rated willingness to forward the dying/living messages in the eight frames were formed by crossing three between-subjects factors.
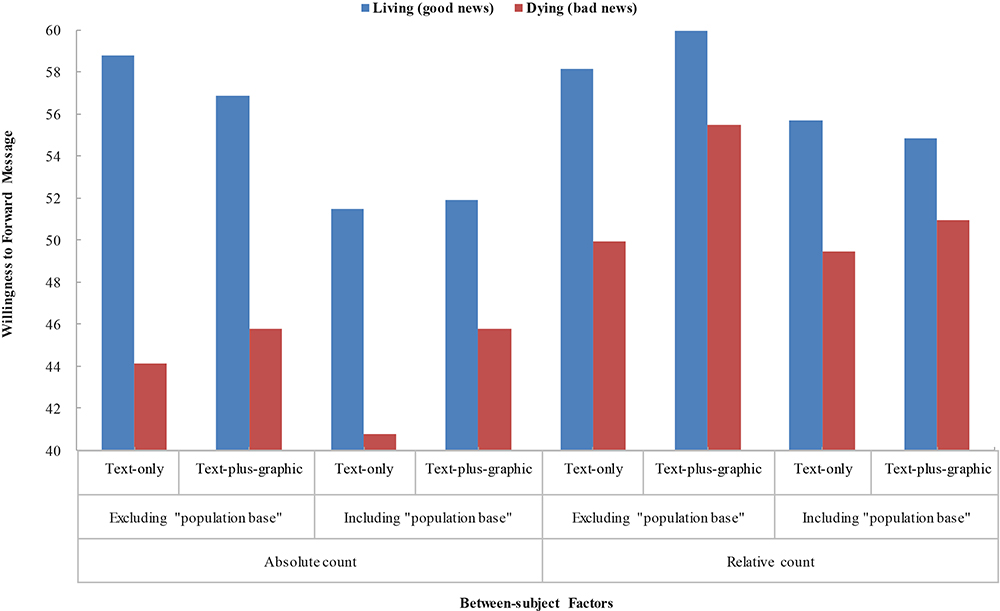 |
Figure 5 Graph showing the rated willingness to forward the message in WeChat Moments. |
Taken together, reporting pandemic information by using absolute count and/or the text-plus-graphic format could nudge people into lowering the level of risk perception and the negative emotion induced by bad news, raising the positive emotion induced by good news, while including the population base can lower the negative emotion induced by bad news, the positive emotion induced by good news, and the level of risk perception. In general, people preferred to forward good, rather than bad, news.
Discussion and Conclusions
Previous studies have shown that presenting the same information about threats, dangers, and risks in different ways (for example, mortality rates as opposed to survival rates) alters people’s perspectives and actions,17 thereby violating the axiom of description invariance.30 Subsequent studies have revealed that the provision of absolute count/frequency versus relative count/probability also can play an important role in changing people’s responses to medical information. Specifically, the communication of information between physicians and patients can be improved by using frequency rather than probability of occurrence.31
At a time when the impact of COVID-19 on people in China and elsewhere is raising much concern, we measured in real time the significance of frames used to present this information. The resultant findings demonstrate that the framing effect occurs on a large scale: When the pandemic information is represented by eight “logically equivalent” frames, people’s risk perceptions, emotional responses, and even their willingness to forward a message clearly varies, contrary to the assumption of description invariance.30
An awareness of these effects may help the media, health professionals, and government authorities communicate with the public effectively to enable them to better understand the risks involved and thus make balanced and appropriate decisions and actions. This awareness is important, especially when several media and government authorities select and report pandemic information arbitrarily. For instance, the National Health Commission of the PRC (http://www.nhc.gov.cn/) reports “confirmed cases,” “deaths,” and “cured cases” as basic data; the Public Health Agency of Sweden (https://www.folkhalsomyndigheten.se/the-public-health-agency-of-sweden/) reports “confirmed cases,” “intensive care cases,” and “deaths”; and the US Centers for Disease Control and Prevention (CDC; https://www.cdc.gov/) reports “confirmed cases” and “deaths.” Moreover, several countries or areas are prone to changing their information-releasing criteria. For example, according to a report in the Global Times on March 13, 2020, Sweden announced that it would stop counting the number of confirmed COVID-19 cases.32 Moreover, the US CDC has stopped reporting the number of Americans tested for COVID-19 since March 2, 2020.33 The basic pandemic information released and information frames adopted vary from country to country, which may inadvertently affect the public’s emotions and risk perception.
Therefore, based on the results of this study, we propose three practical solutions to improve the quality of communication.34
First, when reporting good news, representing information in the “absolute case” format is an effective frame for facilitating the maximisation of “positive emotions,” which in turn, may contribute to greater public confidence in fighting the pandemic.
Second, when reporting bad news, representing information using the “including population base” format is an effective frame for facilitating the minimisation of “negative emotions/risk perception,” which in turn, may help avoid panic responses among the general public.
Third, the framing effect can also be influenced by the graphical representation of options.25,35 Thus, representing information in the “text-plus-graphic” format works better than the “text-only” format in lowering the levels of risk perception/negative emotion, although with very small effect sizes, which in turn, may help to avoid exaggerated estimates of the risks associated with the pandemic.
In short, these findings offer some useful suggestions on how to disseminate information on a major pandemic. More broadly, our findings may contribute to improving our systems for the management of public health emergencies.
Limitations and Future Research Directions
There are a number of limitations to the present study which should be addressed in future research.36 Firstly, basic information was obtained only from official government channels (ie, the National Health Commission of the PRC) rather than the unofficial ones. Previous research suggested that news sources were critical in deciding the contents of messages journalists produce and present.21 Some unofficial news outlets, including so-called “fake news,” may have also affected people’s perceptions regarding COVID-19,1 as rumors and fake news can be considered a form of lying. As such, individuals might be compelled toward different actions (ie, risk-seeking or loss aversion) on the basis of their feelings induced by the information description frames (eg, loss frame).37 Thus, our results may be disturbed to some extent due to the emergence of unsubstantiated rumors in the early phase of COVID-19 in China. In future research, we can draw attention to whether and how people’s risk perception would be affected by the nature of the channel from which news is obtained. Examining these issues will help to further understand the impact of media communication on people’s risk perception when facing unknown risk.
Secondly, the use of online surveys to evaluate the public’s risk perception—similar to fields such as telemedicine and remote counselling in surgical fields—has gained great importance over the past year.38,39 It remains to be established in the future whether the resulting effect obtained by online surveys can be as effective as that of the conventional in-person survey, and whether the resulting effect obtained in the initial phase can be generalized.
Data Sharing Statement
The data that support the findings of this study are available via Open Science Framework at https://osf.io/spmy2/?view_only=5694966f3653490b8edf81a013b49076.
Acknowledgments
This study was partially supported by the National Natural Science Foundation of China (No. 71761167001), the Major Projects of the National Social Science Foundation of China (Nos. 19ZDA358, 18ZDA332, and 17ZDA325), the Key Project of the National Social Science Foundation of China (No. 16AZD058) and by the Key Project of the Chinese Academy of Sciences (No. KFJ-FP-201906). The funders had no role in study design, data collection and analysis, decision to publish, or preparation of the manuscript. We have no known conflict of interest to disclose.
Disclosure
All authors declare no competing interests.
References
1. La V-P, Pham T-H, Ho M-T, et al. Policy response, social media and science journalism for the sustainability of the public health system amid the COVID-19 outbreak: the Vietnam lessons. Sustainability. 2020;12(7):2931. doi:10.3390/su12072931
2. Hart PS, Chinn S, Soroka S. Politicization and polarization in COVID-19 news coverage. Sci Commun. 2020;42(5):679–697. doi:10.1177/1075547020950735
3. Kim E, Shepherd ME, Clinton JD. The effect of big-city news on rural America during the COVID-19 pandemic. Proc Natl Acad Sci USA. 2020;117(36):22009–22014. doi:10.1073/pnas.2009384117
4. Chen H, Huang X, Li Z. A content analysis of Chinese news coverage on COVID-19 and tourism. Curr Issues Tour. 2020;1–8. doi:10.1080/13683500.2020.1763269
5. Huynh TLD. The COVID-19 risk perception: a survey on socioeconomics and media attention. Econ Bull. 2020;40(1):758–764.
6. Bavel JJV, Baicker K, Boggio PS, et al. Using social and behavioural science to support COVID-19 pandemic response. Nat Hum Behav. 2020;4(5):460–471. doi:10.1038/s41562-020-0884-z
7. Loewenstein GF, Weber EU, Hsee CK, Welch N. Risk as feelings. Psychol Bull. 2001;127(2):267–286. doi:10.1037/0033-2909.127.2.267
8. Slovic P, Finucane ML, Peters E, MacGregor DG. Risk as analysis and risk as feelings: some thoughts about affect, reason, risk, and rationality. Risk Anal. 2004;24(2):311–322. doi:10.1111/j.0272-4332.2004.00433.x
9. Rottenstreich Y, Hsee CK. Money, kisses, and electric shocks: on the affective psychology of risk. Psychol Sci. 2001;12(3):185–190. doi:10.1111/1467-9280.00334
10. Paulos JA. Innumeracy: Mathematical Illiteracy and Its Consequences. Macmillan; 1988.
11. Huynh TLD. If you wear a mask, then you must know how to use it and dispose of it properly!: a survey study in Vietnam. RBE. 2020;7(2):145–158. doi:10.1561/105.00000121
12. Li S, Li J-L, Yang S-W, et al. The psychological typhoon eye effect in responses to terrorism. J Pac Rim Psychol. 2020;14:e21. doi:10.1017/prp.2020.13
13. Wei Z-H, Tao R, Liu H, Li S. Freedom from fear and want and our psychological response to environmental changes. J Pac Rim Psychol. 2017;11:e10. doi:10.1017/prp.2017.11
14. Xu M-X, Zheng R, Rao -L-L, et al. Proposals for coping with “psychological typhoon eye” effect detected in COVID-19. Bull Chin Acad Sci. 2020;35(3):273–282. doi:10.16418/j.issn.1000-3045.20200226001
15. Yang S-W, Xu M-X, Kuang Y, et al. Objective danger and subjective panic in Wuhan COVID-19: an extended overseas “psychological typhoon eye” effect. Chin J Appl Psychol. 2020;26(4):291–297.
16. Ha TM, Shakur S, Pham Do KH. Food risk in consumers’ eye and their consumption responses: evidence from Hanoi survey. J Asia Bus Econ Stud. 2020;ahead-of-print(ahead–of–print). doi:10.1108/JABES-12-2019-0126
17. Tversky A, Kahneman D. The framing of decisions and the psychology of choice. Science. 1981;211(4481):453–458. doi:10.1126/science.7455683
18. Gong J, Zhang Y, Yang Z, Huang Y, Feng J, Zhang W. The framing effect in medical decision-making: a review of the literature. Psychol Health Med. 2013;18(6):645–653. doi:10.1080/13548506.2013.766352
19. McNeil BJ, Pauker SG, Sox HC, Tversky A. On the elicitation of preferences for alternative therapies. N Engl J Med. 1982;306(21):1259–1262. doi:10.1056/NEJM198205273062103
20. Stauffacher M, Muggli N, Scolobig A, Moser C. Framing deep geothermal energy in mass media: the case of Switzerland. Technol Forecast Soc Change. 2015;98:60–70. doi:10.1016/j.techfore.2015.05.018
21. Gabore SM. Western and Chinese media representation of Africa in COVID-19 news coverage. Asian J Commun. 2020;30(5):299–316. doi:10.1080/01292986.2020.1801781
22. Iyengar S. Television news and citizens’ explanations of national affairs. Am Polit Sci Rev. 1987;81(3):815–831. doi:10.2307/1962678
23. Kapuściński G, Richards B. News framing effects on destination risk perception. Tour Manag. 2016;57:234–244. doi:10.1016/j.tourman.2016.06.017
24. Sher S, McKenzie CRM. Information leakage from logically equivalent frames. Cognition. 2006;101(3):467–494. doi:10.1016/j.cognition.2005.11.001
25. Sun Y, Li S, Bonini N, Su Y. Graph‐framing effects in decision making. J Behav Decis Mak. 2012;25(5):491–501. doi:10.1002/bdm.749
26. Simmons JP, Nelson LD, Simonsohn U. A 21 word solution. SSRN J. 2012. doi:10.2139/ssrn.2160588
27. Cohn D. Sample surveys and the 1940 census; April 2, 2012. Available from: https://www.pewresearch.org/social-trends/2012/04/02/sample-surveys-and-the-1940-census/.
28. Watson D, Clark LA, Tellegen A. Development and validation of brief measures of positive and negative affect: the PANAS scales. J Pers Soc Psychol. 1988;54(6):1063–1070. doi:10.1037/0022-3514.54.6.1063
29. Steiger JH. Beyond the F test: effect size confidence intervals and tests of close fit in the analysis of variance and contrast analysis. Psychol Methods. 2004;9(2):164–182. doi:10.1037/1082-989X.9.2.164
30. Camerer CF. Progress in behavioral game theory. J Econ Perspect. 1997;11(4):167–188. doi:10.1257/jep.11.4.167
31. Hoffrage U, Gigerenzer G. Using natural frequencies to improve diagnostic inferences. Acad Med. 1998;73(5):538–540. doi:10.1097/00001888-199805000-00024
32. Global Times [@globaltimesnews]. #Sweden announced it would stop counting the number of confirmed #COVID19 cases. People not in hospital or not a high-risk group will not be tested for #coronavirus infection in the future: reports; March 13, 2020. Available from: https://twitter.com/globaltimesnews/status/1238430039882059778.
33. Griggs MB. CDC drops coronavirus testing numbers from their website; March 2, 2020. Available from: https://www.theverge.com/2020/3/2/21161693/cdc-coronavirus-testing-numbers-website-disappear-expansion-us.
34. Vuong Q-H. The (ir)rational consideration of the cost of science in transition economies. Nat Hum Behav. 2018;2(1):5. doi:10.1038/s41562-017-0281-4
35. Sun Y, Li S, Bonini N, Liu Y, Gasparini M. Effect of graph scale on risky choice: evidence from preference and process in decision-making. PLoS One. 2016;11(1):e0146914. doi:10.1371/journal.pone.0146914
36. Vuong Q-H. Reform retractions to make them more transparent. Nature. 2020;582(7811):149. doi:10.1038/d41586-020-01694-x
37. Huynh TLD. Replication: cheating, loss aversion, and moral attitudes in Vietnam. J Econ Psychol. 2020;78:102277. doi:10.1016/j.joep.2020.102277
38. Gambardella C, Pagliuca R, Pomilla G, Gambardella A. COVID-19 risk contagion: organization and procedures in a South Italy geriatric oncology ward. J Geriatr Oncol. 2020;11(7):1187–1188. doi:10.1016/j.jgo.2020.05.008
39. Tolone S, Gambardella C, Brusciano L, Del Genio G, Lucido FS, Docimo L. Telephonic triage before surgical ward admission and telemedicine during COVID-19 outbreak in Italy. Effective and easy procedures to reduce in-hospital positivity. Int J Surg. 2020;78:123–125. doi:10.1016/j.ijsu.2020.04.060
 © 2021 The Author(s). This work is published and licensed by Dove Medical Press Limited. The
full terms of this license are available at https://www.dovepress.com/terms
and incorporate the Creative Commons Attribution
- Non Commercial (unported, 3.0) License.
By accessing the work you hereby accept the Terms. Non-commercial uses of the work are permitted
without any further permission from Dove Medical Press Limited, provided the work is properly
attributed. For permission for commercial use of this work, please see paragraphs 4.2 and 5 of our Terms.
© 2021 The Author(s). This work is published and licensed by Dove Medical Press Limited. The
full terms of this license are available at https://www.dovepress.com/terms
and incorporate the Creative Commons Attribution
- Non Commercial (unported, 3.0) License.
By accessing the work you hereby accept the Terms. Non-commercial uses of the work are permitted
without any further permission from Dove Medical Press Limited, provided the work is properly
attributed. For permission for commercial use of this work, please see paragraphs 4.2 and 5 of our Terms.