Back to Journals » Pharmacogenomics and Personalized Medicine » Volume 11
Which attributes of whole genome sequencing tests are most important to the general population? Results from a German preference study
Authors Plöthner M, Schmidt K ![]() , Schips C, Damm K
, Schips C, Damm K ![]()
Received 23 August 2017
Accepted for publication 13 December 2017
Published 14 February 2018 Volume 2018:11 Pages 7—21
DOI https://doi.org/10.2147/PGPM.S149803
Checked for plagiarism Yes
Review by Single anonymous peer review
Peer reviewer comments 2
Editor who approved publication: Dr Martin Bluth
Marika Plöthner, Katharina Schmidt, Clarissa Schips, Kathrin Damm
Leibniz University of Hannover, Center for Health Economics Research Hannover (CHERH), Germany
Objective: The aim of this study was to identify the preferences for whole genome sequencing (WGS) tests without genetic counseling.
Methods: A discrete choice experiment was conducted where participants chose between two hypothetical alternatives consisting of the following attributes: test accuracy, test costs, identified diseases, probability of disease occurrence, and data access. People from the general German population aged ≥18 years were eligible to participate in the survey. We estimated generalized linear mixed effects models, latent class mixed-logit models, and the marginal willingness to pay.
Results: Three hundred and one participants were included in the final analysis. Overall, the most favored WGS testing attributes were 95% test accuracy, report of severe hereditary diseases and 40% probability of disease development, test costs of €1,000, and access to test results for researchers. Subgroup analysis, however, showed differences in these preferences between males and females. For example, males preferred reporting of results at a 10% probability of disease development and females preferred reporting of results at a 40% probability. The test cost, participant’s educational level, and access to data influenced the willingness to participate in WGS testing in reality.
Conclusion: The German general population was aware of the importance of genetic research and preferred to provide their own genetic data for researchers. However, among others, the reporting of results with a comparatively relatively low probability of disease development at a level of 40%, and the test accuracy of 95% had a high preference. This shows that the results and consequences of WGS testing without genetic counseling are hard to assess for individuals. Therefore, WGS testing should be supported by qualified genetic counseling, where the attributes and consequences are explained.
Keywords: whole genome sequencing, discrete choice experiment, genetic testing, preferences, willingness to pay, latent class model
Introduction
In the past 10 years, significant progress has been achieved in the fields of genomics and genetics.1 The usage of genetic information has steadily increased in medical research, diagnosis, and therapy. Essential drivers for this development are as follows: 1) technological progress such as next-generation sequencing (NGS) technologies, 2) the reduction in costs of sequencing,2 3) growth in population and clinical-based biobanks,3 and 4) the increasing knowledge of genotype–phenotype correlations based on genome-wide association studies (GWAS).4
Genetic information is essential for personalized medicine. This knowledge enables preventive health care management as well as the administration of personalized and targeted therapies based on an individual’s genetic characterization.5 The scope of analysis (gene, panel, exome, or whole genome sequencing [WGS]) and the amount of genetic data vary with the aim of the investigation. WGS provides an opportunity to identify almost all disease-causing variants.6 For this reason, WGS seems to be the most appropriate method for comprehensive predictive analysis.
In recent years, the suitability of WGS as a screening tool has been discussed, especially in newborn7 or population-based screening.8 Notwithstanding the economic (eg, clinical utility),9 ethical, and legal debates (eg, information of self-determination),10 the detection of rare and/or highly penetrant diseases before the onset of disease may have considerable advantages. For example, previous surveys indicated that early diagnosis of cystic fibrosis11 or Lynch syndrome12 is beneficial for treatment, and the knowledge of predispositions to oncological and cardiovascular diseases can be useful for prevention. Knowledge of a BRCA I/BRCA II mutation allows the development of a prevention strategy including regular checkups and mastectomy.13
Several studies showed that people are interested in genetic testing.14–16 They want to take a proactive role in preventive health care management for themselves as well as for their family members.17 However, WGS testing aimed at primary prevention without a suspected disease is generally not covered by health insurance plans (eg, in Germany). Genetic analysis distributed via the Internet is a less expensive alternative than the conventional market.18 Such offers often lack qualified genetic counseling,19 which is essential for an informed decision regarding WGS testing. Qualified genetic counseling supports complex decision-making with regard to the following questions: Do the results affect my family members? Who has access to my genetic information? What is the potential for genetic discrimination (eg, in terms of insurability)? Am I willing to pay for the testing out-off-pocket? Do I want to know the probability of developing all diseases or only the probability of developing treatable diseases? How sensitive is the test?
For the purpose of identifying relevant attributes of online WGS testing, we conducted a discrete choice experiment (DCE) to evaluate the preferences of the general population. We investigated the people’s preference estimates without prior qualified genetic counseling. We analyzed 1) the preferences of our study population and subgroup effects (eg, sociographic characteristics, genetic predisposition, and desire for children), 2) the willingness to pay of these subgroups, and 3) factors influencing the willingness to take part in WGS tests.
Methods
DCE
We conducted a DCE to measure the preferences for WGS testing. A DCE is a de-compositional approach to the measurement of stated preferences. Participants have to choose between hypothetical alternatives. One alternative consists of several attributes with varying levels.20 The attributes are characteristics of the alternatives that are specified by their levels for each alternative.
Attributes and levels
First, we conducted a literature search to achieve a comprehensive overview of the available attributes of WGS. However, no literature focusing on preferences for WGS attributes could be identified. Hence, we adopted relevant attributes from actual discussions and literature focused on genetic analysis. The final relevant attributes for the DCE were “test accuracy”,21 “test cost”,22 report of results23–25 (divided into “identified diseases” and “probability of occurrence”), and “access to data”.26 The range of levels was also determined by specific discussion points or based on the literature on the subject. Finally, attributes and levels were discussed with experts. To improve the validity and reliability of each item, a pretest of the questionnaire was conducted with 11 people. Table 1 illustrates the attributes and their corresponding levels. The attributes and levels are explained using colloquial language and icons, and they were adjusted after the pretest.
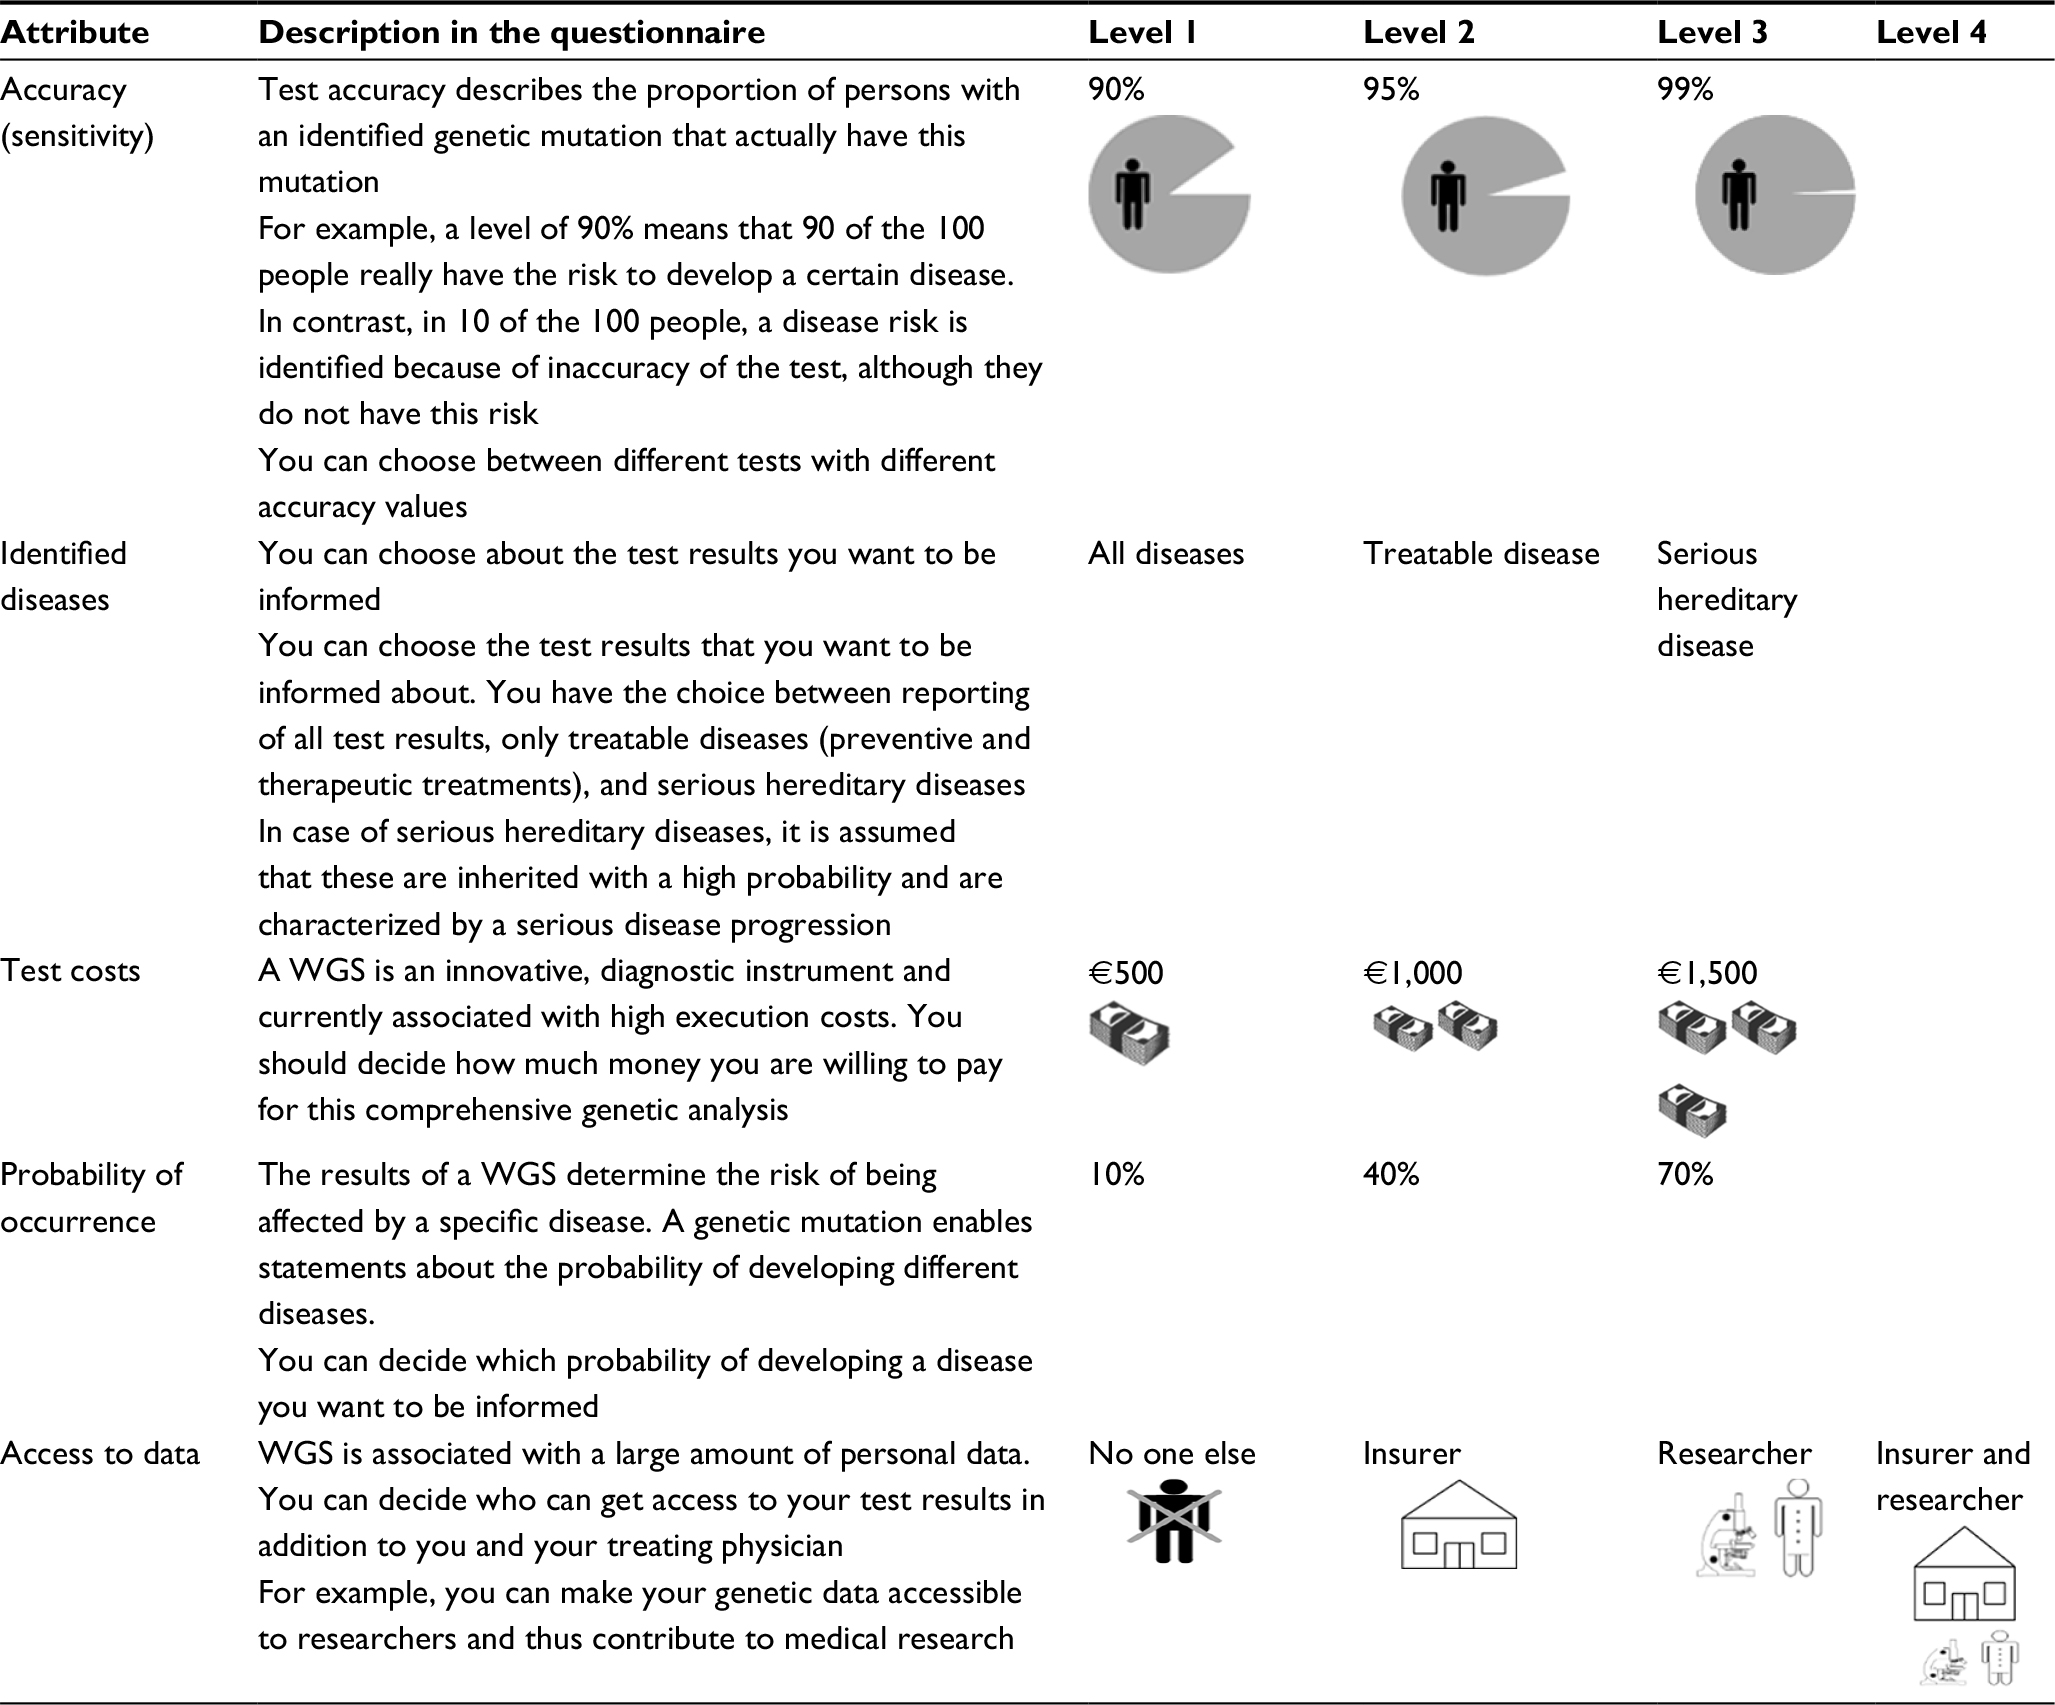 | Table 1 Overview of attributes with the corresponding levels Abbreviation: WGS, whole genome sequencing. |
Data collection and recruitment
People from the German general population aged ≥18 years were eligible to participate in the survey. It was an online survey via Facebook and Xing that was conducted from June to August 2016, as well as by direct (and random) approach of passersby with a paper–pencil questionnaire at the main railway station in the city of Hannover (northwestern Germany). We used a simple random sampling strategy and did not select participants according to age and sociodemographic or economic status. We obtained study approval from the ethics committee of Hannover Medical School (Re No 3325-20016) prior to the start of the survey. To take part in the study, participants had to give written informed consent.
Questionnaire
The final questionnaire consisted of three sections. The first part was the DCE choice sets. In total, the attributes and levels resulted in 34×41=324 possible combinations (four attributes with three levels and one attribute with four levels).20 To generate feasible choice sets of the DCE, a D-efficient fractional factorial design (reduced design) was created using the R statistical program. The best D-efficiency occurred for 18 choice sets. To avoid overstraining of the participants, we divided the 18 choice sets into two questionnaires (blocking). Therefore, participants answered nine DCE decisions with two alternatives (called Test 1 and Test 2) each. Additionally, we asked whether the participant would carry out the chosen test in reality (refer the example of the choice in Figure 1). The second part focused on sociodemographic questions, such as sex, age, education, occupation, monthly net income, and insurance company (statutory or private). The third part included questions about overall health status, prevention behavior, hereditary diseases, and desire for children.
 | Figure 1 Example of a choice set. Notes: Explanation for the example choice set: The participant could choose between test 1 and test 2. Test 1 is characterized by a lower test accuracy (95%), with the reporting of treatable results at a 10% probability of disease occurrence as well as higher cost (€1,500), and the access for insurer. Test 2 is designed with a higher accuracy (99%), with the reporting of serious hereditary diseases at a higher probability of disease occurrence (70%) and at lower cost (€500). Furthermore, in test 2, no one else had access to the test results. The participant has to trade-off between a test accuracy of 95 and 99%, the costs of €1,500 and €500, and so on. |
Data analysis
Following survey completion, we cleaned the data set and determined descriptive statistics for the variables (median, standard deviation [SD], and percentages). We tested the potential independent variables for multicollinearity to reduce the bias of the results. In the multivariate analyses, we applied generalized linear mixed-effects models (GLMMs) and latent class mixed logit models (LCMLMs) to identify systematic or group differences for the participants’ WGS preferences. The choice of an alternative between two hypothetical WGS tests (choice) was used as the dependent variable, whereas the attributes and levels were the independent variables in all models. In addition, personal characteristics of the participants were used as independent variables, mixed effects (taking into account that personal characteristics influence the response behavior and therefore including subgroup specific “baseline” values [random intercept] or slope adjustments [random slope] for some of the independent variables in addition to the fixed effects), or class-membership effects (for LCMLM). We calculated the average marginal willingness to pay (mWTP) for each attribute by dividing the coefficients for the other attributes by the coefficient of the cost attribute (test costs). Therefore, we used the attributes as metric independent variables in conditional logit models and conducted the mWTP analysis separately for the different classes from the LCMLM analyses. Coefficients of attributes above zero were favored, and negative coefficients were disfavored. The 95% confidence intervals (CIs) are based on the Krinsky and Robb27 method.
We calculated the GLMM for participants willing to participate in reality (potential users) and the full sample separately, so that any differences between these two groups could be identified. In the GLMM, we used the set ID (identification number of the choice set) as a mixed effect to inform the model about which of the alternatives formed a set. Finally, we investigated the factors influencing the willingness to participate in genetic testing in reality. Therefore, we applied another GLMM based on the variable “real” as a dependent variable. The random effect used in this model was the person identifier (PersonID) to enable us to investigate influencing participants’ characteristics and test characteristics based on the decision. An overview of used variables is provided in Table S1.
We tested different independent variables and mixed effects in the models (Table S2) and chose the model with the best fit for data based on Akaike and Bayesian information criteria. All analyses were conducted with R statistics 3.1.2 and the packages “lme4” (for GLMM), “lcmm” (for LCMLM), and “support.CEs” (for mWTP analyses).
Results
Descriptive statistics
In total, 323 people participated in the study and 301 people could be included in the DCE analyses. All sample characteristics are provided in Table 2. Twenty-two participants had to be excluded because of missing data for all DCE tasks or an age of <18 years. The sample consisted of 69% women, and the median age was 28 years. The educational level was higher compared to that of the general population of Germany,28 but the average amount of income was similar.29 Both facts indicated that the proportion of students was higher compared to the general population. The majority (56%) of the participants were in good health.
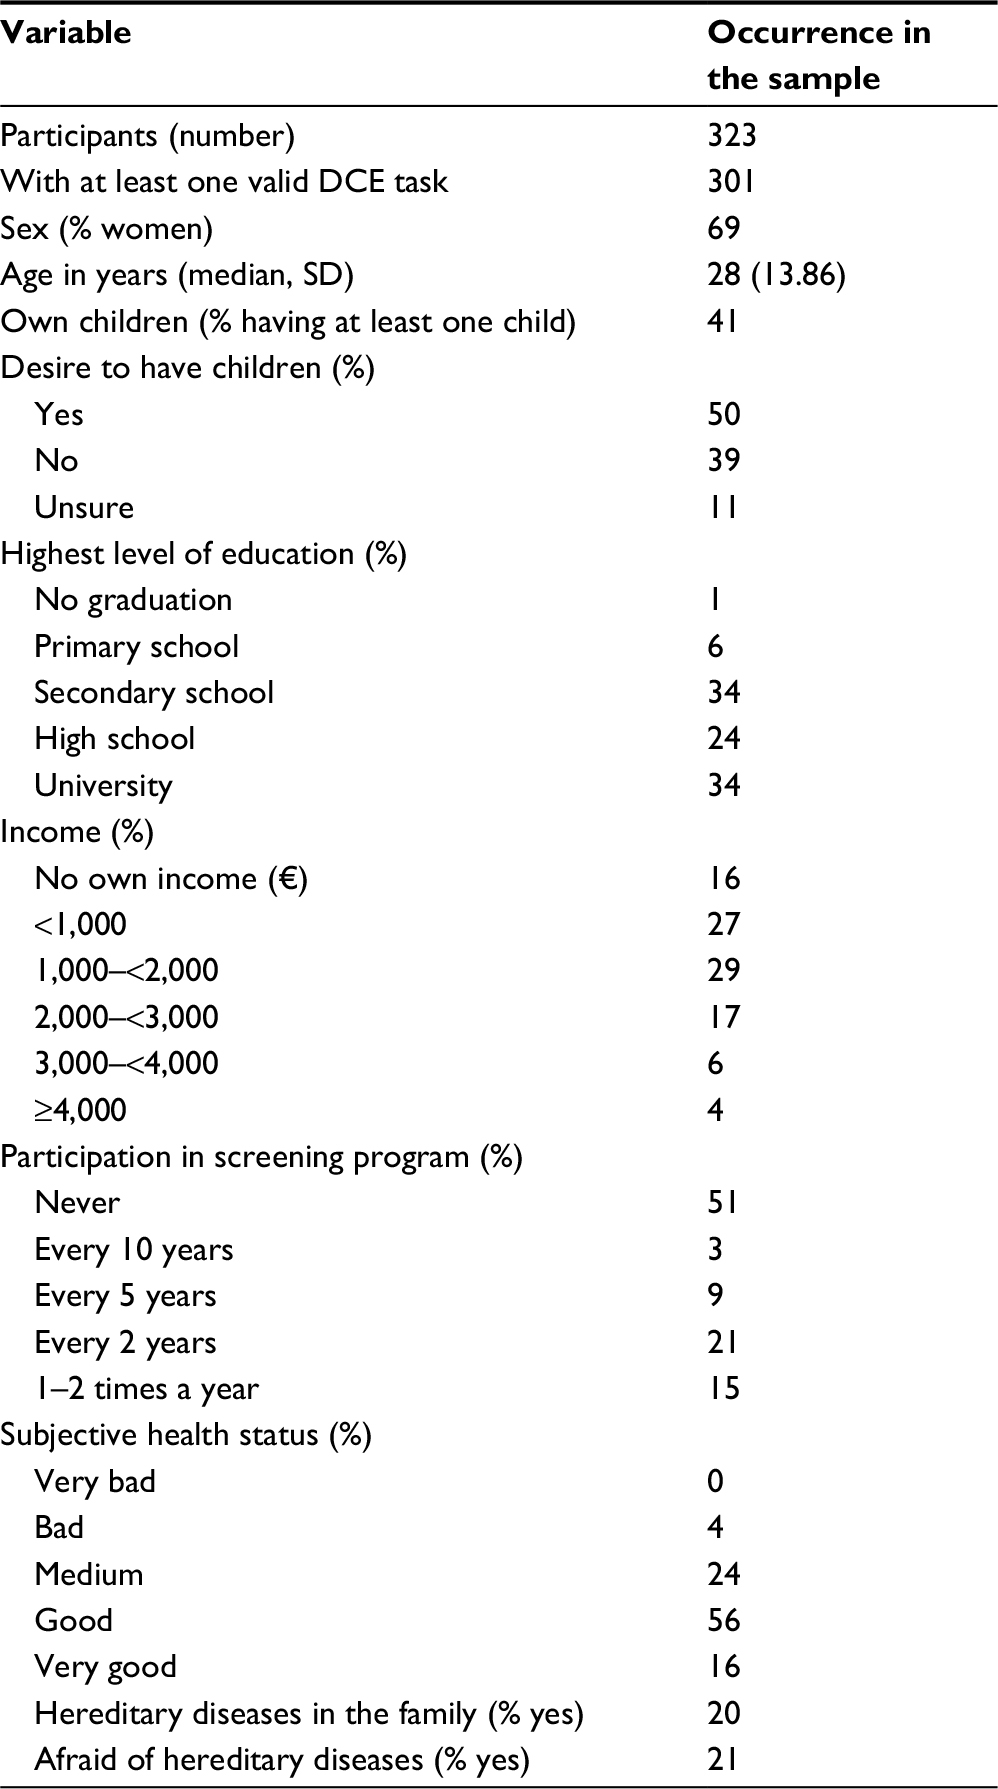 | Table 2 Sample description Note: Median: average. Abbreviations: DCE, discrete choice experiment; SD, standard deviation. |
In a second step, we prepared the data for the multivariate analyses. We found strong correlations between age and employment status, having children and employment status, and age and desire to have a child (refer correlation plot in Figure S1). Therefore, we adapted the models for these correlations due to not using both correlating variables in one model or due to including interaction effects between the correlating variables.
Subgroup-specific preferences for WGS tests
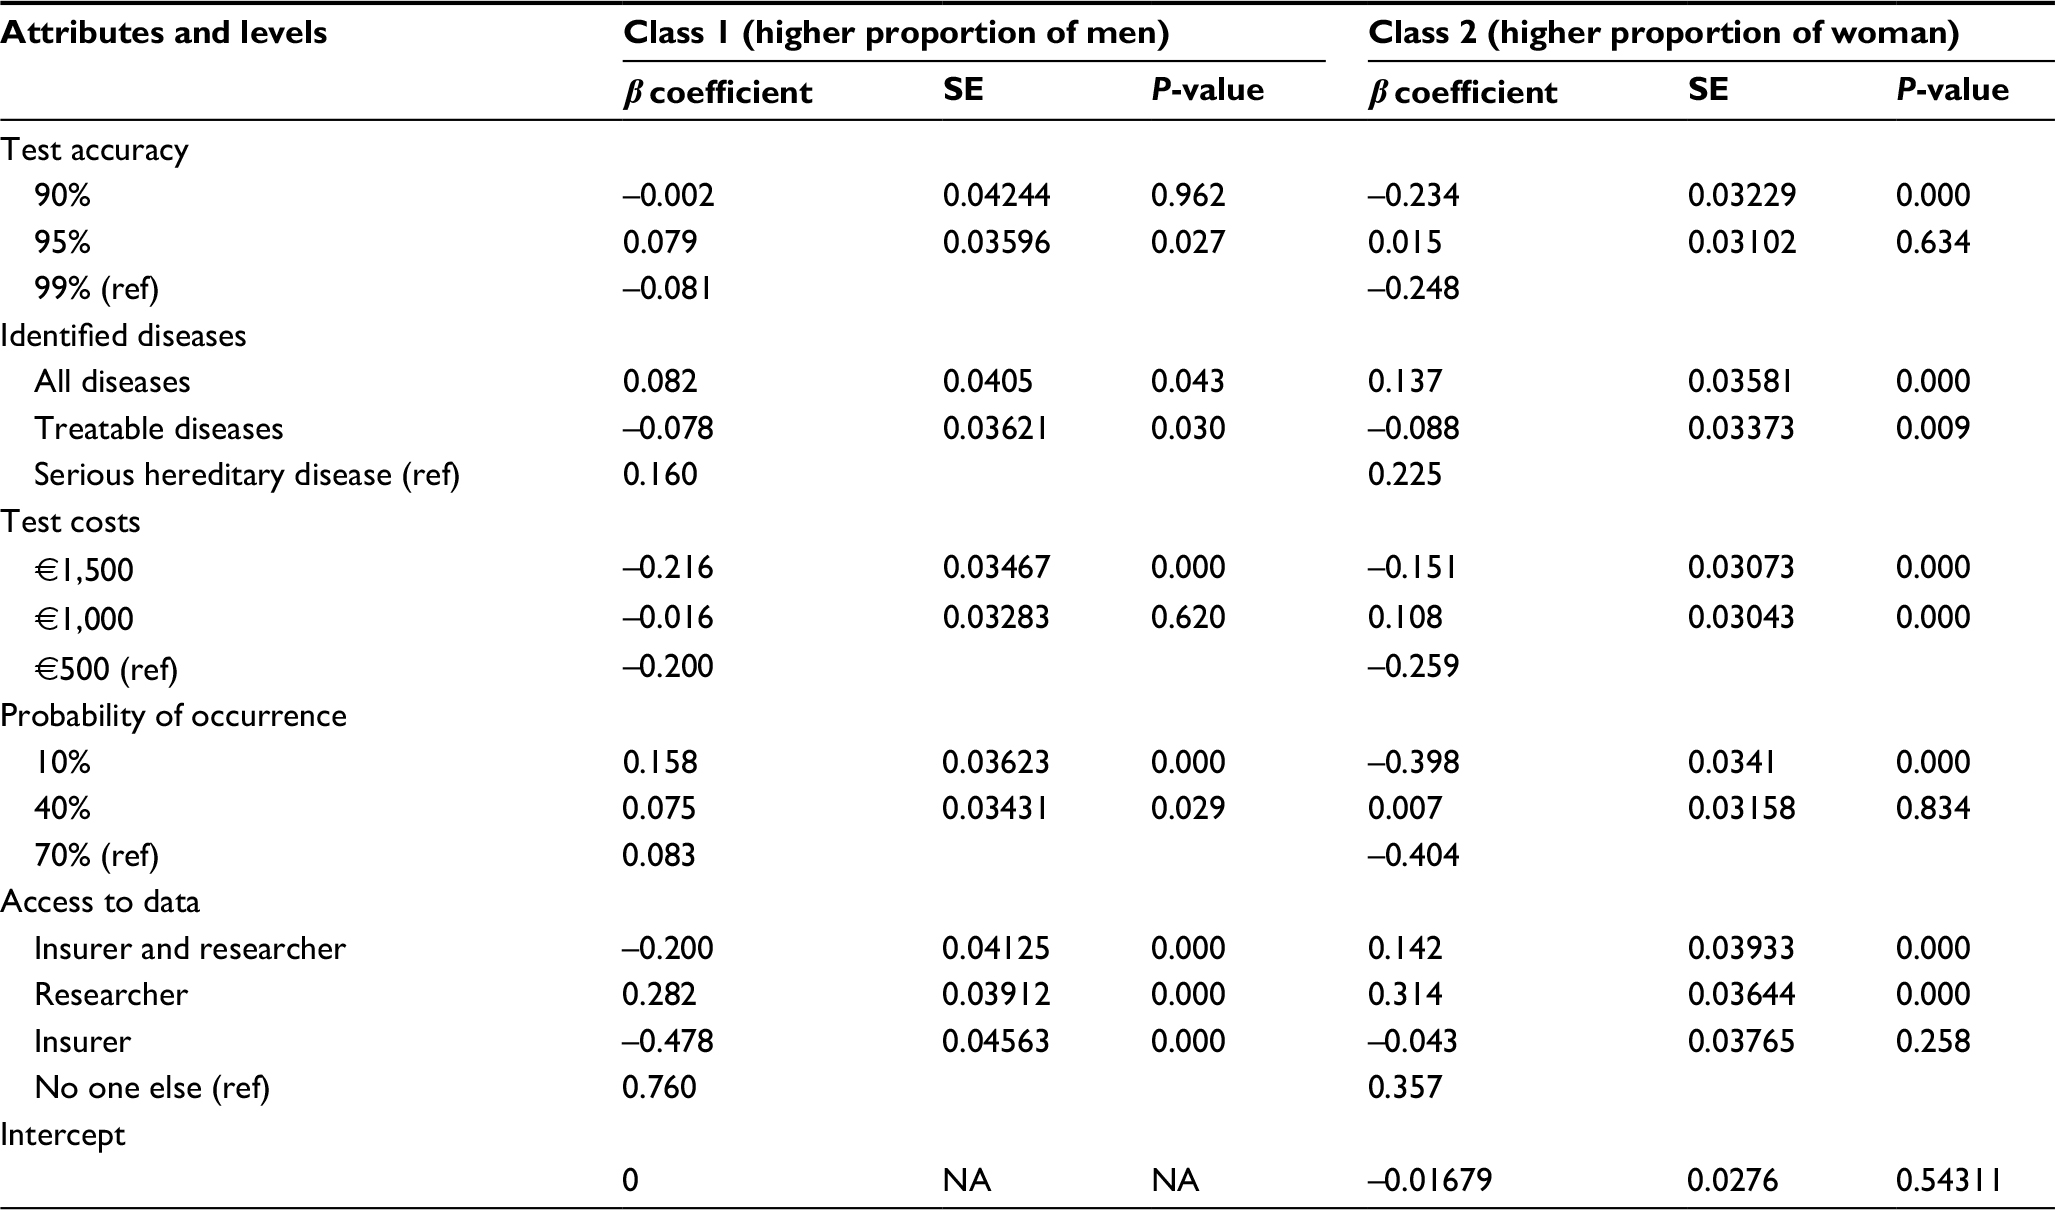
In the LCMLM, we identified two classes that differed in regard to their preferences for genetic testing (Figure 2 and Table S3). Class 1 comprised 46.13% (n=137) of the sample. The only significant differentiator between the people in the two classes was their sex. The proportion of women was significantly lower in class 1 than in class 2 (refer the table in Figure 2). The educational level, health status, and income are relevant for the class membership but did not show significant differences between the classes.
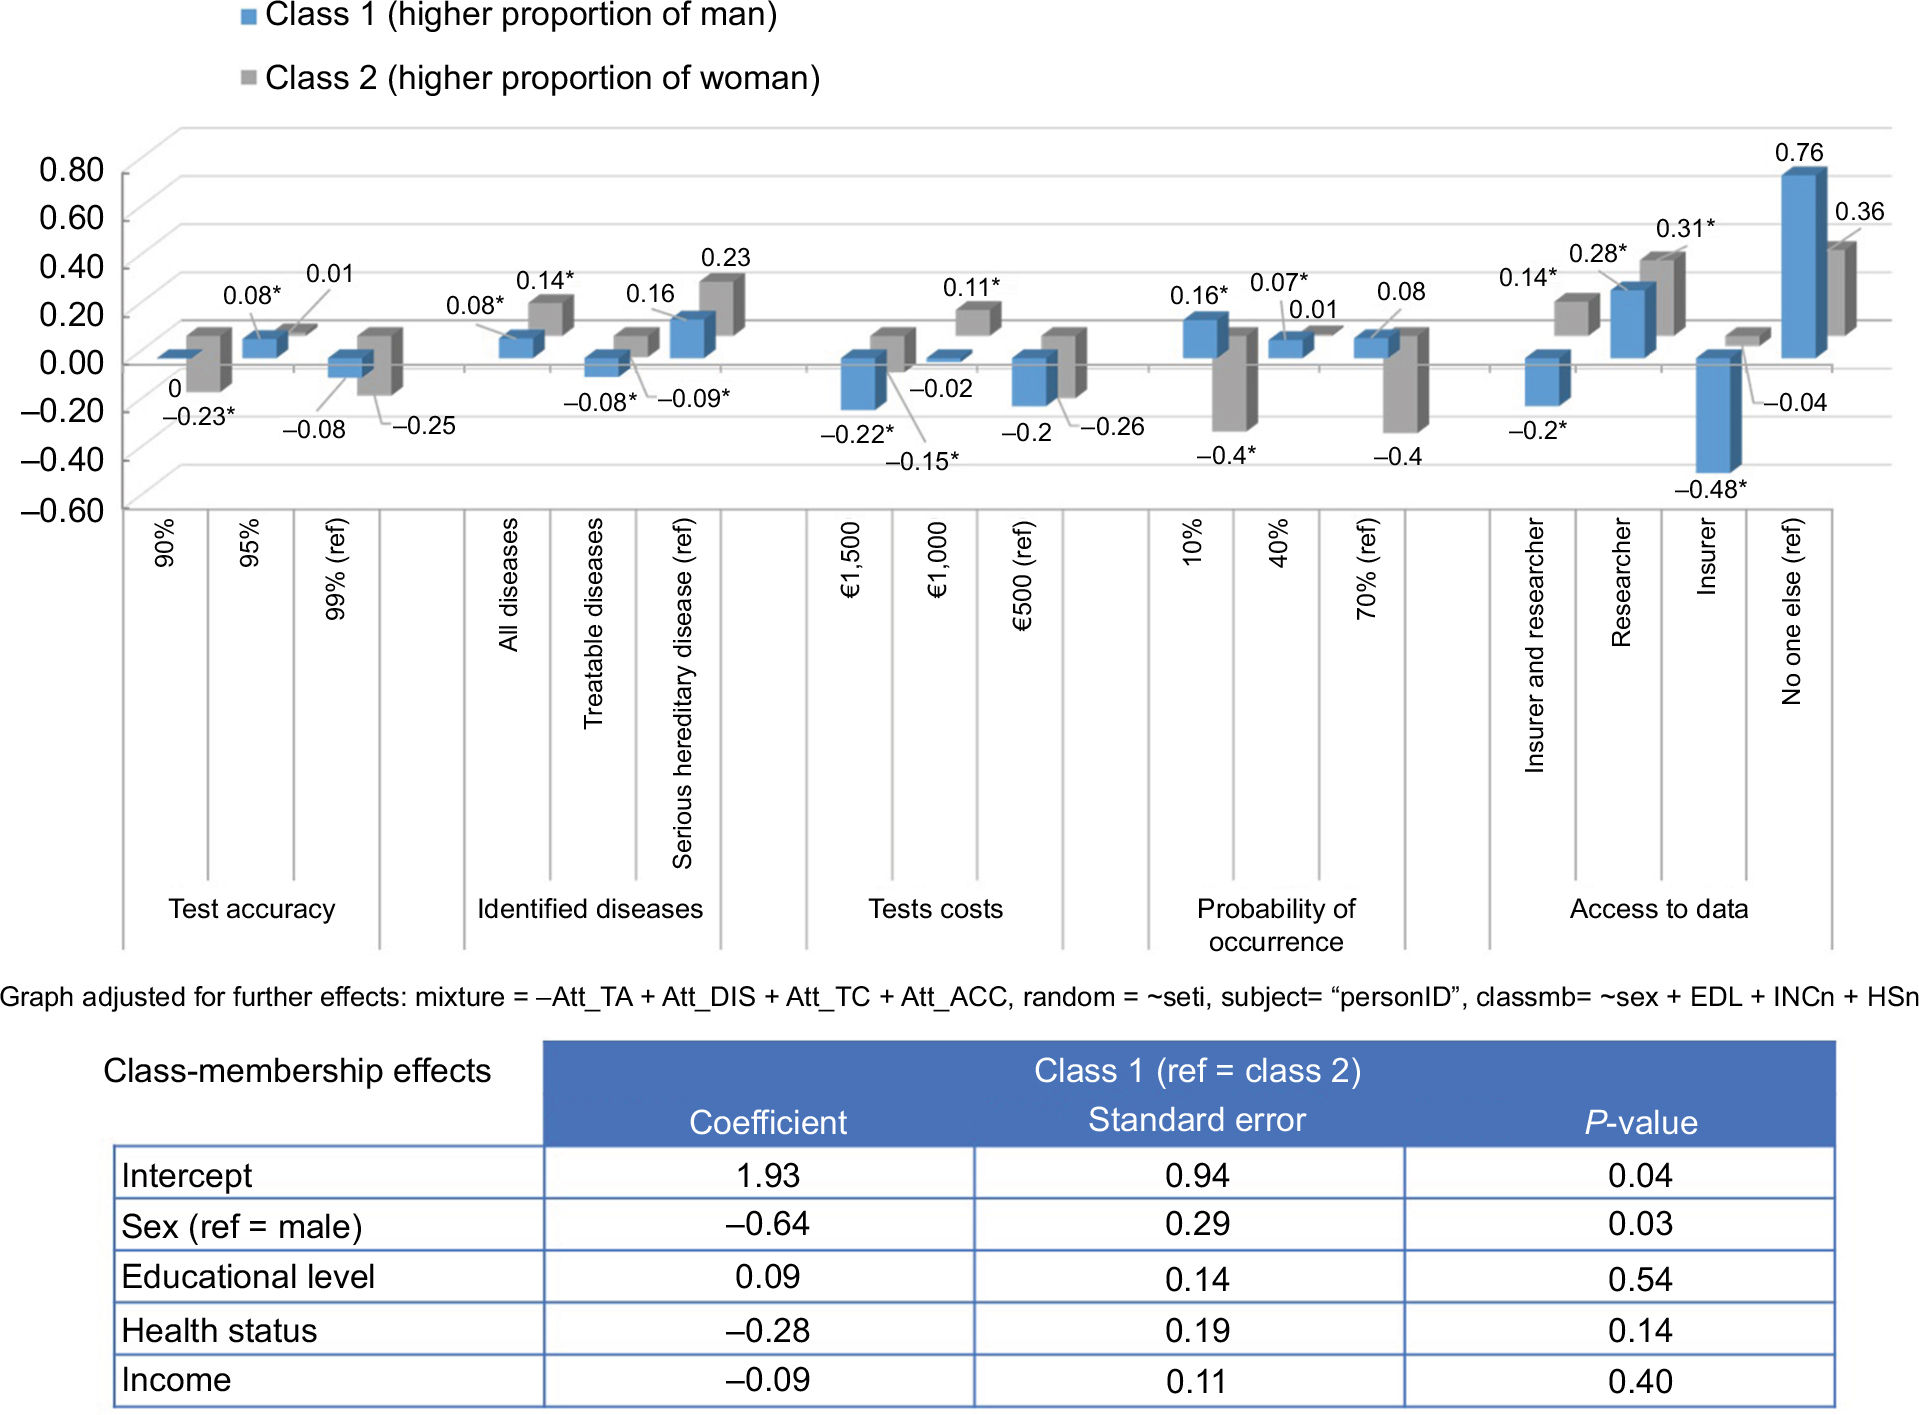 | Figure 2 LCMLM for preferences concerning genetic testing – attribute effects. Note: *Significant values (P<0.05). Abbreviations: EDL, educational level; HSn, health status (numeric); INCn, income (numeric); LCMLM, latent class mixed logit model. |
In class 1, a higher proportion of men compared to the other classes strongly preferred the restricted “access to data only for themselves” (bclass 1,access no=0.76, reference level) and disfavored the “access to data for insurer” the most (bclass 1,access ins=-0.48, P < 0.001). They also disfavored any “test costs” where €1,000 had a utility weight of ~0 but was not significant. Class 1 preferred “serious hereditary diseases identified” and a “10% probability of occurrence” (bclass 1, ser.d=0.16, βclass 1, 10% occ=0.16, P<0.001) (Figure 2). In contrast, class 2 disfavored “10% and 70% probability of occurrence” but also preferred “serious hereditary diseases identified”. Indeed, the highest preferences occurred for access to data only for themselves and “for researchers” (bclass 2, access no=0.36, reference level; bclass 2, access res=0.31, P<0.001). Class 2 also preferred “access to data only for insurer and researcher”. Class 2 disfavored “90% and 99% test accuracy” and showed a significant positive utility for “€1,000 test costs”.
To conclude, men emphasized the importance of access to data only for themselves and favored a test with 95% accuracy also for diseases with a low probability of occurrence. The class with a higher proportion of women favored instead a test that identifies serious hereditary diseases, where test costs on the intermediate level arise, and that enables data access for themselves or researchers.
In addition, we calculated the mWTP for each attribute, separated for class 1 and class 2 from the LCMLM (Table 3). The mWTP showed different starting points for class 1 and class 2 models (interceptclass 1: €786.3 and interceptclass 2: €-1,931.3). From this, it can be concluded that people in class 2 were willing to pay less money for genetic testing than those in class 1. Furthermore, class 2 was willing to pay on average €740 for an increase of one unit (90%–95% or 95%–99%) in test accuracy (CI: €489.5; €1,218.2) and on average €1,500 (€1,071.5; €2,435.5) for diseases with higher probability of occurrence. In contrast, the mWTP was negative for the identified diseases (€-303.7 [€-560.2; €-127.1]) and the access to data (€-383.8 [€-645.3; €-228.7]). Therefore, people were willing to receive monetary compensation for identifying only treatable and hereditary diseases. Class 1 was willing to pay on average less for a higher test accuracy, although the monetary value was still positive (intercept €786–128=€658 for a change from 90% to 95%). In addition, this class showed negatively associated mWTP for identified diseases (€-164.6 [€-289.7; €-45.1]) and the probability of occurrence (€-502.3 [€-707.4; €-356.8]). In contrast, class 1 was willing to pay ~€723 [€561.2; €967.9] more for less access to data.
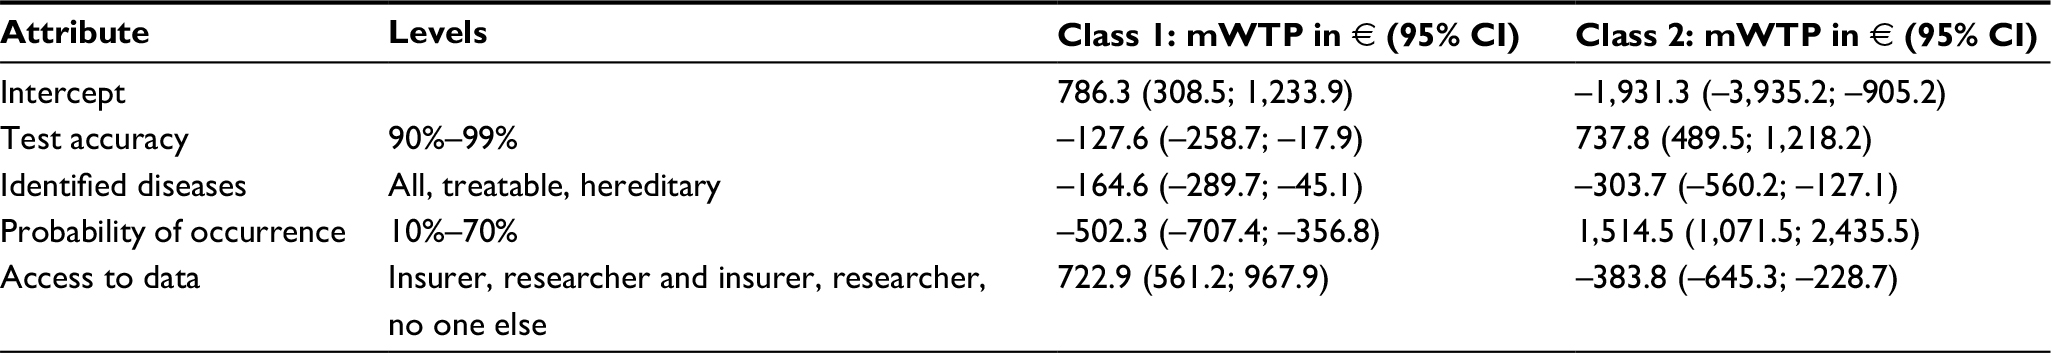 | Table 3 Marginal willingness of classes to pay for test attributes Note: Class 1: higher proportion of men; Class 2: higher proportion of women. Abbreviations: CI, confidence interval; mWTP, marginal willingness to pay. |
Analysis of participation in genetic testing
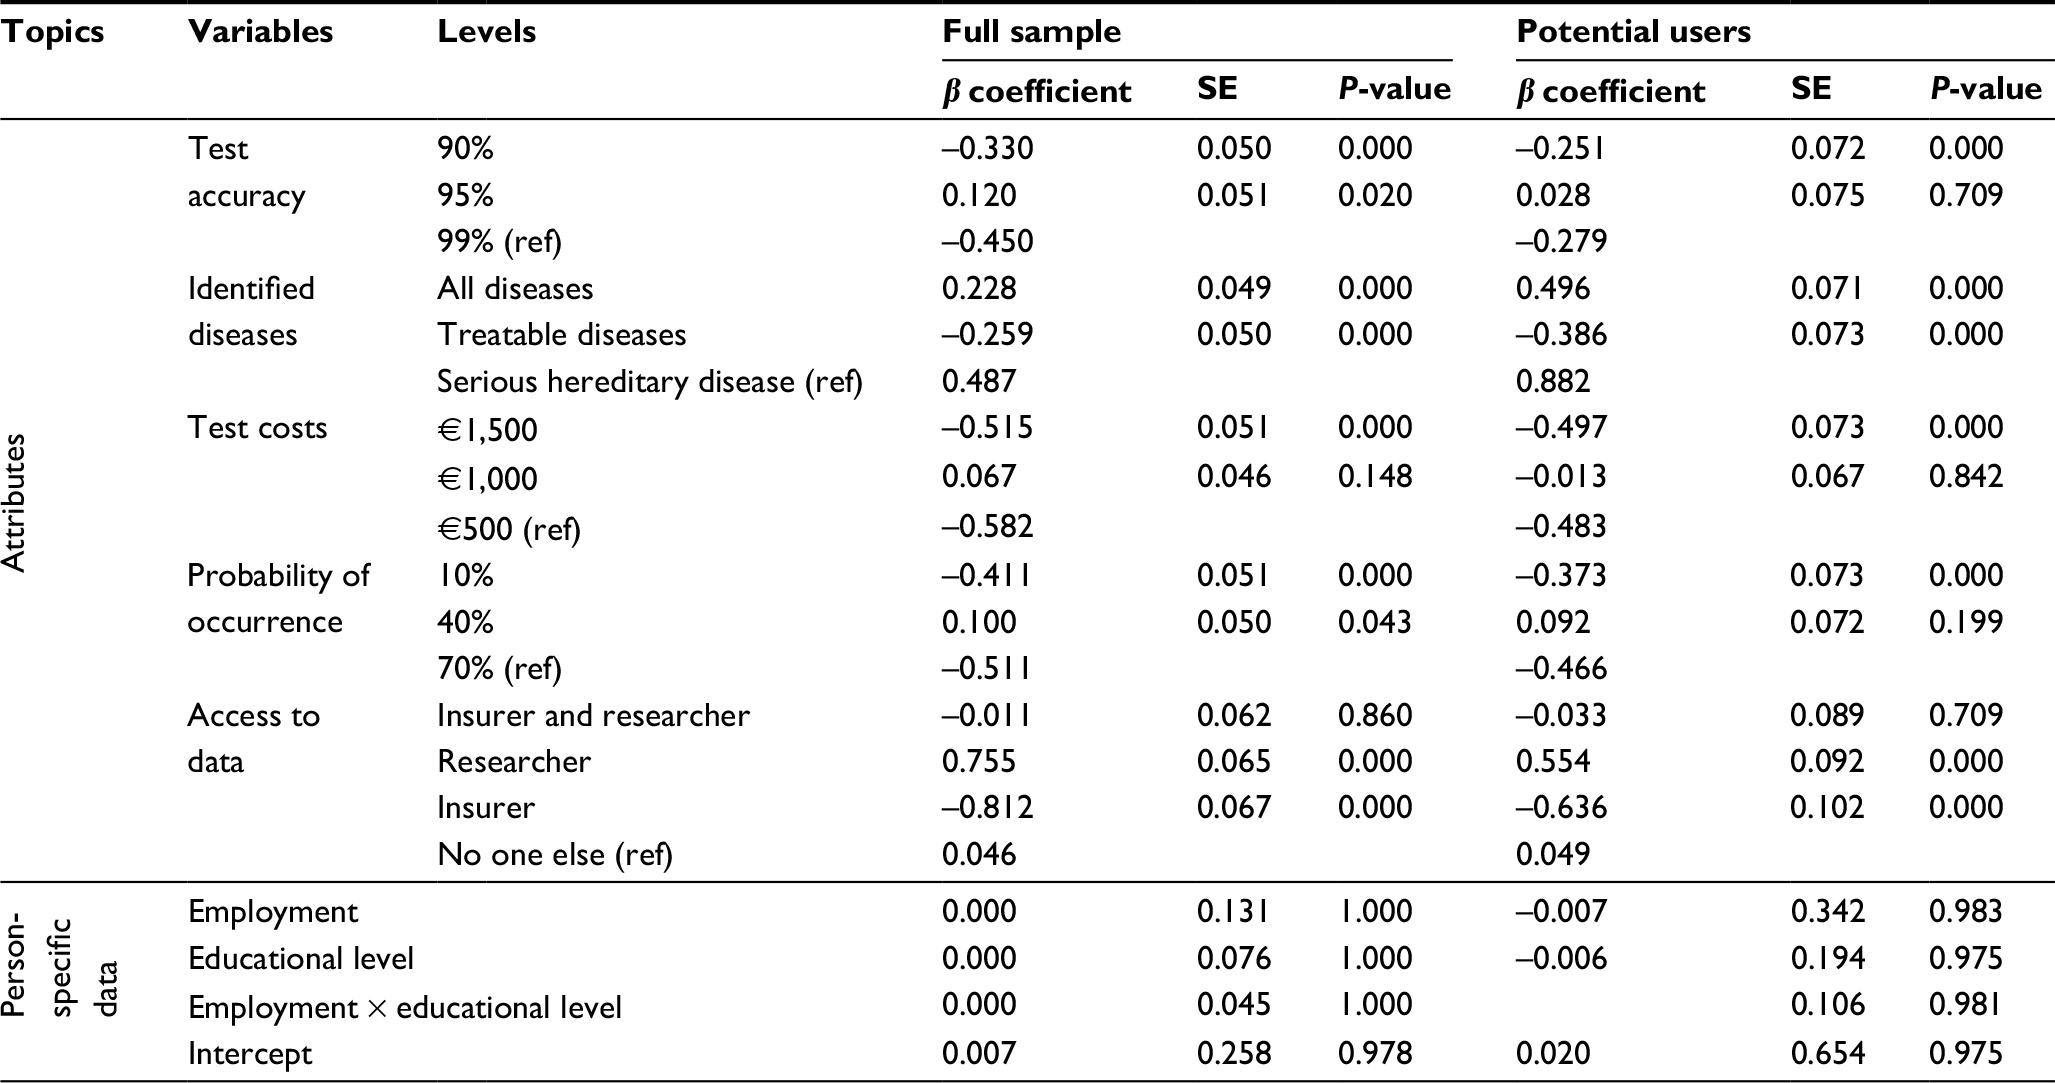
We estimated GLMMs (full sample, potential users) to identify the preferences for genetic testing. The most important attribute level for genetic testing for both subgroups was the “identification of severe hereditary diseases” (Table S4). Therefore, this attribute level is more important for potential users (buser,ser.dis.=0.88) than for the full sample (bfull,ser.dis.=0.49). However, the most disfavored attribute level for both subgroups was access to data for insurer (bfull,insur=-0.81, buser,insur.=-0.64, both P<0.001). It is striking that for test accuracy, identified diseases, test costs, and probability of occurrence, the intermediate level gained the highest utility weight in both subgroups. Although the preferences were similar between the subgroups, the full sample preferred “95% test accuracy”, €1,000 test costs, and “access to data for researchers” more strongly than the potential user subgroup.
In the last step, we investigated the factors that influenced the willingness of respondents to participate in genetic testing in reality or if they just preferred the chosen alternative hypothetically. The GLMM showed that from the attributes, only test accuracy and access to data were relevant for the decision (Table 4). All costs reduced the willingness to participate in genetic testing; however, €500 was the least disfavored level (b€500=-0.024). In addition, people were more willing to participate when the access to data would be denied to insurers and researchers. In contrast to previous models, the decision to participate in reality was positively influenced by access to data for researchers and not “only for themselves”. Educational level showed a negative association to the participation in genetic testing. In addition, people who would participate in screenings if the social or private health insurance (SHI) subsidized it were more willing to participate in genetic testing (bscr subs SHI=1.86, P<0.001). “Employment status”, “income”, and “fear of genetic diseases” did not show significant results, although the direction of the coefficients was as expected.
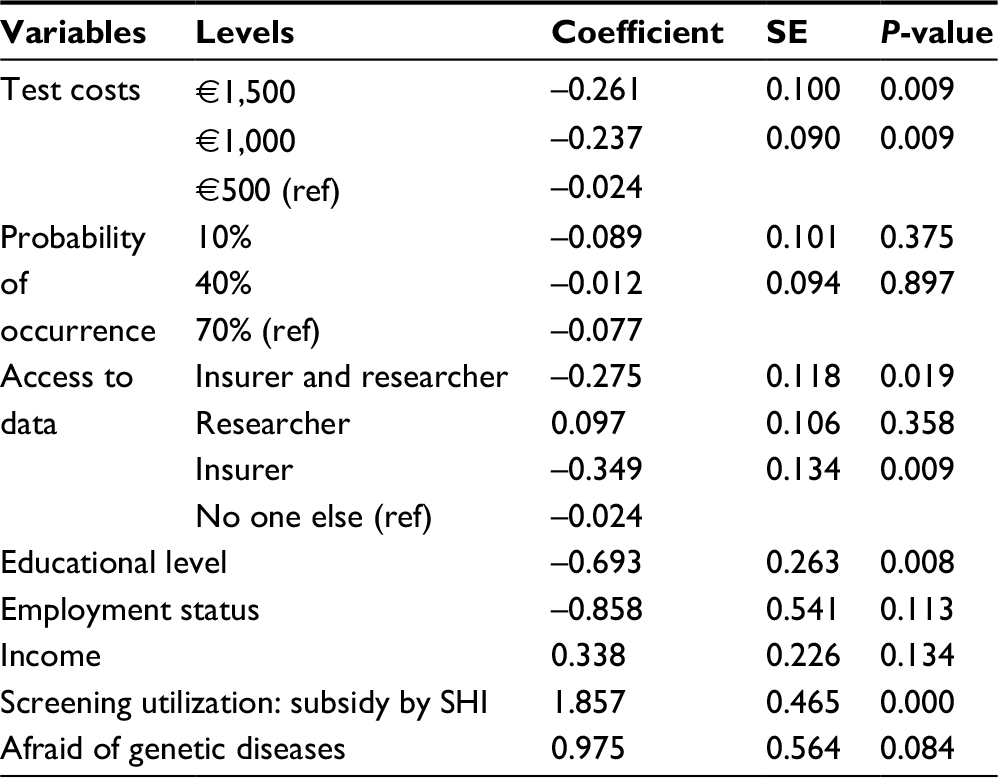 | Table 4 GLMM fixed-effects results for participation in genetic testing Notes: Intercept coefficient 1.409; SE 1.231; P 0.252 and random intercept PersonID variance 9.765; standard deviation 3.125. Abbreviations: GLMM, generalized linear mixed-effects model; SE, standard error; SHI, social or private health insurance. |
Main findings
The most preferred test for the overall sample was characterized by the following aspects: 1) the test accuracy of 95%, 2) report of severe hereditary diseases, 3) the test cost of €1,000, 4) report of results for diseases with a probability of occurrence from 40%, and (5) access to genome data for researcher but not for insurers (Table S4). Except for “access to genome data”, all intermediate levels achieved the highest utility weights in both the full sample and the sample of potential users (Table S3).
Discussion
In this study, the preferences for WGS testing without qualified genetic counseling were assessed.
The test accuracy of 95%, especially sensitivity in this case, was the most favored level of this attribute. This may show that the participants did not understand (or only partly understood) the underlying concept of test sensitivity and false-positive results. We expected that the most preferred level would be 99% test accuracy. False-positive findings lead to anxiety and uncertainty for the tested person as well as for their families.30 This in turn may require an additional diagnostic clarification or leads to an increased treatment demand (eg, psychological counseling). Finally, false-positive results could cause an unnecessary rising cost for the statutory health insurance. Otherwise, the participants may understand the underlying concept but accept the uncertainties to receive other advantages, eg, lower test costs.
The amount of reported results was also an important aspect for the decision regarding WGS tests. This aspect is represented by the probability of occurrence (in this experiment 10%, 40%, or 70%) as well as by the kinds of reported diseases (all disease dispositions, only treatable [potential] disorders, or only severe hereditary diseases). The majority of the participants preferred the reporting of serious hereditary diseases. “All disease dispositions” were not attributed with the highest utility score; this may be in accordance with the aspects of efficiency and evidence. Technological progress and genetic research enables the detection of a majority of diverse gene variants. However, many identified genetic variations are not assigned to phenotypes, or the interaction of the specific gene variants is actually unknown.31 This may change in the future because of further genomic research, especially through GWAS. So far, there are no therapy options for most of the identified gene variants and diseases. However, the participants preferred 40% “probability of disease occurrence”. This may indicate that the general population cannot assess the absolute risks for developing a disease without counseling or the influence on disease development caused by lifestyle changes (e.g., sports, nutrition), or that prevention measures may be assessed as a more important and changeable factor. These preferences could occur because of unawareness about genetic risk factors of the participants, due to lack of qualified counseling, or because of their risk aversion. Another limiting factor could be the three given levels of the probabilities. Since the participants were forced to prefer one of the given levels, the range of the outcomes could also be limited. However, the first explanation is emphasized by the negative effect of educational level on the willingness to participate (Table 4).
Cost reduced the willingness to participate in the WGS testing in reality (Table 4). Accordingly, subsidies by SHI for WGS testing showed a positive effect on the willingness to participate in testing. However, €1,000 received the highest approval in the LCMLM. This may be due to the association between the rising costs and the quality or the knowledge of the “$1,000 genome”, which means the often discussed cost reduction of a WGS to $1,000 in recent years.32 Otherwise, health care systems with little or no out-of-pocket payments for prevention measures could influence the importance of cost attributes for the participants’ decisions. However, the participants’ income did not influence the class membership and preferences. In the mWTP analyses, we found that the willingness to pay in class 2 (higher proportion of women) was highest for the attribute of probability of disease occurrence, whereas the highest mWTP occurred for access to data in class 1 (higher proportion of men). Furthermore, the direction of mWTP for several attributes was different for these two classes. Thus, the mWTP seemed highly dependent on the examined subgroup. The formation of class 1 (higher proportion of women) and class 2 (higher proportion of men) highlights the differences between males and females. While males preferred restricted access to data only for themselves, females wanted to make their genetic data accessible to research. Secrecy of personal data is seemingly very important to men, while women may want to contribute to genetic research. Further differences arose in reporting of results. Females and males preferred a reporting of results at a 40% and 10% probability of disease occurrence, respectively. Fear of a variety of predictive findings (women) or the desire to know almost all dispositions (men) may be possible explanations for this finding.
In the future, cost reductions will be expected because of the focus on genetic analyses of specific variants. Currently, for example, in the case of presumed heredity of breast cancer, the first-degree-relative risk patients are often tested only for the specific variant (eg, BRCA I and BRCA II).33 Further improvements in WGS testing could contribute to it becoming the favorable alternative compared to panel or single gene sequencing.
Potential users as well as the full sample rejected the access of test results to insurance agencies. Fear of genetic discrimination, eg, in terms of insurability or direct and/or indirect risk selection, seems to be particularly substantial.34 However, due to a ban on discrimination and the obligation to contact, this risk is excluded in the statutory health insurance in Germany. In other insurance areas (private health insurance, life insurance, and occupational disability insurance), these data could have a stronger influence on insurability and insurance premium, which may lead to uncertainty and anxiety. Despite the strong regulations, anxiety and fear of data misuse seem to be the sensitive issues. Further research is needed in these areas. However, the DCE results suggested that potential users preferred to give researchers access to genetic data. Genetic research is a dynamic field, and comprehensive genetic databases are the prerequisite for research. The fear of disease as well as the interest in research and further medical developments may be essential drivers for the preferences in this study. Thus, people have the opportunity to contribute to medical research. With regard to large genome sequencing projects, such as the 100,000 Genomes Project (UK),35 the Saudi Human Genome Program (Saudi Arabia),36 and the GoNL (the Netherlands),37 the German population also showed interest. The reporting of test results could be restricted or completely rejected in qualified WGS testing, eg, to findings of the ACMG-positive list (Recommendations for Reporting of Incidental Findings in Clinical Exome and Genome Sequencing).38 Basically, the decision for or against a WGS test in reality depended on the specific design (characteristics level) in 53.26% of the cases. While 26% of the participants rejected a WGS test independent of specific levels, 20.74% of the participants would execute a WGS test independent of the test characteristics in reality.
The possibilities for using genetic testing results in diagnosis and therapy have steadily increased. Therefore, the WGS offers an opportunity to detect a majority of disorders, especially using a predictive approach. However, in Germany, the costs of genetic analyses for patients at risk (eg, first-degree relatives of breast cancer patients) are covered by a variety of health insurance plans, whereas predictive genetic testing for nonpredisposed people is an out-of-pocket expense. Therefore, comprehensive genetic direct-to-consumer (DTC) analysis via the Internet seems to be a less expensive alternative,18 although DTC options often lack qualified genetic counseling.19 As we can see from our survey, not all stated preferences are consistent with the qualified recommendations. Therefore, our study results emphasize the importance of genetic counseling. In Germany, human genetic counseling for predictive analysis is obligatory in accordance with the § 10 German Act of Gene Diagnostics (GenDG). Two main results underline the claim for genetic counseling: 1) the chosen test accuracy of 95% and the associated higher risk of false-positive results (in contrast to a test accuracy of 99%) and 2) the selected probability of disease occurrence at a level of 40% for the reporting of results. For a majority of disease dispositions, there are no treatment options at the moment. Therefore, people may be confronted with information on a large number of potential diseases, which will lead to anxiety. Genetic counseling may help to understand what penetrance really means and which consequences of a finding with a probability of 40% occurrence will arise. However, a possible explanation for these preferences might be that people assume that their doctors will receive the WGS test results and help them to understand and interpret their results. The attribute access to data is characterized by the possibility of access to the genetic information by the treating physician. Due to medical secrecy, we excluded the risk and the anxiety of data misuse. A person can decide if they want to share these genetic results with the treating physician, which would be beneficial for understanding. Prior genetic consultations may have an influence on the general decision for the execution and the scope of reporting of the results. However, in the present study, we excluded such a prior consultation to explore the preferences without a qualified genetic counseling (which is partially lacking in a genetic DTC analysis).
One limitation of this experiment is the hypothetical character. The revealed preferences may lead to another distribution of utility weights. Furthermore, the importance of test specificity was neglected. The difference between sensitivity and specificity is difficult for the general population to understand, and therefore, we focused on test sensitivity in the DCE. The representativeness of the sample is also limited. The sample of a primarily online acquisition is mainly characterized by younger and Internet-savvy people. However, we assumed that the topic is most relevant for this group. In the direct approach, we only recruited a small number of participants (n<10), so we could exclude a selection bias. Although we included the relevant test attributes and important sociodemographic characteristics of the study population, further factors (eg, risk aversion) could influence the preferences. The calculations of mWTP should be considered with caution. We treated the level differences as linear, although this is not intuitive. For example, we assumed that the difference from 90% test accuracy to 95% had the same effect as a change from 95% to 99% in mWTP. However, we needed to assume linear effects for calculating the average willingness to pay and show differences between the classes. At the time of our study, there was a lack of literature describing the levels used for the attributes. Therefore, we considered the available literature and current discussion to derive the characteristics of the attributes. These data were discussed and approved by experts. Having a published qualitative study available would have led to a higher objectification of attribute and level selection. However, due to the short duration of the study, we had to forgo this possibility. In order to assess the relevance of the test conditions for nontest-savvy participants, an integration of an opt-out option was omitted. The study can be considered a feasibility study based on the number of participants. To extrapolate the results to the whole country, the number of participants needs to be larger and nationally representative.
This study reports on the interest and preferences for WGS testing among Germans. Our study sample from the general population of Germany was aware of the importance of WGS results, and they preferred to make their data accessible for researchers but not for insurers because of possible discrimination. A positive attitude toward population-wide screening projects could therefore be assumed if data privacy is assured and the costs do not exceed €1,000. In general, the decision for or against a WGS is complex and could have far-reaching consequences. Hence, this decision should be a result of an informed consent process, where the attributes and consequences of a WGS are clarified.
Acknowledgments
The publication of this article was funded by the Open Access Fund of the Leibniz Universität Hannover. We thank all study participants and thank Editage for assistance in language editing.
Disclosure
The authors report no conflicts of interest in this work.
References
Heard E, Tishkoff S, Todd JA, et al. Ten years of genetics and genomics: what have we achieved and where are we heading? Nat Rev Genet. 2010;11(10):723–733. | ||
Bentley DR, Balasubramania S, Swerdlow HP, et al. Accurate whole human genome sequencing using reversible terminator chemistry. Nature. 2008;456(7218):53–59. | ||
Vora T, Thacker N. Impacts of a biobank: bridging the gap in translational cancer medicine. Indian J Med Paediatr Oncol. 2015;36(1):17–23. | ||
Rockman MV. Reverse engineering the genotype-phenotype map with natural genetic variation. Nature. 2008;456(7223):738–744. | ||
Verma M. Personalized medicine and cancer. J Pers Med. 2012;2(1):1–14. | ||
Meienberg J, Bruggmann R, Oexle K, Matyas G. Clinical sequencing: is WGS the better WES? Hum Genet. 2016;135(3):359–362. | ||
Bodian DL, Klein E, Iyer RK, et al. Utility of whole-genome sequencing for detection of newborn screening disorders in a population cohort of 1,696 neonates. Genet Med. 2016;18(3):221–230. | ||
Cho MK. Preventive genomic sequencing in the general population: do PGS fly? Am J Bioeth. 2016;15(7):1–2. | ||
Ellingford JM, Barton S, Bhaskar S, et al. Whole genome sequencing increases molecular diagnostic yield compared with current diagnostic testing for inherited retinal disease. Ophthalmology. 2016;123(5):1143–1150. | ||
EURAT Group. Cornerstones for an ethically and legally informed practice of Whole Genome Sequencing: Code of Conduct and Patient Consent Models: Project EURAT “Ethical and Legal Aspects of Whole Human Genome Sequencing”. Available from: http://www.uni-heidelberg.de/md/totalsequenzierung/informationen/mk_eurat_position_paper.pdf. Accessed March 15, 2017. | ||
Farrell PM, Kosorok MR, Rock MJ, et al. Early diagnosis of cystic fibrosis through neonatal screening prevents severe malnutrition and improves long-term growth. Wisconsin Cystic Fibrosis Neonatal Screening Study Group. Pediatrics. 2001;107(1):1–13. | ||
Strafford JC. Genetic testing for Lynch Syndrome, an inherited cancer of the bowel, endometrium, and ovary. Rev Obstet Gynecol. 2012;5(1):42–49. | ||
Petrucelli N, Daly MB, Pal T. BRCA1- and BRCA2-associated hereditary breast and ovarian cancer. In: Pagon RA, Adam MP, Ardinger HH, et al., editors. GeneReviews(R). Seattle, WA: University of Washington, Seattle; 1993. | ||
Vermeulen E, Henneman L, van El CG, Cornel MC. Public attitudes towards preventive genomics and personal interest in genetic testing to prevent disease: a survey study. Eur J Public Health. 2014;24(5):768–775. | ||
Sanderson SC, Wardle J, Jarvis MJ, Humphries SE. Public interest in genetic testing for susceptibility to heart disease and cancer: a population-based survey in the UK. Prev Med. 2004;39(3):458–464. | ||
Wilde A, Meiser B, Mitchell PB, Hadzi-Pavlovic D, Schofield PR. Community interest in predictive genetic testing for susceptibility to major depressive disorder in a large national sample. Psychol Med. 2011;41(8):1605–1613. | ||
Berg S. The well-informed patient: a new breed of health care consumer. Asthma Mag. 2005;10(4):28–30. | ||
Altman RB. Direct-to-consumer genetic testing: failure is not an option. Clin Pharmacol Ther. 2009;86(1):15–17. | ||
Gollust SE, Wilfond BS, Hull SC. Direct-to-consumer sales of genetic services on the Internet. Genet Med. 2003;5(4):332–337. | ||
Lancsar E, Louviere J. Conducting discrete choice experiments to inform healthcare decision making: a user’s guide. Pharmacoeconomics. 2008;26(8):661–677. | ||
Goldfeder RL, Priest JR, Zook JM, et al. Medical implications of technical accuracy in genome sequencing. Genome Med. 2016;8(1):24. | ||
National Human Genome Research Institute. The Cost of Sequencing a Human Genome. Available from: https://www.genome.gov/sequencingcosts/. Accessed July 6, 2016; March 13, 2017. | ||
Green ED, Guyer MS, National Human Genome Research Institute. Charting a course for genomic medicine from base pairs to bedside. Nature. 2011;470(7333):204–213. | ||
Johnson KJ, Gehlert S. Return of results from genomic sequencing: a policy discussion of secondary findings for cancer predisposition. J Cancer Policy. 2014;2(3):75–80. | ||
McLaughlin HM, Ceyhan-Birsoy O, Christensen KD, et al; MedSeq Project. A systematic approach to the reporting of medically relevant findings from whole genome sequencing. BMC Med Genet. 2014;15:134. | ||
van Hoyweghen I, Horstman K. European practices of genetic information and insurance: lessons for the Genetic Information Nondiscrimination Act. JAMA. 2008;300(3):326–327. | ||
Krinsky I, Robb AL. On approximating the statistical properties of elasticities. Rev Econ Stat. 1986;68(4):715–719. | ||
German Federal Statistical Office. Bildungsstand der Bevölkerung. Available from: https://www.destatis.de/DE/Publikationen/Thematisch/BildungForschungKultur/Bildungsstand/BildungsstandBevoelkerung5210002167004.pdf?__blob=publicationFile. Accessed March 15, 2017. | ||
German Federal Statistical Office [webpage on the Internet]. Einkommen und Einnahmen sowie Ausgaben privater Haushalte (Laufende Wirtschaftsrechnungen): Deutschland, Jahre, Haushaltsgröße. Available from: https://www-genesis.destatis.de/genesis/online;jsessionid=D950CB1AF32F174301847A1DC5FADC47.tomcat_GO_2_1?operation=previous&levelindex=2&levelid=1484292140539&step=2. Accessed March 15, 2017. | ||
Institute of Medicine (US) Committee on Assessing Genetic Risks. Assessing Genetic Risks: Implications for Health and Social Policy. Washington, DC: National Academies Press (US); 1994. | ||
Petersen BS, Fredrich B, Hoeppner MP, Ellinghaus D, Franke A. Opportunities and challenges of whole-genome and -exome sequencing. BMC Genet. 2017;18(1):14. | ||
Hayden EC. Technology: the $1,000 genome. Nature. 2014;507(7492):294–295. | ||
National Cancer Institute [webpage on the Internet]. BRCA1 and BRCA2: Cancer Risk and Genetic Testing. Available from: https://www.cancer.gov/about-cancer/causes-prevention/genetics/brca-fact-sheet. Accessed March 16, 2017. | ||
Lemke T. “A slap in the face”. An exploratory study of genetic discrimination in Germany. Genomics Soc Policy. 2009;5:22–39. | ||
Department of Health [webpage on the Internet]. The 100,000 Genomes Project. Available from: https://www.genomicsengland.co.uk/the-100000-genomes-project/. Accessed March 15, 2017. | ||
Project Team SG. The Saudi Human Genome Program: an oasis in the desert of Arab medicine is providing clues to genetic disease. IEEE Pulse. 2015;6(6):22–26. | ||
Boomsma DI, Wijmenga C, Slagboom EP, et al. The genome of the Netherlands: design, and project goals. Eur J Hum Genet. 2014;22(2):221–227. | ||
Green RC, Berg JS, Grody WW, et al. ACMG recommendations for reporting of incidental findings in clinical exome and genome sequencing. Genet Med. 2013;15(7):565–574. |
Supplementary materials
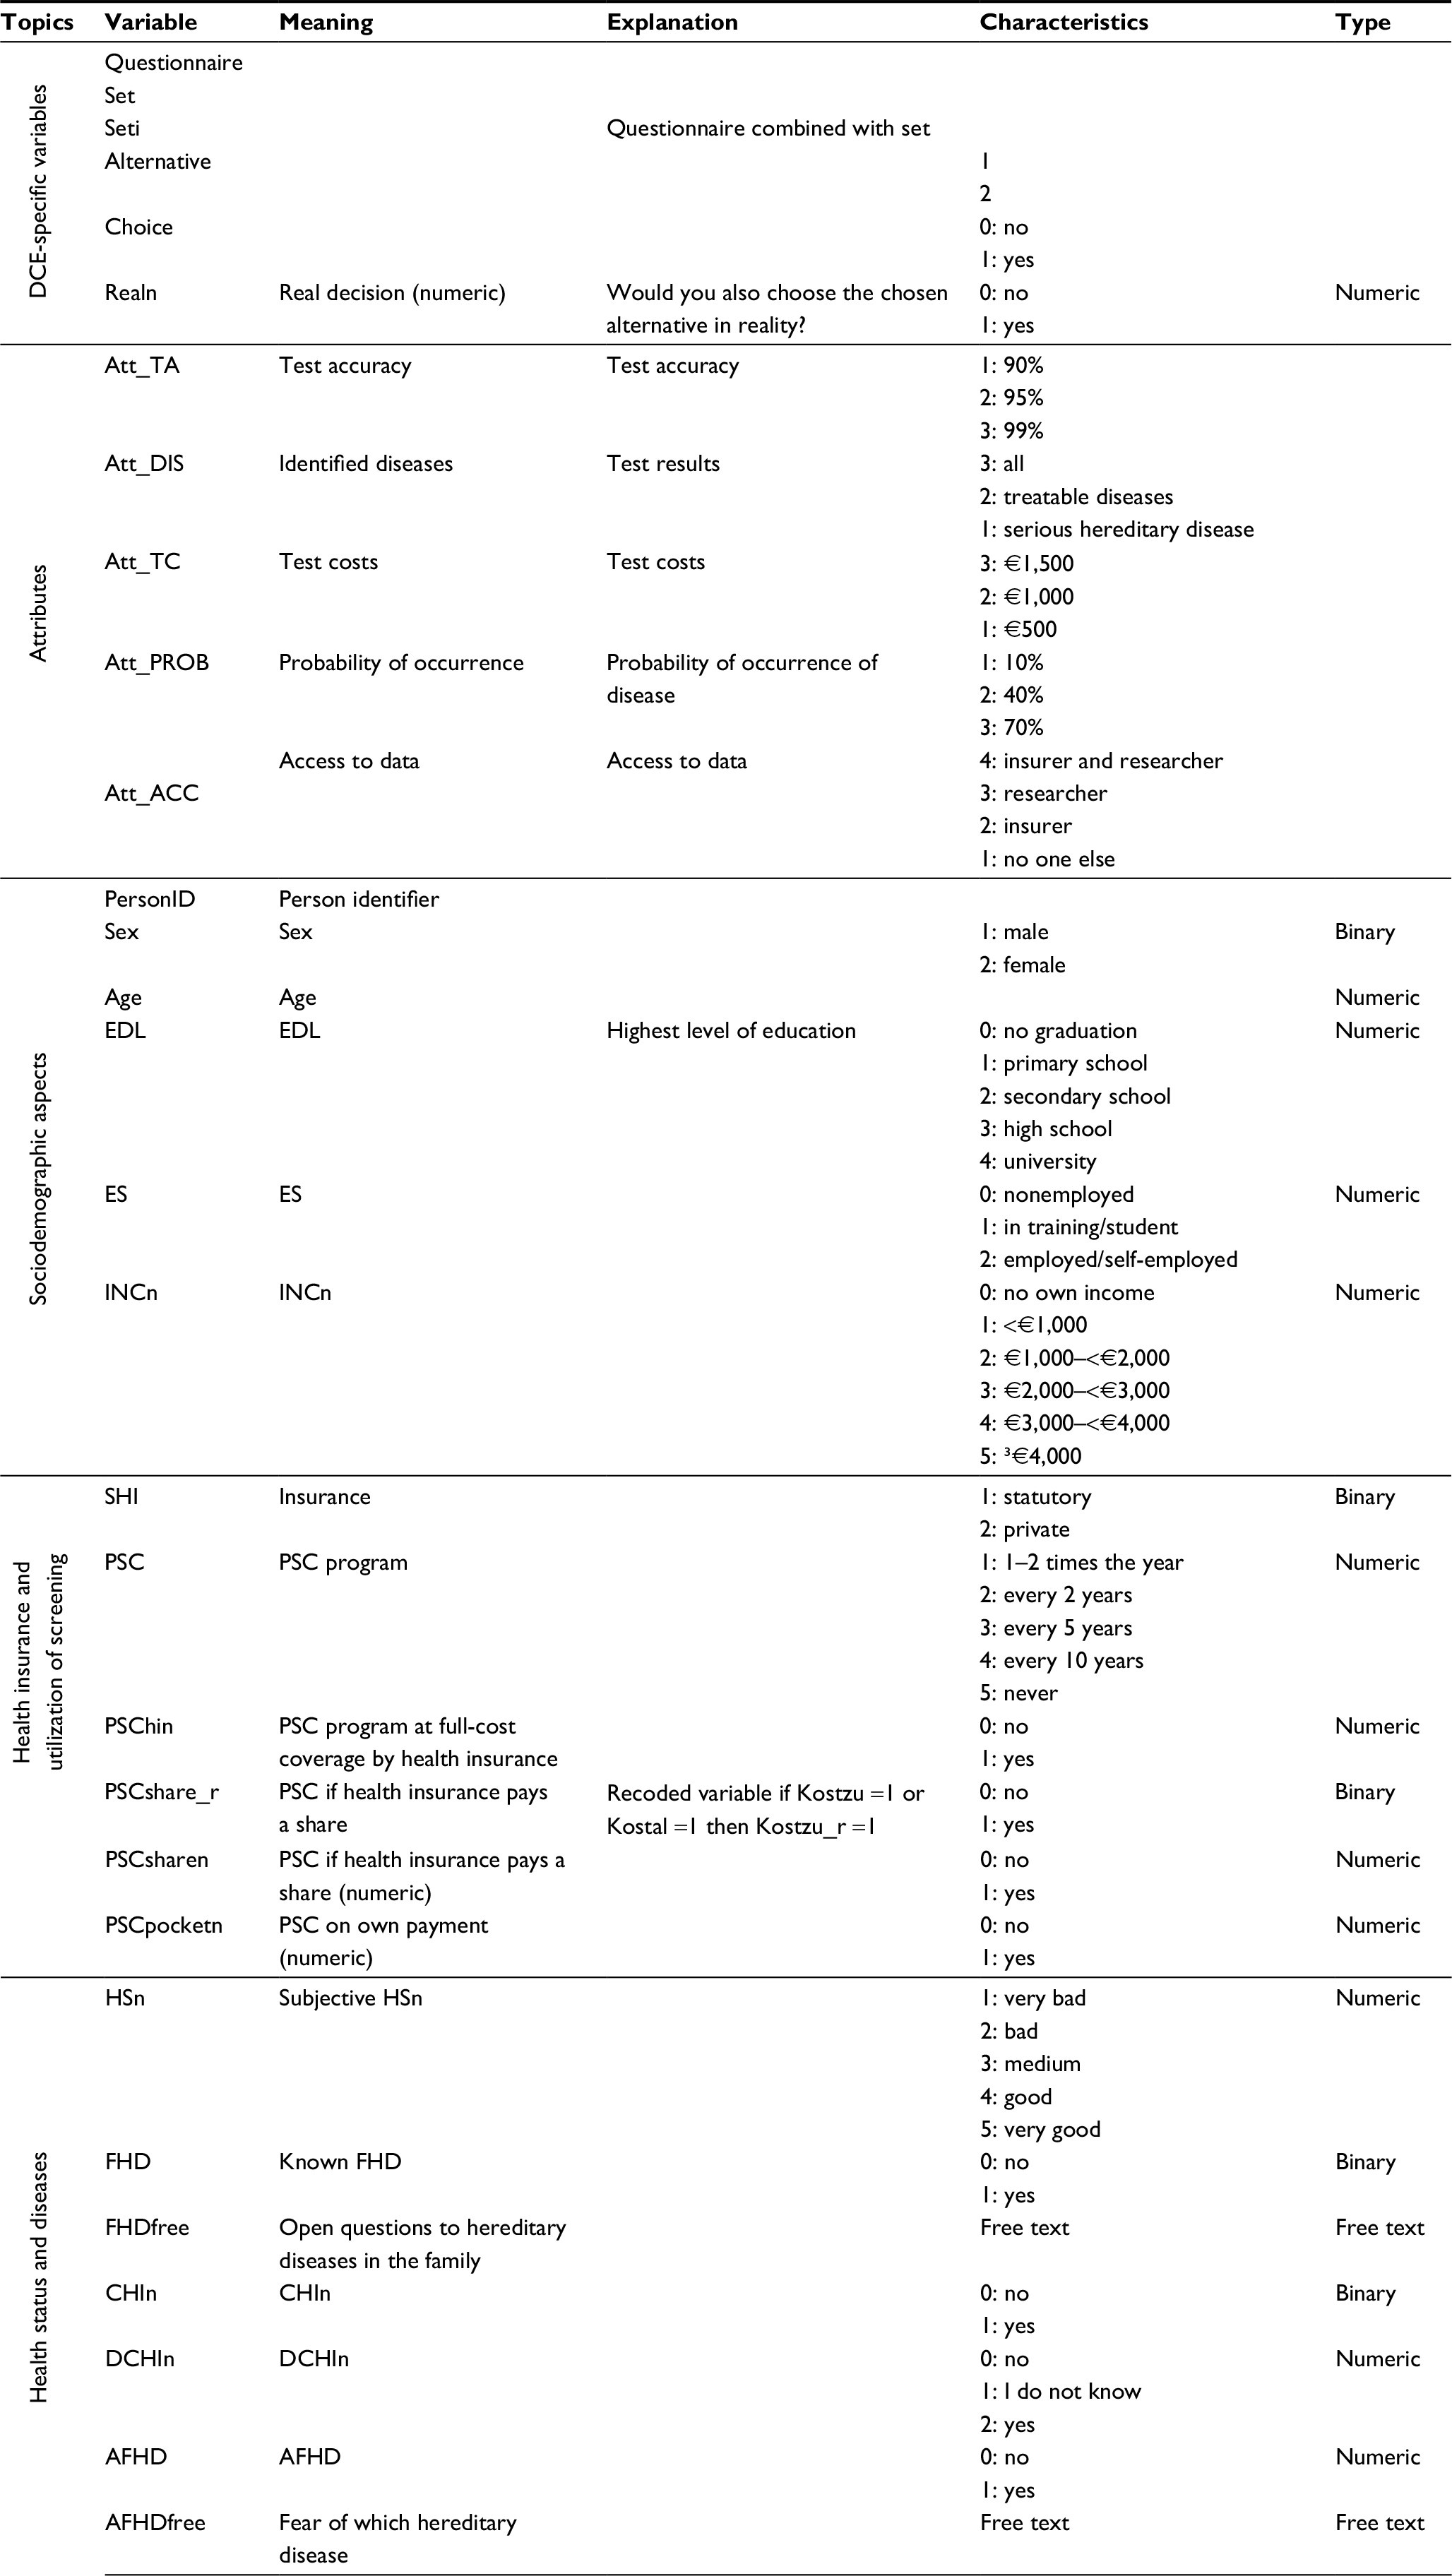 | Table S1 Overview of used variables Abbreviations: AFHD, afraid of hereditary disease; CHIn, children (numeric); DCHIn, desire to have children (numeric); FHD, family hereditary disease; EDL, educational level; ES, employment status; HSn, health status (numeric); INCn, income (numeric); PSC, participation in screening; SHI, social or private health insurance. |
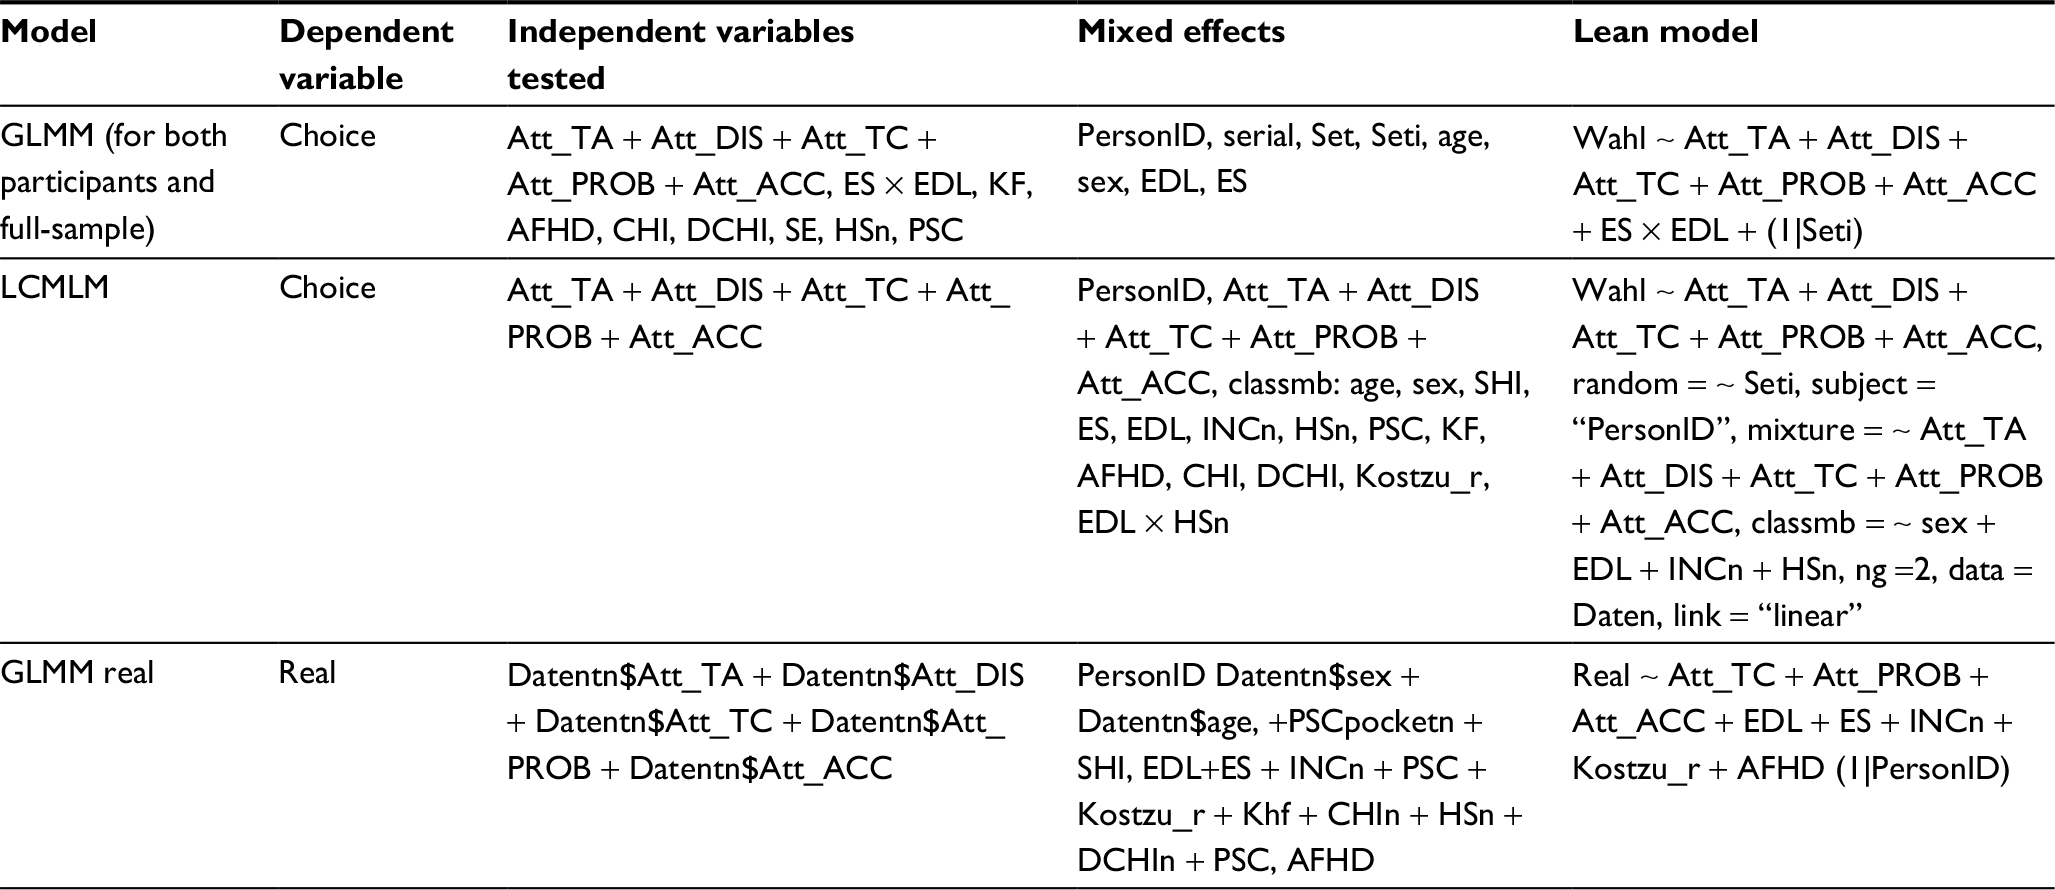 | Table S2 Overview of included independent variables used in GLMM and LCMLM Abbreviations: AFHD, afraid of hereditary disease; CHI, children; CHIn, CHI (numeric); DCHIn, desire to have children; DCHIn, DCHI (numeric); EDL, educational level; ES, employment status; GLMM, generalized linear mixed-effects model; HSn, health status (numeric); INCn, income (numeric); KL, known familar hereditary diseases; LCMLM, latent class mixed logit model; PSC, participation in screening; SHI, social or private health insurance. |
 | Table S3 Latent class mixed logit model results – attribute effects Notes: Adjusted for class-membership effects, sex, educational level, and income; subject, “PersonID”. Abbreviations: SE, standard error; NA, not applicable. |
 | Table S4 Results from the generalized linear mixed-effects model |
 | Figure S1 Correlation plot of independent variables. Notes: The significance level was a P-value of 0.05. X: not significant correlations. Dark blue indicates highly positive correlations. Dark red indicates highly negative correlations. Larger circles indicate higher correlations. PSCshare_r, PSC if health insurance pays a share. Abbreviations: AFHD, afraid of hereditary disease; CHIn, children (numeric); DCHIn, desire to have children (numeric); EDL, educational level; ES, employment status; FHD, family hereditary disease; HSn, health status (numeric); INCn, income (numeric); PSC, participation in screening; SHI, social or private health insurance. |
 © 2018 The Author(s). This work is published and licensed by Dove Medical Press Limited. The
full terms of this license are available at https://www.dovepress.com/terms
and incorporate the Creative Commons Attribution
- Non Commercial (unported, 3.0) License.
By accessing the work you hereby accept the Terms. Non-commercial uses of the work are permitted
without any further permission from Dove Medical Press Limited, provided the work is properly
attributed. For permission for commercial use of this work, please see paragraphs 4.2 and 5 of our Terms.
© 2018 The Author(s). This work is published and licensed by Dove Medical Press Limited. The
full terms of this license are available at https://www.dovepress.com/terms
and incorporate the Creative Commons Attribution
- Non Commercial (unported, 3.0) License.
By accessing the work you hereby accept the Terms. Non-commercial uses of the work are permitted
without any further permission from Dove Medical Press Limited, provided the work is properly
attributed. For permission for commercial use of this work, please see paragraphs 4.2 and 5 of our Terms.