Back to Archived Journals » Open Access Journal of Sports Medicine » Volume 6
What predicts performance in ultra-triathlon races? – a comparison between Ironman distance triathlon and ultra-triathlon
Authors Knechtle B ![]() , Zingg M, Rosemann T
, Zingg M, Rosemann T ![]() , Stiefel M, Rüst CA
, Stiefel M, Rüst CA
Received 14 December 2014
Accepted for publication 16 February 2015
Published 18 May 2015 Volume 2015:6 Pages 149—159
DOI https://doi.org/10.2147/OAJSM.S79273
Checked for plagiarism Yes
Review by Single anonymous peer review
Peer reviewer comments 3
Editor who approved publication: Professor Freddie H Fu
Beat Knechtle,1,2 Matthias Alexander Zingg,1 Thomas Rosemann,1 Michael Stiefel,1 Christoph Alexander Rüst1
1Institute of Primary Care, University of Zurich, Zurich, Switzerland; 2Gesundheitszentrum St Gallen, St Gallen, Switzerland
Objective: This narrative review summarizes recent intentions to find potential predictor variables for ultra-triathlon race performance (ie, triathlon races longer than the Ironman distance covering 3.8 km swimming, 180 km cycling, and 42.195 km running). Results from studies on ultra-triathletes were compared to results on studies on Ironman triathletes.
Methods: A literature search was performed in PubMed using the terms “ultra”, “triathlon”, and “performance” for the aspects of “ultra-triathlon”, and “Ironman”, “triathlon”, and “performance” for the aspects of “Ironman triathlon”. All resulting papers were searched for related citations. Results for ultra-triathlons were compared to results for Ironman-distance triathlons to find potential differences.
Results: Athletes competing in Ironman and ultra-triathlon differed in anthropometric and training characteristics, where both Ironmen and ultra-triathletes profited from low body fat, but ultra-triathletes relied more on training volume, whereas speed during training was related to Ironman race time. The most important predictive variables for a fast race time in an ultra-triathlon from Double Iron (ie, 7.6 km swimming, 360 km cycling, and 84.4 km running) and longer were male sex, low body fat, age of 35–40 years, extensive previous experience, a fast time in cycling and running but not in swimming, and origins in Central Europe.
Conclusion: Any athlete intending to compete in an ultra-triathlon should be aware that low body fat and high training volumes are highly predictive for overall race time. Little is known about the physiological characteristics of these athletes and about female ultra-triathletes. Future studies need to investigate anthropometric and training characteristics of female ultra-triathletes and what motivates women to compete in these races. Future studies need to correlate physiological characteristics such as maximum oxygen uptake (VO2max) with ultra-triathlon race performance in order to investigate whether these characteristics are also predictive for ultra-triathlon race performance.
Keywords: swimming, cycling, running, age, experience, ultra-endurance
Introduction
On February 18, 1978, a group of 15 athletes started for the first time in history at the shores of Waikiki, Hawaii, USA, in a multi-sports event covering 3.8 km swimming, 180 km cycling and 42.195 km running.1 The intention of this combination of three single races was to find the best endurance athlete. In 1981, the race moved from the shores of Waikiki to the lava fields of Kona on the Big Island of Hawaii to become the “Ironman Hawaii” and the World Championship in Ironman triathlon.2 The Ironman Hawaii is now among the 12 toughest sports events in the world.3
However, in 1985, athletes expanded the classical Ironman triathlon distance to twice the Ironman distance equal to 7.6 km swimming, 360 km cycling, and 84.4 km running.4 In 1988, the classical Ironman distance tripled for the first time to the Triple Iron ultra-triathlon distance (ie, 11.4 km swimming, 540 km cycling, and 126.6 km running).4 Over the years, the race distances became longer, and in 1998, the first Double Deca Iron ultra-triathlon covering 76 km swimming, 3,600 km cycling, and 844 km running was held (Table 1). The trend for the longer distances moved markedly and rapidly between 1985 and 1992 to expand from the Double Iron to the Deca Iron ultra-triathlon distance within 7 years (Table 2). It took then another 6 years for the first Double Deca Iron ultra-triathlon to be run. Very recently, for the first time in history, a Triple Deca Iron ultra-triathlon was held in the autumn of 2013.5 However, this race was not held as a non-stop race, but as a multi-stage triathlon where the athletes completed an Ironman distance triathlon daily for 30 consecutive days.5
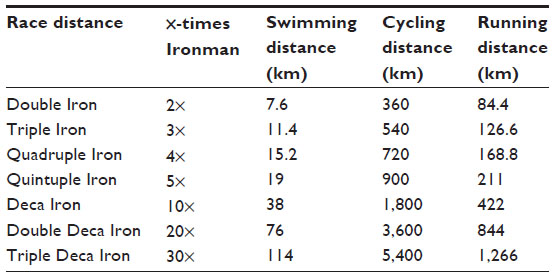 | Table 1 Race distances in ultra-triathlon competitions |
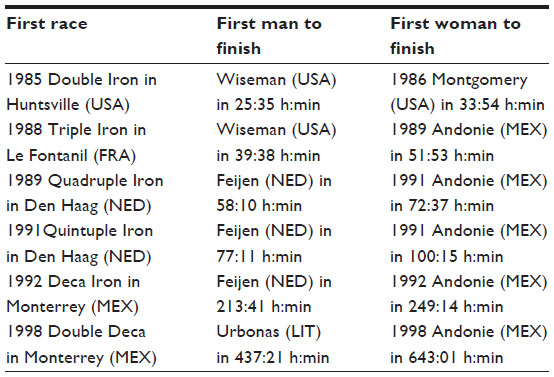 | Table 2 The first editions and the first women and men to finish the distances |
The first women to compete in a Double to a Quadruple Iron ultra-triathlon entered the races ~1–2 years later than the first men (Table 2). However, from Quintuple to Double Deca Iron ultra-triathlon, the first women ever competed with the first men ever when the first events were held (Table 2). Indeed, the Dutchman Martin Feijen and the Mexican Silvia Andonie were the pioneers in the distances from the Quadruple to the Deca Iron ultra-triathlon.6
The shorter ultra-triathlons (ie, the Double and Triple Iron ultra-triathlons) are of higher popularity than the longer distances (ie, distances longer than the Quintuple Iron ultra-triathlon). To date, more than 90% of all competitors started in a Double or a Triple Iron ultra-triathlon, most probably due to the higher offer in the shorter ultra-distance races.4 For men, the world records in Double Iron and Quintuple Iron ultra-triathlon were set in recent years (Table 3); however, the world records for the longer distances in the Deca and Double Deca Iron ultra-triathlons could stand for many years. For women, all world records were set in the mid-1990s (Table 3).6
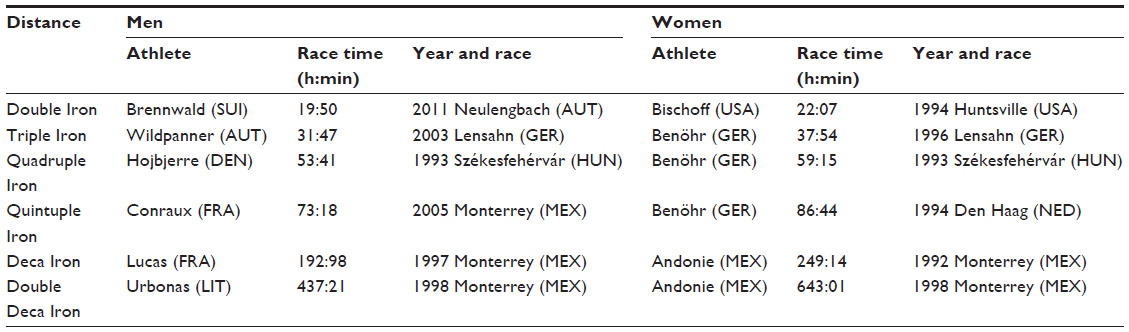 | Table 3 World records in ultra-triathlon |
In this review, we try to find potential predictive variables for a fast race time in an ultra-triathlon race from Double Iron ultra-triathlon and longer, where most studies were performed with athletes competing in Double Iron, Triple Iron, and Deca Iron ultra-triathlons. Since the classical Ironman distance triathlon was the base for the longer ultra-triathlon distances, we compared results of studies investigating Ironman triathlons to studies investigating ultra-triathlon race distances. A literature search was performed with the data base PubMed (http://www.ncbi.nlm.nih.gov/pubmed/) using the terms “ultra” and “triathlon” for the aspects of “ultra-triathlon”, “Ironman”, and “triathlon” for the aspects of “Ironman triathlon”. All resulting papers were searched for related citations. Results for ultra-triathlons were compared to results for Ironman-distance triathlons to find potential differences. Studies investigating highly sophisticated laboratory results involving use of enzymes, hormones, and gene analyses with little practical relevance were not considered for this practical approach of potential predictor variables.
Predictor variables for ultra-triathlon race distances
The main intention of this review is to describe potential predictor variables each athlete might be able to determine without great effort such as costly laboratory measurements. Although ultra-triathlon races have been held up to distances of the Double Deca Iron ultra-triathlon (76 km, 3,600 km cycling, and 844 km running) and the Triple Deca Iron ultra-triathlon distance (114 km swimming, 5,400 km cycling, and 1,266 km running), most studies investigating ultra-triathletes were performed with athletes competing in shorter race distances such as Double Iron and Triple Iron ultra-triathlon. In some instances, case studies were also performed. Basically, most studies investigating Ironman and ultra-triathletes were case or field studies.
Sex as a predictor
For both Ironman triathlons and ultra-triathlons, female participation is low at ~10%. Women account for ~8%–10% of ultra-triathlon competitors in Double Iron to Deca Iron ultra-triathlons.7,8 When the participation trends of triathletes competing since 1978 in “Ironman Hawaii” and ultra-triathlons up to the Double Deca Iron ultra-triathlon distance were investigated, women accounted for ~12% of the total field, and their percentage was highest in the shortest race distance Ironman Hawaii (22.1%) and lowest in the Deca Iron ultra-triathlon (6.5%).8
Generally, men were faster than women in ultra-triathlons,8–12 and with increasing race length, the best women became slower compared to the best men.7 There are differences in the sex difference between the Ironman and longer triathlon races. When data from 20,638 athletes including 5,163 women and 15,475 men competing in Ironman Hawaii and from 143 women and 1,252 men competing in Double Iron ultra-triathlon races held worldwide between 1999 and 2011 were analyzed, the sex difference in performance of the top three athletes remained unchanged in Ironman Hawaii for overall race time. For Double Iron ultra-triathletes, the sex difference for the annual top three finishers remained unchanged for overall race time. The sex differences increased as the endurance race distances increased and showed no changes between 1999 and 2011.11 However, when a longer time frame was considered for Ironman Hawaii, the sex difference showed changes across years.13,14 Athletes competing between 1983 and 2012 in Ironman Hawaii improved their swimming (only men), cycling, running, and overall race times. The sex difference decreased across years for overall race time and running, but not for swimming and cycling.14
The sex difference seemed to increase with increasing race distance. Considering the different race distances, men were ~19% faster than women in Double and Triple Iron ultra-triathlons and ~30% faster in Deca Iron ultra-triathlons.7 When the fastest men ever were compared to the fastest women ever competing between 1978 and 2013 in races from Ironman Hawaii to the Double Deca Iron ultra-triathlon, the fastest men were faster than the fastest women for split and overall race times, with the exception of the swimming split in the Quintuple Iron ultra-triathlon distance.9 When the performances of Double Iron ultra-triathletes competing between 1985 and 2012 were investigated, men were faster than women, men improved overall race times, split times in cycling and running, and the sex differences remained unchanged across years for overall race time and split times.12 Men were faster for overall race time (~7%), swimming (~5%), cycling (~8%), and running (~4%) (Table 4). When the performance of the annual three fastest women and men was compared, the annual three fastest men improved race time across years from 1,650 minutes (in 1985) to 1,333 minutes (in 2012).12 However, for women, overall race times remained unchanged at 1,593 minutes with an unchanged sex difference of ~27%. In swimming, the split times for the annual three fastest women (148 minutes) and men (127 minutes) remained unchanged, with an unchanged sex difference of ~27%. In cycling, the annual three fastest men improved split times from 826 minutes (in 1985) to 666 min (in 2012). For women, however, the cycling split times remained unchanged at 844 minutes with an unchanged sex difference of ~25%. In running, the annual three fastest men improved from 649 minutes (in 1985) to 532 minutes (in 2012). For women, however, the running split times remained unchanged at 657 minutes, with a stable sex difference of ~32%.12Although women reduced the sex difference in Ironman triathlons across years, the sex difference in longer triathlon distances from Double to Double Deca Iron ultra-triathlons remained unchanged or increased.8,9 With increasing length of the race distance from Ironman to Double Deca Iron ultra-triathlons, the sex difference increased in swimming, running, and overall race time, but not in cycling.9 When the performance of the annual three fastest women and men competing in Ironman Hawaii and in Double Iron ultra-triathlon races held between 1999 and 2011 was compared, the sex difference in performance remained unchanged for overall race time in both race distances.11 Furthermore, the sex differences increased as the race distances increased and showed no changes over time.11 Similar findings have been reported for Triple Iron ultra-triathletes competing from 1988 to 2011.15 Overall race time decreased across years for men, while it increased for women across years. The sex difference in overall race time increased for winners from 10% (in 1992) to 42% (in 2011).15 However, there seems to be a difference in sex difference between races held as non-stop ultra-triathlons and races held as multi-stage ultra-triathlons. In “Ultraman Hawaii”, a multi-stage ultra-triathlon covering a total distance of 515 km in 3 days, the sex difference in overall race time decreased between 1983 and 2012 from 24.3% to 11.5%.10
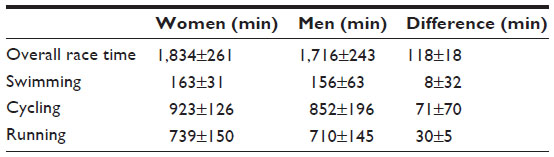 | Table 4 Comparison of female and male performances in the Double Iron marathon |
It seems very unlikely that female top performers will ever outperform male top performers in ultra-triathlons.8,9,11 Physiological (eg, maximum oxygen uptake) and anthropometric characteristics (eg, skeletal muscle mass) may set biological limits for women compared to men. Women have a lower maximum oxygen uptake (VO2max) and smaller hearts which cannot pump as much blood per unit of time.16,17
Age as a predictor
Age seems an important predictor variable in both Ironman18–23 and ultra-triathletes.10,24 Both Ironman triathlon10,23,25 and ultra-triathlon performance24 seem to be a domain of master athletes. Ultra-triathletes can achieve their best overall race times during a considerably long lifespan of three decades, from the ages of 25–55 years.24 When male Triple and Deca Iron ultra-triathletes were compared, the mean age of successful finishers was higher in Deca Iron ultra-triathletes (~41.3 years) compared to Triple Iron ultra-triathletes (~38.5 years).24 The best Triple Iron ultra-triathletes were around three years older than the best Ironman triathletes. Ironman triathletes were younger compared to ultra-triathletes (Table 5). Depending upon the race, the level of the athletes and sample size of the investigated athletes, the age of the best Ironman triathletes is between 32–33 years21 to 34–35 years.25
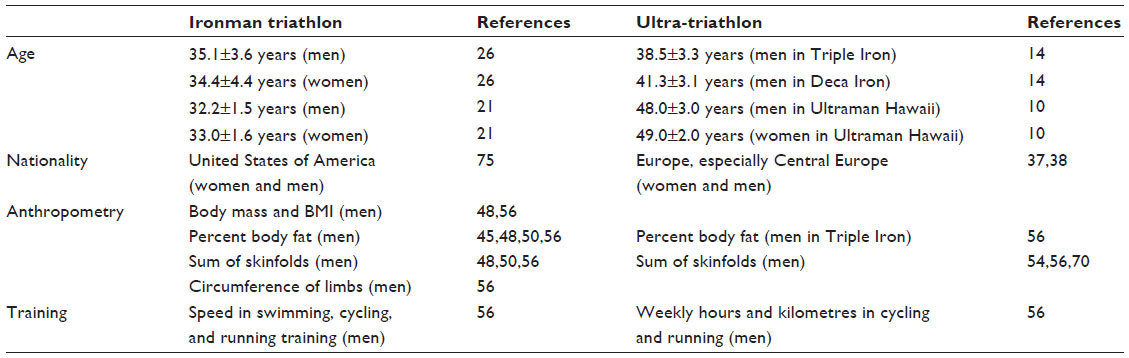 | Table 5 Differences and similarities in predictor variables between Ironman triathletes and ultra-triathletes competing in races longer than the classical Ironman distance |
Similarly to Ironman triathletes, where the age of the fastest finishers in Ironman Hawaii increased over the years,25 in ultra-triathletes an increase in the age of the best athletes over the years could also be found. In Ultraman Hawaii, the age of the annual winners has increased in the last ~30 years from 28 years in age in 1983 to 47 years in age in 2012 for men, while it remained stable at 32±6 years for women.10 Considering the annual top three finishers in Ultraman Hawaii, the age of the fastest men increased from ~33 years (in 2001) to ~48 years (in 2012) and from ~29 years (in 2001) to ~49 years (in 2012) in the fastest women.10
Anthropometric characteristics
Elite triathletes are generally tall, of average to light weight, and have low levels of body fat.27,28 Several studies investigated the changes in body composition during an ultra-triathlon and potential associations between anthropometric characteristics with split and overall race times.29–33
Competing in an ultra-triathlon leads to considerable changes in body composition such as a decrease in body mass,34 fat mass,29–33 and skeletal muscle mass,33 whereas lean body mass increased.29 The increase in lean body mass is most probably due to an increase in total body water,31 while the decrease in total body mass is associated with the decrease in skeletal muscle mass and fat mass.34 It has been assumed that Triple Iron ultra-triathletes do not dehydrate since their total body water and urinary specific gravity showed no changes.34 Similarly, becoming an Ironman triathlon leads to a decrease in body mass,35–40 where both fat mass and lean body mass decrease during the race.41 However, differences seem to exist between women and men. While body mass decreased in male Ironman triathletes,39,41 it remained unchanged in female athletes.42
Most probably, the body’s own stores are needed as fuel during the race. For example, competing in a Triple Iron ultra-triathlon leads to a decrease in body mass, body fat, and skinfold thicknesses, whereas skeletal muscle mass seemed to be unchanged.30 However, in another study investigating Triple Iron ultra-triathletes, skeletal muscle mass became reduced.33 The loss in body mass correlated to the loss in body fat, and the decrease in body fat was related to overall race time in Triple Iron ultra-triathletes.30 In a Deca Iron ultra-triathlon held during 10 days with a daily Ironman triathlon distance, a significant decrease of body mass and body fat occurred at the end of the first day.32 In contrast to these decreases, protein mass, mineral mass, total body water, intracellular water, and lean body mass increased. At the end of the 10 days, the athletes lost 3 kg of body fat.32 There seem to be differences regarding body mass changes between athletes in the Ironman and the ultra-triathlon. Participating in an Ironman triathlon leads to a considerable energy deficit,36,43,44 which seems to be covered by a decrease in muscle glycogen.36,41 In ultra-triathlon competition, the energy deficit is most probably covered by a reduction in adipose subcutaneous tissue.30–32 For Triple Iron ultra-triathletes, the decrease in percent body fat was inversely associated with race time.30 However, no study investigated a potential relationship between energy deficit and race performance for both Ironmen and ultra-triathletes.
In contrast to male Ironman triathletes where body fat seems to be the most important anthropometric predictor variable,45–51 anthropometric characteristics seemed not highly predictive for ultra-triathlon performance.33,52,53 There might be differences between shorter (ie, Triple Iron ultra-triathlon) and longer (ie, Deca Iron ultra-triathlon) races for anthropometric characteristics as potential predictor variables.52–55 In male Triple Iron ultra-triathletes, anthropometric characteristics such as body mass, body height, skin-fold thicknesses, circumferences of extremities, body mass index, percent skeletal muscle mass, and percent body fat were not related to overall race times.53 In larger samples of male Triple Iron ultra-triathletes, however, anthropometric characteristics, such as the sum of eight skinfolds, correlated to overall race times.54 The circumferences of upper arm, the sums of eight skinfolds, the sums of upper body skinfolds, and percent body fat correlated to running split times.54,55 For longer race distances, again anthropometric characteristics seemed not predictive.52 In male Deca Iron ultra-triathletes, body height, length of legs, body mass, body mass index, percent skeletal muscle mass, percent body fat, average skinfold thicknesses, and the circumferences of the thigh, calf, or upper arm were not correlated to overall race times.52
Athletes competing in an Ironman distance triathlon differ in terms of anthropometric characteristics compared to athletes competing in an ultra-triathlon such as the Triple Iron ultra-triathlon.56 Triple Iron ultra-triathletes were smaller, had shorter limbs, a higher body mass index, and larger limb circumferences than Ironman triathletes.56 However, anthropometric characteristics are of similar importance in Ironman triathletes compared to ultra-triathlon regarding their association with race times (Table 5). When male Ironman and Triple Iron ultra-triathletes were compared, percent body fat, the sum of skinfolds, and circumference of the upper arm were related to race times in Triple Iron ultra-triathlons.56 For Ironman triathletes, body mass, body mass index, circumferences of limbs (ie, upper arm, thigh, and calf), percent body fat, and the sum of skinfolds were related.48,50,56 Lower body mass, lower body mass index, lower body fat, and both lower circumferences of upper arm and thigh were also associated with a faster run split.48
In Ironman triathletes, the impact of the somatotype was the most distinguished on the run discipline and had a much greater impact on overall race time than the quantitative training effort.57 However, anthropometric characteristics were differently related to Ironman race times for women and men where percent body fat was predictive for male Ironman triathletes, but not for female athletes.58 Although body mass decreased during an Ironman triathlon, the change in body mass was not related to performance.38,40 Interestingly, a decrease in body mass enhanced performance in marathoners59 and ultra-marathoners.60–62
Previous experience
For male ultra-triathletes competing in longer race distances (ie, the Deca Iron ultra-triathlon) previous experience (ie, competing in ultra-triathlons of shorter distances) seemed to be an important predictor variable.29,63 In male Deca Iron ultra-triathletes, overall race times were related to both the number of finished Triple Iron triathlons and the personal best times in a Triple Iron triathlon.29 When male athletes who had finished a Double Iron, a Triple Iron, and a Deca Iron ultra-triathlon were identified, the performances in Double and Triple Iron ultra-triathlons were significantly correlated to Deca Iron ultra-triathlon performances for swimming and cycling, but not for running.63 However, also for male Triple Iron ultra-triathletes, previous experience was important. Personal best times in an Ironman triathlon and in a Triple Iron triathlon were positively and highly significantly related to overall race times.53
Similar findings have been reported for Ironman triathletes. For female and male Ironman triathletes, the personal best time in an Olympic-distance triathlon and in a marathon were the best predictors for Ironman race time.64,65 For male Ironman triathletes, speed in running during training, personal best marathon time, and personal best time in an Olympic-distance triathlon were related to the Ironman race time.66 A study investigating all competitors in the 1995 “Ironman Lanzarote” showed that previous best performances in Olympic-distance triathlons coupled with weekly cycling distances and that longest training ride could partially predict overall Ironman race time.67 In addition, for both female and male Ironman triathletes, the previous personal best time in an Ironman triathlon was an important predictor variable for Ironman race time.58
Performance in split disciplines
The athlete’s performance in the split disciplines contributes differentially to overall race times.53,63 When Double, Triple, and Deca Iron ultra-triathlon times were compared, the contribution of swimming split times to overall ultra-triathlon race times was lower than for cycling and running split times. Running performance was more important to overall race time for Double and Triple Iron ultra-triathlons compared to Deca Iron ultra-triathlons.63 In Triple Iron ultra-triathletes, a significant correlation was observed between overall race times and both running and cycling split times. In contrast, no significant correlation was shown between swimming split times and overall race times.53 Performance in the swim split might be influenced by wearing a wetsuit.68 However, wearing a wetsuit is prohibited in Ironman Hawaii.2
Training
Effective cycling and running training is of importance for performance in triathlon races.69 However, training characteristics are different between Ironman triathletes and ultra-triathletes.55,56,70 Furthermore, the training variables are differently related between Ironmen and ultra-triathletes (Table 5). For example, Triple Iron ultra-triathletes trained for more hours and covered more kilometers per week compared to Ironman triathletes, but speed in running during training was slower compared to the Ironman triathletes.56 For Triple Iron ultra-triathletes, weekly training volume and weekly kilometers in both cycling and running were related to race time. For Ironman triathletes, however, speed in swimming, cycling, and running training was associated with overall race time.56 In Ironman triathletes, training variables seemed differently predictive between women and men. Weekly training volume was related to total race time in men, but not in women.58
Pacing
Pacing during both an Ironman and an ultra-triathlon seems predictive for overall race time.5,29,71–73 Pacing during a multi-stage ultra-triathlon such as Deca Iron ultra-triathlon seemed highly predictive.29 In a Deca Iron ultra-triathlon held for 10 days, the daily time for each Ironman distance triathlon increased during the race (ie, positive pacing) where day 1 was the fastest (762 minutes) and day 10 the slowest (943 minutes).29 This finding could be confirmed for a different sample in male Deca Iron ultra-triathletes.5 However, male Triple Deca Iron ultra-triathletes competing for 30 days with a daily Ironman were able to maintain their performance (ie, even pacing).5 Additionally, a male triathlete competing during 33 days and finishing an Ironman distance triathlon daily was able to maintain his performance in cycling, running, and overall race times, where only swimming split times and transition times 1 (ie, between swimming and cycling) and 2 (ie, between cycling and running) became slower.71 In the Triple Deca Iron ultra-triathletes5 and the single athlete finishing 33 Ironman triathlons,71 previous experience seemed an important predictor variable to be able to maintain race pace over 30 days and longer.72 Pacing during an Ironman seemed to be different compared to an ultra-triathlon. In athletes competing in Ironman Hawaii, bike and run pacing on downhill segments were predictive for overall race time.74 Furthermore, the intensity during swimming is inversely correlated with performance in cycling and running in Ironman triathletes.35
Origin and nationality
Ironman Hawaii has been dominated since its beginning by US triathletes.75 When all finishers between 1985 and 2012 were considered, most of the finishers originated from the US (47.5%), followed by athletes from Germany (11.7%), Japan (7.9%), Australia (6.7%), Canada (5.2%), Switzerland (2.9%), France (2.3%), Great Britain (2.0%), New Zealand (1.9%), and Austria (1.5%).75 Additionally, US athletes were the fastest in Ironman Hawaii. When the ten fastest race times ever were considered, the fastest women originated from the US (546±7 minutes), followed by women from Great Britain (555±15 minutes) and Switzerland (558±8 minutes). In men, the fastest finishers originated from the US (494±7 minutes), Germany (496±6 minutes), and Australia (497±5 minutes).75
Although Americans invented Ironman Hawaii1 and ultra-triathlons longer than the Ironman distance,4 European athletes dominate ultra-triathlons nowadays.76,77 Between 1985 and 2011, the number of participants increased significantly in Double Iron ultra-triathlons for both sexes and in Triple Iron ultra-triathlons for men.4 Considering all races held worldwide between 1985 and 2011, 56.7% of all races were held in Europe and 37.4% in North America.4 Europeans were not only the most numerous participants, but also the fastest finishers. Europeans comprised 80% of all competitors and won most of the races.4
When we consider the Double Iron ultra-triathlon as the most popular ultra-triathlon distance,4 the number of European triathletes increased between 1985 and 2011 for both women and men. The number of the North American triathletes increased for women, but not for men.77 Apart from the increase in participation, European Double Iron ultra-triathletes were also among the fastest.76,77 When the Double Iron ultra-triathlons held between 1985 and 2010 were investigated, most of the winners originated from Europe (72 victories), followed by North American athletes (17 victories). Race time for the European ultra-triathletes was 1,340±95.3 minutes, and this time decreased highly significantly over the years. North American ultra-triathletes finished within 1,556±124.5 minutes, and their race times showed no changes over the years. Race times of European athletes were highly significantly faster compared to race times of North American athletes.77 It seemed that athletes from Central Europe were the best Double Iron ultra-triathletes.38 Hungarian triathletes showed a significant improvement in both overall race times and in cycling split times, Swiss triathletes improved both their swim and run times, and French triathletes improved their swim times between 1985 and 2011.77
Considering Triple Iron ultra-triathlons, the participation of male Triple Iron ultra-triathletes increased between 1988 and 2011, while the participation of women remained stable at ~8% of the total field.78 Out of the 1,258 participants, 1,077 athletes (85.6%) originated from Europe. The number of male European and male North American athletes increased over the years. European men were faster than both European women and North American men. Male European athletes improved their race time over the years, while European women had impaired overall race times.78
The most likely explanation for the European dominance in ultra-triathlons is their higher participation in each race.76–78 In the Double Iron ultra-triathlons, Europeans account for ~80% of the finishers and won ~80% of the races.4 Similarly, for Ironman Hawaii, US triathletes represented the highest number of participants and achieved the fastest race times.75 In both Ironman and ultra-triathlons, participation rates may correlate with performance.
Other influences on performance in Ironman and ultra-triathlons
Apart from studies investigating associations with potential predictor variables with race times, other aspects need to be addressed to explain the demands for athletes competing in these races.7–69
Nutritional aspects
For Ironman triathletes, carbohydrate depletion and dehydration are likely causes of fatigue, and exercise-associated hyponatremia has been highlighted as a major concern during such races.79 Dehydration and electrolyte balance are important factors in race completion and level of performance. Dehydration is the most common reason for a triathlete to withdraw or fail to finish in the Ironman Hawaii, and exercise-associated hyponatremia is the predominant electrolyte disturbance.80 Several studies investigated fluid40,81–90 and energy 43,44,90 intake in Ironman triathlons and ultra-triathlons.
Considering fluid metabolism, an ultra-endurance exercise such as an Ironman or an ultra-triathlon can lead to exercise-associated hyponatremia,86,88,91 caused mainly by fluid overload86 due to excessive drinking.83,91 Interestingly, the prevalence of exercise-associated hyponatremia was higher in ultra-triathletes (ie, Triple Iron ultra-triathletes)82 compared to reports for Ironman triathletes.83,84 The best action to maintain plasma sodium concentration in Ironman triathletes is ad libitum fluid intake.92 In both female and male Ironman triathletes, the changes in body mass were related to changes in serum sodium concentration.81 Sodium ingestion during the Ironman was associated with a decrease in the extent of body mass loss. However, there is no evidence that sodium ingestion significantly influences changes in plasma sodium concentration,89 most probably due to the fact that participating in an Ironman race does not lead to large sodium losses.86 However, slowing down during the Ironman marathon could be due to hyperthermia and a reduction in plasma sodium concentration.93 Unfortunately for both Ironman and ultra-triathletes, no data exist on a potential relationship between fluid intake and race performance.
Regarding energy metabolism, overall race time was inversely related to carbohydrate intake during the marathon in male Ironman triathletes, but not for female athletes.44 In both female and male Ironman triathletes, total carbohydrate intake rates were negatively correlated to overall race time.90 An increased carbohydrate intake during the marathon might also be a useful strategy for improving Ironman performance in male triathletes.44 Unfortunately, no data exist for a potential association between energy intake and performance in an ultra-triathlon.
Energetic aspects
Athletes competing in an Ironman ingest 3,643 kcal and expend 11,009±664 kcal, leading to an energy deficit of 7,365 kcal.43 Competing in a longer race such as a Quintuple Iron ultra-triathlon held as five Ironman triathlons in 5 days led to positive energy balance (8,095 kcal) in one athlete, although he suffered an average energy deficit of −1,848 kcal per Ironman distance.46 Similarly, the energy deficit during a Deca Iron ultra-triathlon held as ten Ironman triathlons in 5 days resulted in a considerably low energy deficit (11,480 kcal) although the total energy expenditure was high (89,112 kcal).31 While the relative energy deficit in a single Ironman is considerably higher compared to a longer triathlon, the most likely explanation is the lower intensity in the longer ultra-triathlons.
Physiological aspects
Apart from food and fluid intake, physiological characteristics might also be of importance for Ironman and ultra-triathlon performance.28,94–97 Elite triathletes have high maximum oxygen uptake (VO2max) values.28 Interestingly, oxygen consumption (VO2) at anaerobic threshold, percentage of VO2max at anaerobic threshold, and peak power-to-body mass ratio were not related to Ironman race times.97 Regarding split disciplines, VO2 values at the lactate and ventilatory thresholds and fractional utilization of peak VO2 (% peak VO2) were not related to cycling split time.96 However, no study has investigated physiological aspects in ultra-triathletes to date. As the race effort is conducted at very low exercise intensity in ultra-triathlons, VO2max is most probably not a physiological limiter in these races.
Neuromuscular fatigue
An Ironman triathlon is associated with changes in body composition (ie, decrease in fat and muscle mass) as well as decreases in neuromuscular function. A recent study investigating Ironman triathletes showed that peak power, peak velocity, jump height, and rate of force development decreased during an Ironman triathlon.98 Total and positive impulses during a countermovement jump were reduced after the triathlon, while both negative impulses were not different before and after the Ironman. Absolute peak force remained constant during countermovement jumps and squat jumps. Maximal voluntary ground reaction force and peak stiffness during multiple one-legged hopping were decreased after the Ironman. The neuromuscular deficit after the Ironman race was due to impairments in force transmission, resulting in a lower average positive force during countermovement jumps because of a slower rate of force development. An Ironman triathlon leads to a decrease in muscle mass due to glycogen depletion.36,41 An ultra-triathlon, however, leads to a substantial decrease in skeletal muscle mass.33 The neuromuscular fatigue in an ultra-triathlon might be higher compared to an Ironman triathlon.
Limitations and implications for future research
Ultra-triathlons beyond Iron-distance triathlons are a newer and very small sport. At the moment, the data on athletes competing in ultra-triathlon are very limited due to the small number of participants in this sport, which is due to the small number of races held annually. Furthermore, the homogeneous nature of participants may be a confounding variable and may skew the findings. The majority of the participants are male (90%–92%), middle-aged, and European (80% of competitors). The results are limited to field studies, where limited and variable data can be collected. For both Ironman Hawaii and ultra-triathlons, the pacing during the split disciplines, especially in cycling and running, might be investigated to understand how these athletes pace themselves during their races. Most probably, pacing strategies might be different between the different race lengths. Future studies may investigate a potential influence on overall race time of fluid and energy intake during an ultra-triathlon. The investigation of a potential association between physiological characteristics, such as VO2max with overall race time in elite ultra-triathletes, is missing. Psychological aspects have been reported for ultra-marathoners;99,100 however, little is known for triathletes.101,102 Future studies might investigate what motivates both Ironmen and ultra-triathletes.
Conclusion
In summary, the most important predictive variables for a fast overall race time in an ultra-triathlon covering distances longer than the classical Ironman triathlon were male sex, low body fat, an age of 35–40 years, extensive previous experience, a fast split time in cycling and running but not in swimming, and origins in Central Europe. Little is known about female ultra-triathletes and physiological characteristics of these athletes, especially for distances longer than the Triple Iron ultra-triathlon. Future studies need to investigate anthropometric and training characteristics of female ultra-triathletes and what motivates both women and men to compete in these races. Future studies also need to correlate physiological characteristics such as VO2max with ultra-triathlon race performance in order to investigate whether these characteristics are predictive of race performance.
Disclosure
The authors report no conflicts of interest in this work.
References
The Ironman Story [webpage on the Internet]. Available from: http://www.ironman.com/triathlon/history.aspx#axzz3J9L4ftoT. Accessed December 12, 2014. | |
Ironman World Championship, [webpage on the Internet]. Available from: http://www.ironman.com/triathlon/events/americas/ironman/world-championship.aspx#axzz3UOzTj0sC. Accessed December 12, 2014. | |
The 12 Hardest Races in the World [webpage on the Internet]. Available from: http://www.fitbie.com/slideshow/12-hardest-races-world. Accessed December 12, 2014. | |
Lenherr R, Knechtle B, Rüst CA, Rosemann T, Lepers R. From Double Iron to Double Deca Iron ultra-triathlon – a retrospective data analysis from 1985 to 2011. Phys Cult Sport. Stud Res. 2012;54:55–67. | |
Knechtle B, Rosemann T, Lepers R, Rüst CA. A comparison of performance of Deca Iron and Triple Deca Iron ultra-triathletes. Springerplus. 2014;3:461. | |
International Ultra Triathlon Association (IUTA). Available from: http://www.iutasport.com/. Accessed March 14, 2015. | |
Knechtle B, Knechtle P, Lepers R. Participation and performance trends in ultra-triathlons from 1985 to 2009. Scand J Med Sci Sports. 2011;21: e82–e90. | |
Rüst CA, Rosemann T, Knechtle B. Performance and sex difference in ultra-triathlon performance from Ironman to Double Deca Iron ultra-triathlon between 1978 and 2013. Springerplus. 2014;3:219. | |
Rüst CA, Lepers R, Stiefel M, Rosemann T, Knechtle B. Performance in Olympic triathlon: changes in performance of elite female and male triathletes in the ITU World Triathlon Series from 2009 to 2012. Springerplus. 2013;2:685. | |
Meili D, Knechtle B, Rüst CA, Rosemann T, Lepers R. Participation and performance trends in ‘Ultraman Hawaii’ from 1983 to 2012. Extrem Physiol Med. 2013;2:25. | |
Rüst CA, Knechtle B, Knechtle P, Rosemann T, Lepers R. Sex differences in ultra-triathlon performance at increasing race distance. Percept Mot Skills. 2013;116:690–706. | |
Sigg K, Knechtle B, Rüst CA, Knechtle P, Lepers R, Rosemann T. Sex difference in Double Iron ultra-triathlon performance. Extrem Physiol Med. 2013;2:12. | |
Lepers R. Analysis of Hawaii ironman performances in elite triathletes from 1981 to 2007. Med Sci Sports Exerc. 2008;40:1828–1834. | |
Rüst CA, Knechtle B, Rosemann T, Lepers R. Sex difference in race performance and age of peak performance in the Ironman Triathlon World Championship from 1983 to 2012. Extrem Physiol Med. 2012;1:15. | |
Rüst CA, Knechtle B, Knechtle P, Rosemann T, Lepers R. Participation and performance in Triple Iron ultra-triathlon – a cross-sectional and longitudinal data analysis. Asian J Sports Med. 2012;3:145–152. | |
Mitchell JH, Tate C, Raven P, et al. Acute response and chronic adaptation to exercise in women. Med Sci Sports Exerc. 1992;24:S258–S265. | |
George KP, Wolfe LA, Burggraf GW, Norman R. Electrocardiographic and echocardiographic characteristics of female athletes. Med Sci Sports Exerc. 1995;27:1362–1370. | |
Lepers R, Maffiuletti NA. Age and gender interactions in ultraendurance performance: insight from the triathlon. Med Sci Sports Exerc. 2011;43:134–139. | |
Lepers R, Sultana F, Bernard T, Hausswirth C, Brisswalter J. Age-related changes in triathlon performances. Int J Sports Med. 2010;31:251–256. | |
Lepers R, Rüst CA, Stapley PJ, Knechtle B. Relative improvements in endurance performance with age: evidence from 25 years of Hawaii Ironman racing. Age (Dordr). 2013;35:953–962. | |
Stiefel M, Knechtle B, Rüst CA, Rosemann T, Lepers R. The age of peak performance in Ironman triathlon: a cross-sectional and longitudinal data analysis. Extrem Physiol Med. 2013;2:27. | |
Stiefel M, Rüst CA, Rosemann T, Knechtle B. A comparison of participation and performance in age-group finishers competing in and qualifying for Ironman Hawaii. Int J Gen Med. 2013;6:67–77. | |
Stiefel M, Knechtle B, Lepers R. Master triathletes have not reached limits in their Ironman triathlon performance. Scand J Med Sci Sports. 2014;24:89–97. | |
Knechtle B, Rüst CA, Knechtle P, Rosemann T, Lepers R. Age-related changes in ultra-triathlon performances. Extrem Physiol Med. 2012;1:5. | |
Gallmann D, Knechtle B, Rüst CA, Rosemann T, Lepers R. Elite triathletes in ‘Ironman Hawaii’ get older but faster. Age (Dordr) 2014;36:407–416. | |
Knechtle R, Rüst CA, Rosemann T, Knechtle B. The best triathletes are older in longer race distances – a comparison between Olympic, Half-Ironman and Ironman distance triathlon. Springerplus. 2014;3:538. | |
Silva DA, Benedetti TR, Ferrari EP, et al. Anthropometric profiles of elite older triathletes in the Ironman Brazil compared with those of young Portuguese triathletes and older Brazilians. J Sports Sci. 2012;30:479–484. | |
Sleivert GG, Rowlands DS. Physical and physiological factors associated with success in the triathlon. Sports Med. 1996;22:8–18. | |
Herbst L, Knechtle B, Lopez CL, et al. Pacing strategy and change in body composition during a Deca Iron triathlon. Chin J Physiol. 2011;54:255–263. | |
Knechtle B, Schwanke M, Knechtle P, Kohler G. Decrease in body fat during an ultra-endurance triathlon is associated with race intensity. Br J Sports Med. 2008;42:609–613. | |
Knechtle B, Knechtle P, Schück R, Andonie JL, Kohler G. Effects of a Deca Iron Triathlon on body composition – a case study. Int J Sports Med. 2008;29:343–351. | |
Knechtle B, Fraire SO, Andonie JL, Kohler G. A multi-stage ultra-endurance triathlon leads to a decrease of body fat but not of skeletal muscle mass – the World Challenge Deca Iron 2006. Br J Sports Med. 2008;42:121–125. | |
Knechtle B, Duff B, Amtmann G, Kohler G. An ultra-triathlon leads to a decrease of body fat and skeletal muscle mass – the Triple Iron Triathlon Austria 2006. Res Sports Med. 2008;6:97–110. | |
Knechtle B, Knechtle P, Rosemann T, Oliver S. A Triple Iron triathlon leads to a decrease in total body mass but not to dehydration. Res Q Exerc Sport. 2010;81:319–327. | |
Barrero A, Chaverri D, Erola P, Iglesias X, Rodríguez FA. Intensity profile during an ultra-endurance triathlon in relation to testing and performance. Int J Sports Med. 2014;35:1170–1178. | |
Cuddy JS, Slivka DR, Hailes WS, Dumke CL, Ruby BC. Metabolic profile of the Ironman World Championships: a case study. Int J Sports Physiol Perform. 2010;5:570–576. | |
Hew-Butler T, Collins M, Bosch A, et al. Maintenance of plasma volume and serum sodium concentration despite body weight loss in ironman triathletes. Clin J Sport Med. 2007;17:116–122. | |
Laursen PB, Suriano R, Quod MJ, et al. Core temperature and hydration status during an Ironman triathlon. Br J Sports Med. 2006;40:320–325. | |
Knechtle B, Baumann B, Wirth A, Knechtle P, Rosemann T. Male ironman triathletes lose skeletal muscle mass. Asia Pac J Clin Nutr. 2010;19:91–97. | |
Sharwood K, Collins M, Goedecke J, Wilson G, Noakes T. Weight changes, sodium levels, and performance in the South African Ironman Triathlon. Clin J Sport Med. 2002;12:391–399. | |
Mueller SM, Anliker E, Knechtle P, Knechtle B, Toigo M. Changes in body composition in triathletes during an Ironman race. Eur J Appl Physiol. 2013;113:2343–2352. | |
Knechtle B, Wirth A, Baumann B, et al. An ironman triathlon does not lead to a change in body mass in female triathletes. Res Sports Med. 2010;18:115–126. | |
Barrero A, Erola P, Bescós R. Energy balance of triathletes during an ultra-endurance event. Nutrients. 2014;7:209–222. | |
Kimber NE, Ross JJ, Mason SL, Speedy DB. Energy balance during an ironman triathlon in male and female triathletes. Int J Sport Nutr Exerc Metab. 2002;12:47–62. | |
Bernheim A, Attenhofer Jost CH, Zuber M, et al. The right ventricle best predicts the race performance in amateur Ironman athletes. Med Sci Sports Exerc. 2013;45:1593–1599. | |
Knechtle B, Knechtle P, Andonie JL, Kohler G. Body composition, energy, and fluid turnover in a five-day multistage ultratriathlon: a case study. Res Sports Med. 2009;17:104–120. | |
Knechtle B, Wirth A, Knechtle P, Baumann B, Rosemann T, Senn O. Differential correlations between anthropometry, training volume and performance in male and female Ironman triathletes. J Strength Cond Res. 2010;24:2785–2793. | |
Knechtle B, Wirth A, Rüst CA, Rosemann T. Relationship between anthropometry and split performance in recreational male Ironman triathletes. Asian J Sports Med. 2011;2:23–30. | |
Gilinsky N, Hawkins KR, Tokar TN, Cooper JA. Predictive variables for half-Ironman triathlon performance. J Sci Med Sport. 2014;17:300–305. | |
Knechtle B, Knechtle P, Rosemann T. Upper body skin-fold thickness is related to race performance in male Ironman triathletes. Int J Sports Med. 2011;32:20–27. | |
Rüst CA, Knechtle B, Knechtle P, Wirth A, Rosemann T. A comparison of anthropometric and training characteristics among recreational male Ironman triathletes and ultra-endurance cyclists. Chin J Physiol. 2012;55:114–124. | |
Knechtle B, Knechtle P, Andonie JL, Kohler G. Influence of body anthropometry on race performance in extreme endurance triathletes – World Challenge Deca Iron Triathlon 2006. Br J Sports Med. 2007;41:644–648. | |
Knechtle B, Kohler G. Running performance not anthropometric factors is associated with race success in a Triple Iron Triathlon. Br J Sports Med. 2009;43:437–441. | |
Knechtle B, Knechtle P, Rosemann T. Similarity of anthropometric measures for male ultra-triathletes and ultra-runners. Percept Mot Skills. 2010;111:805–818. | |
Knechtle B, Knechtle P, Rosemann T, Senn O. Personal best time, not anthropometry or training volume, is associated with race performance in a Triple Iron Triathlon. J Strength Cond Res. 2011;25:1142–1150. | |
Knechtle B, Knechtle P, Rüst CA, Rosemann T. A comparison of anthropometric and training characteristics of Ironman triathletes and Triple Iron ultra-triathletes. J Sports Sci. 2011;29:1373–1380. | |
Kandel M, Baeyens JP, Clarys P. Somatotype, training and performance in Ironman athletes. Eur J Sport Sci. 2014;14:301–308. | |
Knechtle B, Wirth A, Baumann B, Knechtle P, Rosemann T. Personal best time, percent body fat, and training are differently associated with race time for male and female Ironman triathletes. Res Q Exerc Sport. 2010;81:62–68. | |
Zouhal H, Groussard C, Minter G, et al. Inverse relationship between percentage body weight change and finishing time in 643 forty-two-kilometre marathon runners. Br J Sports Med. 2011;45:1101–1105. | |
Zouhal H, Groussard C, Vincent S, et al. Athletic performance and weight changes during the “Marathon of Sands” in athletes well-trained in endurance. Int J Sports Med. 2009;30:516–521. | |
Rüst CA, Knechtle B, Knechtle P, Wirth A, Rosemann T. Body mass change and ultraendurance performance: a decrease in body mass is associated with an increased running speed in male 100-km ultramarathoners. J Strength Cond Res. 2012;26:1505–1516. | |
Knechtle B, Knechtle P, Wirth A, Alexander Rüst C, Rosemann T. A faster running speed is associated with a greater body weight loss in 100-km ultra-marathoners. J Sports Sci. 2012;30:1131–1140. | |
Lepers R, Knechtle P, Knechtle B, Rosemann T. Analysis of ultra-triathlon performances. Open Access J Sports Med. 2011;2:131–136. | |
Rüst CA, Knechtle B, Wirth A, et al. Personal best times in an Olympic distance triathlon and a marathon predict an ironman race time for recreational female triathletes. Chin J Physiol. 2012;55:156–162. | |
Rüst CA, Knechtle B, Knechtle P, Rosemann T, Lepers R. Personal best times in an Olympic distance triathlon and in a marathon predict Ironman race time in recreational male triathletes. Open Access J Sports Med. 2011;2:121–129. | |
Knechtle B, Wirth A, Rosemann T. Predictors of race time in male Ironman triathletes: physical characteristics, training, or prerace experience? Percept Mot Skills. 2010;111:437–446. | |
Gulbin JP, Gaffney PT. Ultraendurance triathlon participation: typical race preparation of lower level triathletes. J Sports Med Phys Fitness. 1999;39:12–15. | |
Ulsamer S, Rüst CA, Rosemann T, Lepers R, Knechtle B. Swimming performances in long distance open-water events with and without wetsuit. BMC Sports Sci Med Rehabil. 2014;6:20. | |
Etxebarria N, Anson JM, Pyne DB, Ferguson RA. High-intensity cycle interval training improves cycling and running performance in triathletes. Eur J Sport Sci. 2014;14:521–529. | |
Knechtle B, Knechtle P, Rosemann T. Skin-fold thickness and training volume in ultra-triathletes. Int J Sports Med. 2009;30:343–347. | |
Knechtle B, Rüst CA, Rosemann T, Martin N. 33 Ironman triathlons in 33 days – a case study. Springerplus. 2014;3:269. | |
Knechtle B, Zingg M, Rosemann T, Rüst CA. Sex difference in top performers from Ironman to Double Deca Iron ultra-triathlon. Open Access J Sports Med. 2014;5:159–172. | |
Abbiss CR, Quod MJ, Martin DT, et al. Dynamic pacing strategies during the cycle phase of an Ironman triathlon. Med Sci Sports Exerc. 2006;38:726–734. | |
Johnson EC, Pryor JL, Casa DJ, et al. Bike and run pacing on downhill segments predict Ironman triathlon relative success. J Sci Med Sport. 2015;18:82–87. | |
Dähler P, Rüst CA, Rosemann T, Lepers R, Knechtle B. Nation related participation and performance trends in ‘Ironman Hawaii’ from 1985 to 2012. BMC Sports Sci Med Rehabil. 2014;6:16. | |
Rüst CA, Knechtle B, Knechtle P, Lepers R, Rosemann T, Onywera V. European athletes dominate performances in Double Iron ultra-triathlons – a retrospective data analysis from 1985 to 2010. Eur J Sport Sci. 2014;14:S39–S50. | |
Sigg K, Knechtle B, Rüst CA, Knechtle P, Rosemann T, Lepers R. Central European athletes dominate Double Iron ultra-triathlon – analysis of participation and performance from 1985 to 2011. Open Access J Sports Med. 2012;3:159–168. | |
Jeffery S, Knechtle B, Rüst CA, Knechtle P, Lepers R, Rosemann T. European dominance in Triple Iron ultra-triathlons from 1988 to 2011. J Sci Cycl. 2012;1:30–38. | |
Robins A. Nutritional recommendations for competing in the Ironman triathlon. Curr Sports Med Rep. 2007;6:241–248. | |
Hiller WD. Dehydration and hyponatremia during triathlons. Med Sci Sports Exerc. 1989;21:S219–S221. | |
Pahnke MD, Trinity JD, Zachwieja JJ, Stofan JR, Hiller WD, Coyle EF. Serum sodium concentration changes are related to fluid balance and sweat sodium loss. Med Sci Sports Exerc. 2010;42:1669–1674. | |
Rüst CA, Knechtle B, Knechtle P, Rosemann T. Higher prevalence of exercise-associated hyponatremia in triple iron ultra-triathletes than reported for ironman triathletes. Chin J Physiol. 2012;55:147–155. | |
Speedy DB, Noakes TD, Rogers IR, et al. Hyponatremia in ultradistance triathletes. Med Sci Sports Exerc. 1999;31:809–815. | |
Speedy DB, Rogers IR, Noakes TD, et al. Exercise-induced hyponatremia in ultradistance triathletes is caused by inappropriate fluid retention. Clin J Sport Med. 2000;10:272–278. | |
Speedy DB, Rogers IR, Noakes TD, et al. Diagnosis and prevention of hyponatremia at an ultradistance triathlon. Clin J Sport Med. 2000;10:52–58. | |
Speedy DB, Noakes TD, et al. A prospective study of exercise-associated hyponatremia in two ultradistance triathletes. Clin J Sport Med. 2000;10:136–141. | |
Speedy DB, Noakes TD, Kimber NE, et al. Fluid balance during and after an ironman triathlon. Clin J Sport Med. 2001;11:44–50. | |
Speedy DB, Noakes TD, Boswell T, Thompson JM, Rehrer N, Boswell DR. Response to a fluid load in athletes with a history of exercise induced hyponatremia. Med Sci Sports Exerc. 2001;33:1434–1442. | |
Speedy DB, Thompson JM, Rodgers I, Collins M, Sharwood K, Noakes TD. Oral salt supplementation during ultradistance exercise. Clin J Sport Med. 2002;12:279–284. | |
Pfeiffer B, Stellingwerff T, Hodgson AB, et al. Nutritional intake and gastrointestinal problems during competitive endurance events. Med Sci Sports Exerc. 2012;44:344–351. | |
Noakes TD, Sharwood K, Collins M, Perkins DR. The dipsomania of great distance: water intoxication in an Ironman triathlete. Br J Sports Med. 2004;38:E16. | |
Meyer M, Knechtle B, Bürge J, et al. Ad libitum fluid intake leads to no leg swelling in male Ironman triathletes – an observational field study. J Int Soc Sports Nutr. 2012;9:40. | |
Laursen PB, Watson G, Abbiss CR, Wall BA, Nosaka K. Hyperthermic fatigue precedes a rapid reduction in serum sodium in an ironman triathlete: a case report. Int J Sports Physiol Perform. 2009;4:533–537. | |
Laursen PB, Rhodes EC, Langill RH, McKenzie DC, Taunton JE. Relationship of exercise test variables to cycling performance in an Ironman triathlon. Eur J Appl Physiol. 2002;87:433–440. | |
Laursen PB, Knez WL, Shing CM, Langill RH, Rhodes EC, Jenkins DG. Relationship between laboratory-measured variables and heart rate during an ultra-endurance triathlon. J Sports Sci. 2005;23:1111–1120. | |
O’Toole ML, Douglas PS, Hiller WD. Lactate, oxygen uptake, and cycling performance in triathletes. Int J Sports Med. 1989;10:413–418. | |
Whyte G, Lumley S, George K, et al. Physiological profile and predictors of cycling performance in ultra-endurance triathletes. J Sports Med Phys Fitness. 2000;40:103–109. | |
Mueller SM, Knechtle P, Knechtle B, Toigo M. An Ironman triathlon reduces neuromuscular performance due to impaired force transmission and reduced leg stiffness. Eur J Appl Physiol. Epub December 4, 2014. | |
Lane AM, Wilson M. Emotions and trait emotional intelligence among ultra-endurance runners. J Sci Med Sport. 2011;14:358–362. | |
Krouse RZ, Ransdell LB, Lucas SM, Pritchard ME. Motivation, goal orientation, coaching, and training habits of women ultrarunners. J Strength Cond Res. 2011;25:2835–2842. | |
Parry D, Chinnasamy C, Papadopoulou E, Noakes T, Micklewright D. Cognition and performance: anxiety, mood and perceived exertion among Ironman triathletes. Br J Sports Med. 2011;45:1088–1094. | |
López-Fernández I, Merino-Marbán R, Fernández-Rodríguez E. Examining the relationship between sex and motivation in triathletes. Percept Mot Skills. 2014;119:42–49. |
 © 2015 The Author(s). This work is published and licensed by Dove Medical Press Limited. The
full terms of this license are available at https://www.dovepress.com/terms
and incorporate the Creative Commons Attribution
- Non Commercial (unported, 3.0) License.
By accessing the work you hereby accept the Terms. Non-commercial uses of the work are permitted
without any further permission from Dove Medical Press Limited, provided the work is properly
attributed. For permission for commercial use of this work, please see paragraphs 4.2 and 5 of our Terms.
© 2015 The Author(s). This work is published and licensed by Dove Medical Press Limited. The
full terms of this license are available at https://www.dovepress.com/terms
and incorporate the Creative Commons Attribution
- Non Commercial (unported, 3.0) License.
By accessing the work you hereby accept the Terms. Non-commercial uses of the work are permitted
without any further permission from Dove Medical Press Limited, provided the work is properly
attributed. For permission for commercial use of this work, please see paragraphs 4.2 and 5 of our Terms.