Back to Journals » Patient Preference and Adherence » Volume 14
What Do Men with Lower Urinary Tract Symptoms Expect from a Urologist in Secondary Care?
Authors Brandenbarg P ![]() , Rooijers P, Steffens MG, van Balken MR
, Rooijers P, Steffens MG, van Balken MR ![]() , Mulder HJ
, Mulder HJ ![]() , Blanker MH
, Blanker MH ![]()
Received 12 June 2020
Accepted for publication 17 July 2020
Published 19 August 2020 Volume 2020:14 Pages 1455—1462
DOI https://doi.org/10.2147/PPA.S264994
Checked for plagiarism Yes
Review by Single anonymous peer review
Peer reviewer comments 2
Editor who approved publication: Dr Johnny Chen
Pim Brandenbarg,1 Puk Rooijers,1 Martijn G Steffens,2 Michael R van Balken,3 Henk-Jan Mulder,4 Marco H Blanker1
1University of Groningen, University Medical Centre Groningen, Department of General Practice & Elderly Care Medicine, Groningen, The Netherlands; 2Isala Clinics, Department of Urology, Zwolle, The Netherlands; 3Rijnstate Hospital, Department of Urology, Arnhem, The Netherlands; 4Martini Hospital, Department of Urology, Groningen, The Netherlands
Correspondence: Marco H Blanker
University of Groningen, University Medical Centre Groningen, Department of General Practice & Elderly Care Medicine, Groningen, The Netherlands
Tel +31 50 361 6729
Email [email protected]
Purpose: To identify the expectations of men with LUTS referred to a urologist and to study the association between those expectations and satisfaction with the care provided.
Methods: In this prospective cohort study, adult men with LUTS completed a questionnaire before their first outpatient appointment, and again at 6 and 12 weeks. The questionnaires included IPSS and OABq-SF, and self-constructed questions on patient expectations, outcome of expectations and satisfaction.
Results: Data from 182 participants showed positive expectations about the urologist performing examinations, providing explanations and finding the underlying cause, but mostly neutral expectations for treatment plans and outcomes. Positive treatment expectations were associated with positive expectations about outcomes after physiotherapy, drug treatment and surgery. Higher symptom scores and age were associated with higher expectations about drug treatment. Expectations were subjectively and objectively fulfilled for 66.4% and 27.3%, respectively. Symptom improvement (decrease in IPSS scores) was significantly more in men with objectively fulfilled expectations than in men with no unfulfilled expectations. No significant difference was present between men with subjectively fulfilled expectations and men with unfulfilled expectations. However, satisfaction was significantly higher for patients with subjectively fulfilled expectations at 6 and 12 weeks compared with those who had unfulfilled expectations.
Conclusion: Most men referred to a urologist with LUTS do express clear expectations about treatment in secondary care. Patients with higher expectations for treatment outcomes are more likely to expect to receive that treatment. Satisfaction with the care of a urologist is also higher when patients self-report that they receive the treatment they expected.
Keywords: lower urinary tract symptoms, LUTS, expectations, satisfaction, urologist
Introduction
About 60–70% of all men with lower urinary tract symptoms (LUTS) consult their general practitioner (GP).1 Initially, a GP may provide education about the benign nature of their symptoms and offer non-medical and medical treatments, such as alpha-blockers.2–4 In the primary care setting, generally, no additional testing is applied, and treatment involves a trial and error approach, especially with alpha-blockers.2 If these treatments are ineffective, however, the GP may consider referring men to urologists for additional investigation and treatment. This may include not only prescribing other drugs but also performing invasive treatments, such as transurethral resection of the prostate.5,6
Patient opinions and expectations are important when deciding on treatment options, with evidence in other fields suggesting that patient-centered care is associated with improved outcomes and satisfaction.7 Notably, higher treatment expectations result in better treatment outcomes,8,9 and their fulfilment leads to greater treatment satisfaction.9 Certain patient characteristics influence these expectations.10 Unfortunately, when expectations are unrealistically high and cannot be met, the result may be decreased satisfaction or dissatisfaction.11 Although these data indicate the benefits of knowing a patient’s expectations, we are unaware of any studies describing expectations among male patients with LUTS. This is an important knowledge gap because such information may help urologists gain a better understanding of the needs of these patients to enable them to deliver more tailored care.
In this study, we aim to identify the expectations of men with LUTS who are referred to a urologist. To further our understanding, we then studied the association between patient expectations and satisfaction related to the care of a urologist.
Patients and Methods
Study Design and Participants
We conducted a prospective cohort study into the effects of an online self-management program, as has been described elsewhere.12 Participants were recruited through the urology outpatient departments of three large teaching hospitals in the Netherlands between April 2017 and March 2018. We included men older than 18 who were referred for the first time with LUTS, who had no history of acute urinary retention, recurrent urinary tract infections, or known prostate, or bladder abnormalities. In general, based only on symptoms, no diagnose can be put in order. So, we follow the International Continence Society definitions of symptoms, and use the term LUTS. The cohort study consisted of two parts. In the first period, all men received care as usual, in the second period, men also received access to an online self-management program, after their first outpatient clinic consultation. The baseline assessment and follow-up questionnaires in this cohort study were the same for both periods of patient recruitment.12
Invitations were by post before their first consultation. Men were not invited if it was clear from their referral letter that they had (1) a history of prostate or bladder cancer, (2) previous lower urinary tract surgery, (3) neurogenic bladder or (4) an indication for acute intervention (eg, urinary retention).
Information was provided to patients in a letter and a video message. A member of the research team met with candidate participants 20–30 minutes before their appointment with the urologist. During this meeting, eligibility criteria were checked, and we excluded any men who were unable to understand Dutch. Participants were given an opportunity to ask questions, before being asked to sign the informed consent form and to turn in the baseline questionnaire. Men were excluded from follow-up if the assessment by the urologist suggested that they may have bladder cancer, prostate cancer, urethral stricture or neurogenic bladder. Two concurrent recruitment phases were used in each hospital. Participants in the first phase received care as usual, whereas participants in the second phase received care as usual plus access to an online self-management program.
Data Collection
Data collection was by three questionnaires: one before their first appointment with the urologist, one 6 weeks later and one 12 weeks later.
In the baseline questionnaire, we inventoried patient characteristics, symptom severity and patient expectations. We measured symptom severity by the international prostate symptom score (IPSS),13 and the overactive bladder questionnaire – short form (OAB-q SF).14 Expectations were categorized as follows: (1) expectations of the general care of the urologist with 4 questions, (2) expectations of the treatment plan with 4 questions and (3) expectations of the treatment outcomes with 6 questions. For each question, we used a 5-point Likert scale ranging from “very unlikely” to “very likely”. In the absence of validated questionnaires for this purpose, we used a self-constructed, non-validated questionnaire (see Supplementary file 1 for the questions on expectations).
At 6 weeks, the IPSS and OAB-q-SF were repeated and we obtained information on the received treatment, consistency with prior expectations and satisfaction with treatment. Consistency with expectations and satisfaction were rated on 5-point Likert scales, ranging from “strongly disagree” to “strongly agree”. At 12 weeks, the treatment received and the satisfaction with that treatment were again assessed, but using a 7-point Likert-type scale (ranging from “absolutely satisfied” to “absolutely not satisfied”). The IPSS and OABq-SF were also repeated, and the Perceived Global Impression of Improvement (PGI-I) was added.15
Follow-up questionnaires were sent according to participant preference by e-mail or post. Participants who did not return the follow-up questionnaire within 2 weeks received a reminder. If participants did not respond, no further reminders were sent. However, non-responders after 6 weeks still received the follow-up questionnaire at 12 weeks.
Outcome Measures
The primary outcome measure was the patient expectations at baseline. Secondary outcome measures were treatment satisfaction and the association between expectations and chosen therapy after 6 weeks.
Statistical Analyses
We performed all analyses with IBM SPSS version 25 (IBM Corp., Armonk, NY, USA), using the full data set. Missing values were not imputed, and we considered a p-value of 0.05 or smaller to be statistically significant in all analyses. The expectations of patients are displayed as frequencies and percentages.
Patient Expectations at Baseline
Answers on the 5-point Likert scale were grouped as positive expectations (“very likely” and “likely”), neutral expectations (“neutral”) and negative expectations (“unlikely” and “very unlikely”). For analysis, the neutral expectations group was combined with the negative expectations group. This was an arbitrary choice, for which no firm rationale is present. We then explored the expectations toward active treatment options (physiotherapy, medication and surgery) by testing if expectations differed by age group, symptom severity and expected treatment outcomes, using multivariable logistic regression analyses. Nagelkerke R2 was used to show the percentage of explained variance for the model.
Agreement Between Expected and Actual Treatment
The characteristics of responders and non-responders were checked for imbalances in age, body mass index, education level and baseline IPSS score. For these analyses, we excluded all men who appeared to have prostate or bladder cancer after the outpatient assessment.
Agreement between the received and expected treatments at 6 weeks was defined in two ways. First, we defined “objective agreement” based on the reported expectations at baseline and categorized participants into “expectations met” and “expectations unmet” groups (eg, if at baseline a participant expressed the expectation to receive drug therapy, and after 6 weeks reported to have received drug therapy, the expectations were met). Second, we defined “subjective agreement” based on response to whether treatment was deemed consistent with initial expectations (asked in the second questionnaire at 6 weeks), dividing responders into an agreement group (“agree” and “strongly agree”) and a non-agreement group (all other responses). We then compared both measures of agreement. For each measure of agreement, we tested the difference in satisfaction between groups using the Mann–Whitney U-test.
Treatment Outcomes
We also explored if agreement between expected and actual treatment improved outcomes. First, we used the change in IPSS from the baseline to the follow-up questionnaire (ie, delta-IPSS). The delta-IPSS was then compared for both measures of agreement by independent sample t-tests. Second, we dichotomized the PGI-I score, as completed at 12 weeks, into clear improvement (“much better” and “very much better”) and no clear improvement (all other responses). These categories were compared for both measures of agreement by chi-square tests. Given that measures of agreement were assessed at 6 weeks, we added a post-hoc analysis for the subgroup of men with no change in treatment between 6 and 12 weeks.
Patient Satisfaction
Finally, we explored the predictors of positive patient satisfaction with the provided care at both 6 and 12 weeks. For this, we dichotomized responses to the statement “I am satisfied with the treatment provided by the urologist” after 6 weeks into satisfied (“agree” or “definitely agree”) or dissatisfied (all other responses). For data at 12 weeks, we combined “absolutely satisfied”, “very satisfied” and “somewhat satisfied” into a satisfied category and all other responses into a dissatisfied category. Logistic regression analyses were then performed, using patient satisfaction as the dependent variable. We added age, delta-IPSS, subjective agreement and objective agreement as independent variables. The Nagelkerke R2 was used to present the percentage of explained variance of the multivariable model.
Results
In total, 187 of the 349 (54%) invited men agreed to participate. Another 5 participants were excluded because they had either already undergone surgery for BPH (n = 1) or they had complete (n = 2) or partial (n = 2) missing data at baseline. The remaining 182 participants constitute the baseline cohort for which characteristics are presented in Table 1. A flow chart for study inclusion is presented in Supplementary File 2.
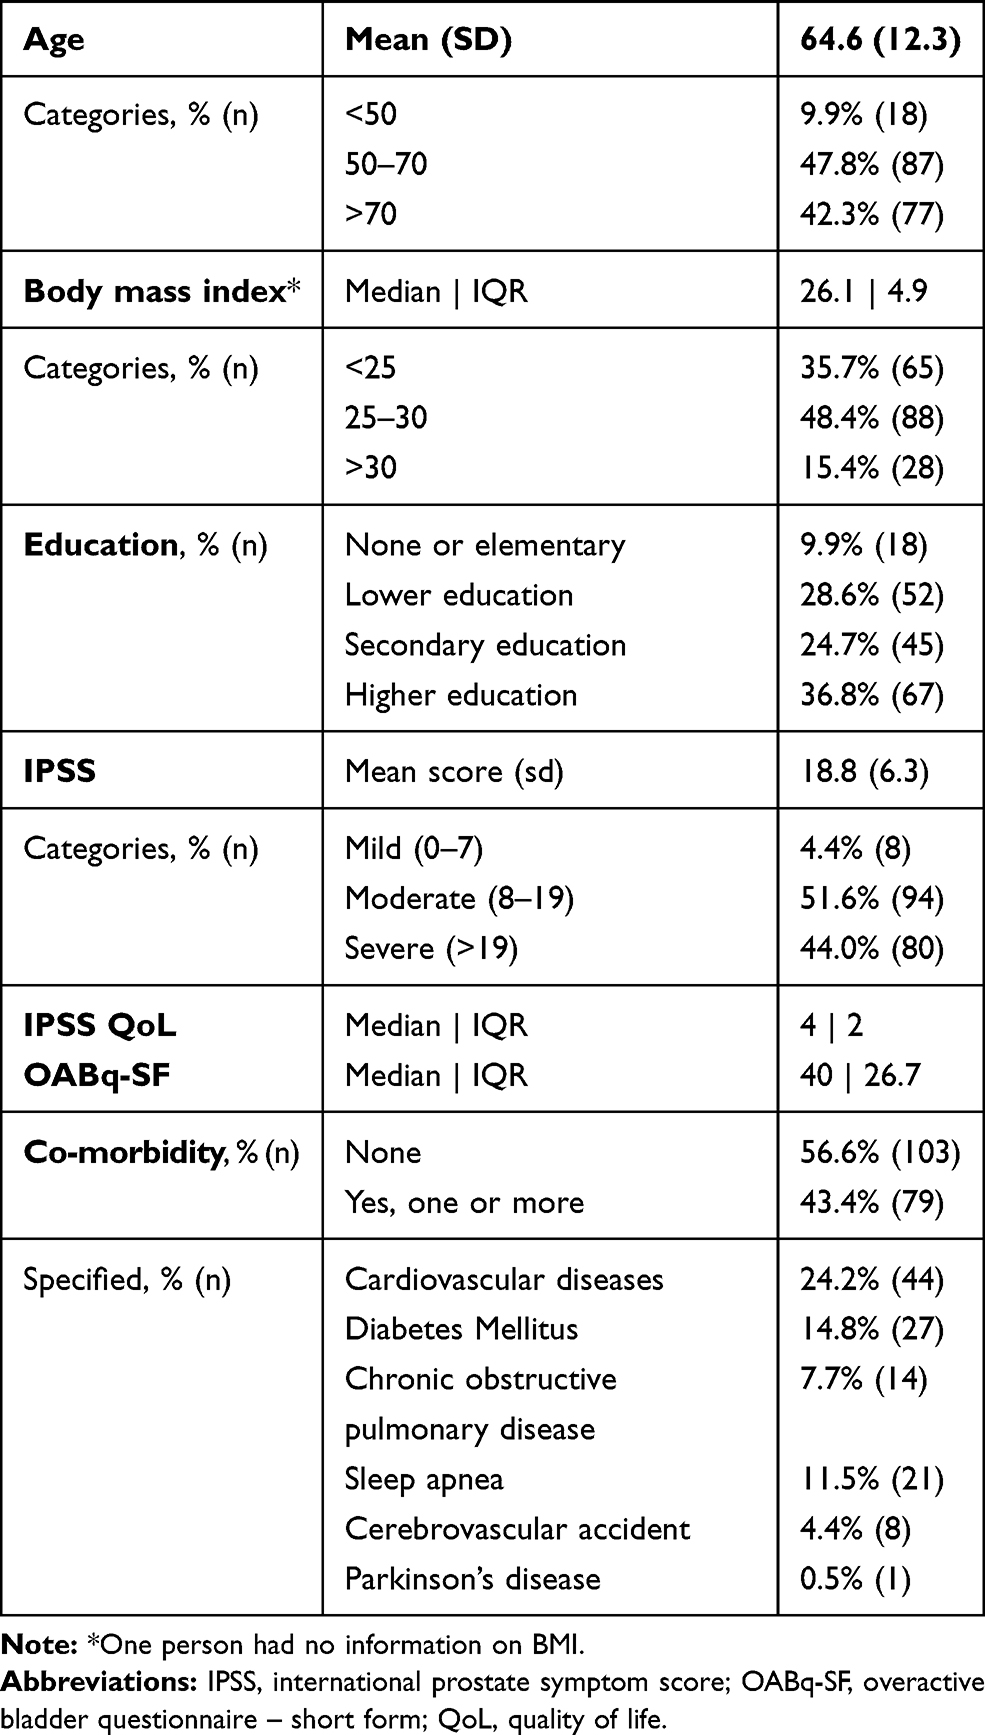 |
Table 1 Baseline Characteristics of 182 Men Referred to Secondary Care |
Patient Expectations
The expectations of participants at the baseline assessment are summarized in Figure 1. Most patients were positive about the urologist performing examinations (90%), providing an explanation about the cause of their symptoms (97%), finding the underlying cause of their symptoms (83%) and collaborating in the forming of a treatment plan (88%). Concerning the treatment plans themselves, 41.2–46.7% of participants had neutral expectations. However, participants had positive expectations of lifestyle advice (51%) and drug treatments (43%), but negative expectations of physiotherapy (43%) and surgery (33%).
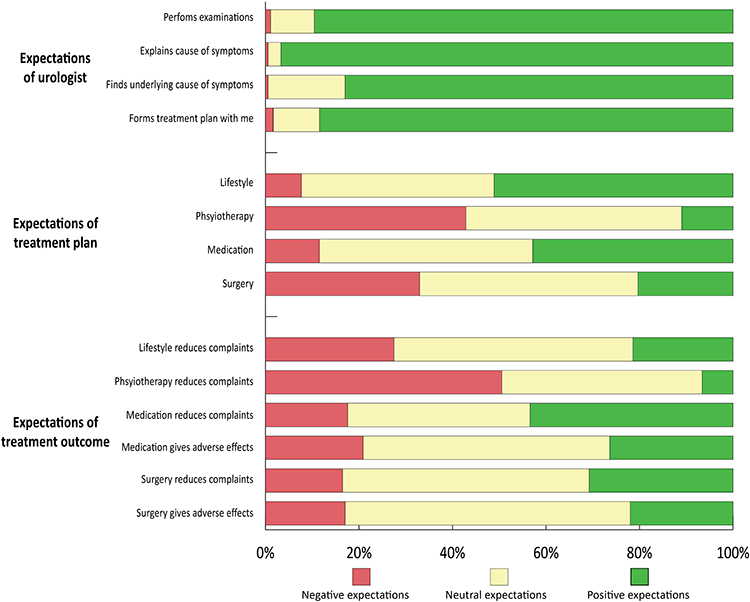 |
Figure 1 Patient expectations of outpatient care provided by urologists. The figure shows the proportion of participants with negative (red), neutral (yellow) and positive (green) expectations. |
Many men (39.0–52.7%) had neutral expectations about the ability of treatments to reduce symptoms, while drug treatment (43.4%) and surgery (30.8%) were associated with the most positive expectations, and physiotherapy (50.5%) was associated with the most negative expectations. Expectations about reducing complaints with lifestyle advice were divided, with 27.5%, 51.1% and 21.4% expressing negative, neutral and positive expectations, respectively. Concerning adverse effects, participants had neutral expectations of drug treatment (52.7%) and surgery (61.0%).
As shown in Table 2, positive expectations about treatment were clearly associated with positive expectations about outcomes. Higher symptom scores were associated with expectations about drug treatment, but not with expectations about surgery and physiotherapy. Age was associated with treatment expectations only for drug treatment (Nagelkerke R2 0.38).
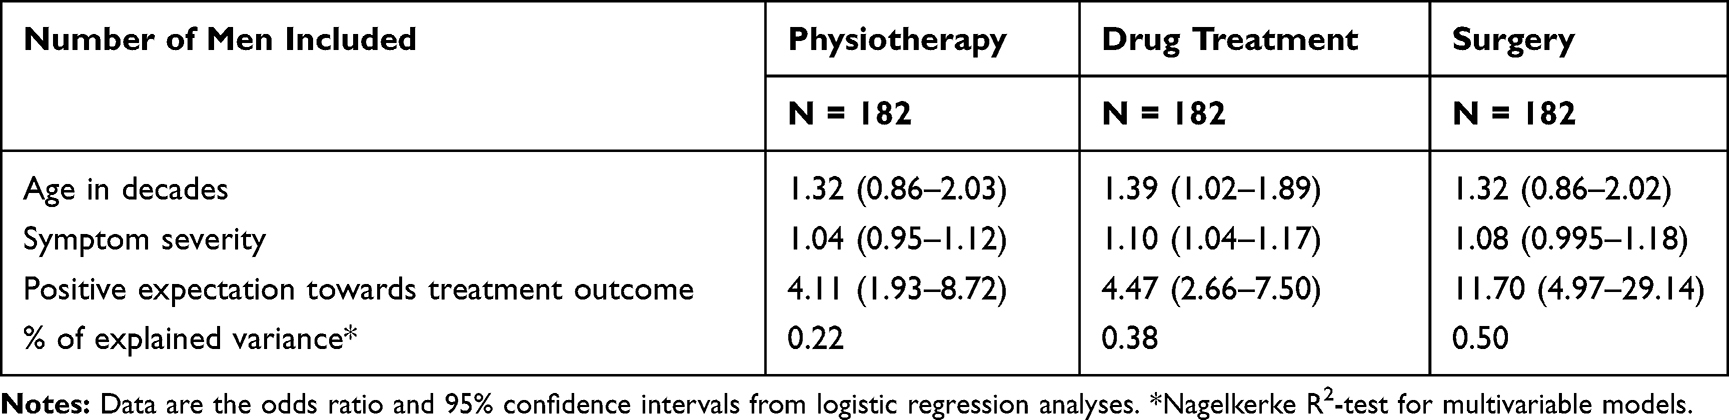 |
Table 2 Associations Between Positive Expectations About Receiving a Treatment and the Age, Symptoms Severity and Expectation of Receiving a Specific Treatment |
Agreement Between Expected and Actual Treatment
We excluded 17 men who appeared to have urethral strictures, prostate cancer or bladder cancer. Another 21 and 20 participants were lost to follow-up at 6 and 12 weeks, respectively. The non-responders at 6 weeks were significantly younger than the responders (57.8 ± 12.2 vs 65.2 ± 12.5 years; t = −2.540, p = 0.012), but other characteristics did not differ. This pattern was repeated at 12 weeks, with non-responders again being significant younger (59.0 ± 16.3 vs 66.2 ± 11.5 years; t = - 2.434, p = 0.016). In the remaining 144 participants at 6 weeks, objective agreement was noted between expected and actual treatment in 27.8% of cases, whereas subjective agreement was noted in 66.0%. There was agreement between subjective and objective agreement in only 22 cases (Table 3).
 |
Table 3 Comparison of Subjective and Objective Agreement Between Expected and Actual Treatment at 6 Weeks |
Treatment Outcomes
Overall, 29 of 123 participants (23.6%) at 12 weeks reported clear improvement. Subjective improvement (PGI-I) did not differ between men with either objective agreement (χ2 = 0.218, p = 0.813) or subjective agreement (χ2 = 0.038, p = 1.000). Post-hoc analysis gave the same results when including only participants with no treatment change (objective agreement: χ2 = 0.002, p = 1.000; subjective agreement: χ2 = 0.022, p = 1.000). The IPSS decreased on average by −3.41 ± 5.53 points after 6 weeks and −4.34 ± 5.99 points after 12 weeks. At 6 weeks, the delta-IPSS was significantly higher when expectations were objectively met (mean decrease, −5.0 ± 5.8 points) than when they were not objectively met (mean decrease, −2.8 ± 5.3 points; t = 2.202, p = 0.029). For the subjective agreement categories, no significant difference was found between the agreement and non-agreement groups (−2.9 ± 5.5 vs −4.4 ± 5.6; t = −1.596, p = 0.113). At 12 weeks there was also no difference in delta-IPSS between the agreement and non-agreement groups for either objective or subjective agreement. This did not change with the post-hoc analysis for participants without a change in treatment.
Patient Satisfaction
At 6 weeks, most men were satisfied (56.4%) or very satisfied (21.8%) with the care received from the urologist. It was notable that objectively meeting or not meeting patient expectations did not affect patient satisfaction (odds ratio [OR] 2.28, 95% CI 0.74–7.05). By contrast, subjective fulfilment was associated with significantly greater satisfaction with a urologist’s care than when subjective fulfilment was lacking (OR 35.63, 95% CI 11.91–106.62).
At 12 weeks, most men (71.5%) remained satisfied with the care of their urologist. Again, objectively meeting or not meeting expectations did not affect satisfaction (OR 0.50, 95% CI 0.20–1.28), whereas subjective fulfilment still led to increased satisfaction (OR 4.81, 95% CI 2.01–11.49). Post-hoc analysis of patients with no treatment change at 12 weeks yielded a positive, but statistically non-significant, association for subjective fulfilment only (OR 2.92 95% CI 0.97–8.80) (Table 4). Change in the IPSS was significantly associated with satisfaction (OR 0.92, 95% CI 0.84–1.00).
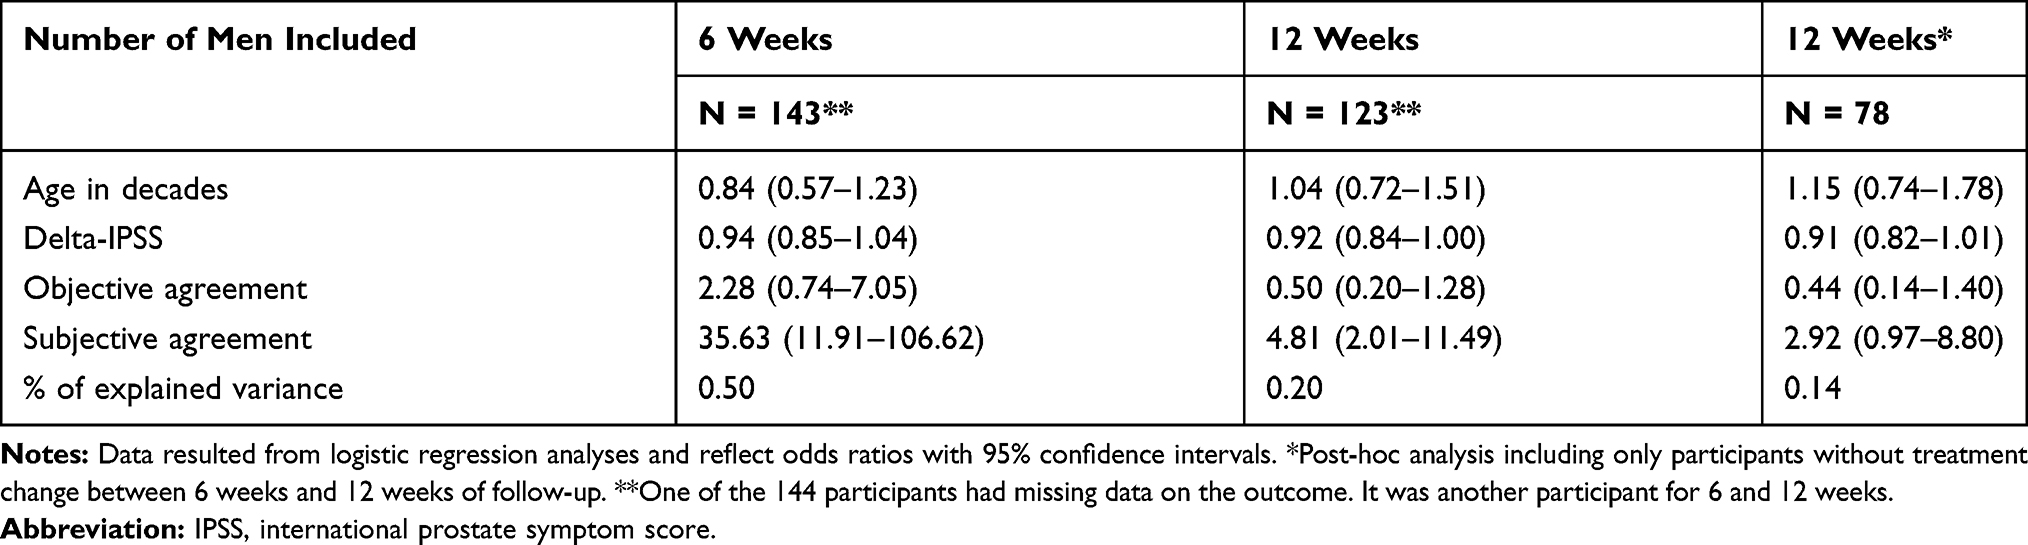 |
Table 4 Associations of Treatment Satisfaction with Age, Change in Symptom Severity, Objective Agreement and Subjective Agreement |
Discussion
We primarily aimed to identify the expectations of men with LUTS who were referred to a urologist. This is a diverse patient group consisting of men with LUTS due to different causes, such as benign prostate enlargement, or overactive bladder. Most patients expected a urologist to perform examinations, to provide an explanation and to find the underlying cause of their symptoms. They also expected to be involved in treatment choices, mainly for drug therapy, and not for physiotherapy. Higher expectations for treatment outcomes resulted in higher expectations when receiving the treatment. Furthermore, a higher symptom severity score was associated with higher expectations for medication or surgery. Finally, we showed that men who reported that their expectations were fulfilled were more likely to be satisfied with the care given by the urologist. This satisfaction was not affected by objective agreement between the expected and actual treatments. By contrast, subjective agreement led to higher satisfaction.
The existing guideline on male LUTS for Dutch GPs only briefly mentions the possible reasons for referring men with LUTS.2 Limited communication with patients before referral may have led to the high percentage of patients with neutral expectations for each treatment option in this study. Lack of information from the hospital may also result in non-specific expectations before the first outpatient department visit. GPs and urologists need to make arrangements on how to inform patients about what they can expect from a referral.
We encountered a large discrepancy between the fulfilment of expectations in the objective and subjective assessments. Most patients who reported that the treatment they received satisfied their expectations did not expect that treatment. This might reflect that patients could not remember what they expected 6 weeks ago. In the group with neutral expectations, one might anticipate this result given that baseline expectations were equivocal. It could also be that patients considered not only the received treatment but also the consultation experience with the urologist. This may explain why patients who reported subjective fulfilment were more satisfied with the care given by the urologist than patients who reported objective fulfilment.
We could find no other studies concerning patient expectations before referral to urology services. By contrast, research in orthopedics services has already established that patient satisfaction is higher when expectations are fulfilled.9,16–18 However, these studies looked at the fulfilment of preoperative expectations on postoperative outcomes. We showed that patients are also more satisfied with care when they think that they received the treatment they expected. This supports the position that clinicians should consider patient preferences and act to achieve those whenever possible and appropriate.
Other studies have shown that greater expectations of a given treatment result in better patient-reported outcomes. For example, Flood et al showed that patients undergoing transurethral resection of the prostate who had positive expectations preoperatively reported greater improvement.19 In addition, Jain et al found that higher preoperative expectations in patients undergoing total knee arthroplasty predicted greater improvements in patient-reported outcomes.9 Consistent with these results, we also showed that treatment outcomes were better when patients receive the treatments they expect. Interestingly, however, treatment outcomes were poorer when patients self-reported that a treatment met their expectations.
A limitation of this study was the use of a non-validated questionnaire to assess patient expectations, which exemplifies an underlying issue that most validated questionnaires only detail patient-reported outcomes and not their expectations. The sample size was also small, especially in some of the subgroup analyses, which resulted in wide confidence intervals and several outcomes that should be interpreted with caution. Still, despite this issue, the percentage of explained variance for most analyses was considerable, showing that most of the relevant characteristics will have been considered.
We conclude that it is important for both GPs and urology outpatient departments to provide better information to men with LUTS, thereby granting patients the opportunity to consider different treatment options and to have better informed expectations. This may result in higher levels of satisfaction with the care given by urologists.
Informed Consent
All participants signed a written informed consent.
Research Involving Human Participants and/or Animals
The requirements of the Medical Research Involving Human Subjects Act (WMO, Dutch Law) did not apply to this study, meaning that ethical approval was not needed (in Dutch: “NIET WMO-plichtige studie”, or “Verklaring geen bezwaar”.). This was confirmed by the medical ethics committee of Isala (number 170,319, March 20th 2017 and October 3rd 2017). This study was performed in accordance with the principles stated in the Declaration of Helsinki. All participants provided written informed consent. The requirements of the Medical Research Involving Human Subjects Act (WMO) did not apply to this study, as confirmed by our institution’s medical ethics review board.
Acknowledgments
This study was conducted with an unrestricted grant from the University Medical Centre Groningen, healthy ageing pilots (number CDO16.0008/282). We thank Dr Robert Sykes for providing editorial services. The abstract of this paper was presented at the 2018 Annual meeting of the International Continence Society as a poster presentation. The poster’s abstract has not been published in any journal.
Author Contributions
Pim Brandenbarg: Execution of the study, especially acquisition of data, analysis and interpretation; drafting of the manuscript; agreed on the journal to which the manuscript has been submitted; reviewed and agreed all versions of the manuscript; agreed to take responsibility and be accountable for the contents of the article. Puk Rooijers: Execution of the study, especially acquisition of data, analysis and interpretation; drafting of the manuscript; agreed on the journal to which the manuscript has been submitted; reviewed and agreed all versions of the manuscript; agreed to take responsibility and be accountable for the contents of the article. Martijn Steffens: Conception of the study, study design, interpretation; critically reviewed the article; agreed on the journal to which the manuscript has been submitted; reviewed and agreed all versions of the manuscript; agreed to take responsibility and be accountable for the contents of the article. Michael van Balken: Data acquisition, interpretation; critically reviewed the article; agreed on the journal to which the manuscript has been submitted; reviewed and agreed all versions of the manuscript; agreed to take responsibility and be accountable for the contents of the article. Henk-Jan Mulder: Data acquisition, interpretation; critically reviewed the article; agreed on the journal to which the manuscript has been submitted; reviewed and agreed all versions of the manuscript; agreed to take responsibility and be accountable for the contents of the article. Marco Blanker: Conception of study, study design, analysis and interpretation; writing of the article; agreed on the journal to which the manuscript has been submitted; reviewed and agreed all versions of the manuscript; agreed to take responsibility and be accountable for the contents of the article.
Disclosure
All authors declare that they have no conflicts of interest.
References
1. Wolters R, Wensing M, van Weel C, van der Wilt GJ, Grol RP. Lower urinary tract symptoms: social influence is more important than symptoms in seeking medical care. BJU Int. 2002;90:655–661. doi:10.1046/j.1464-410X.2002.02996.x
2. Blanker MH, Klomp MA, van den Donk M, van der Heide WK, Opstelten W, Burgers JS. Summary of the NHG practice guideline ‘Lower urinary tract symptoms in men’. Ned Tijdschr Geneeskd. 2013;157:A6178.
3. National Clinical Guideline Centre (NICE). Lower urinary tract symptoms in men: management (Clinical guideline CG97). 2015:CG97
4. Jones C, Hill J, Chapple C; Guideline Development Group. Management of lower urinary tract symptoms in men: summary of NICE guidance. BMJ. 2010;340:c2354. doi:10.1136/bmj.c2354
5. Gratzke C, Bachmann A, Descazeaud A, et al. EAU guidelines on the assessment of non-neurogenic male lower urinary tract symptoms including benign prostatic obstruction. Eur Urol. 2015;67:1099–1109. doi:10.1016/j.eururo.2014.12.038
6. McVary KT, Roehrborn CG, Avins AL, et al. Update on AUA guideline on the management of benign prostatic hyperplasia. J Urol. 2011;185:1793–1803. doi:10.1016/j.juro.2011.01.074
7. Ross CK, Frommelt G, Hazelwood L, Chang RW. The role of expectations in patient satisfaction with medical care. J Health Care Mark. 1987;7:16–26.
8. Cormier S, Lavigne GL, Choiniere M, Rainville P. Expectations predict chronic pain treatment outcomes. Pain. 2016;157:329–338. doi:10.1097/j.pain.0000000000000379
9. Jain D, Nguyen LL, Bendich I, et al. Higher patient expectations predict higher patient-reported outcomes, but not satisfaction, in total knee arthroplasty patients: a prospective multicenter study. J Arthroplasty. 2017;32:S166–70. doi:10.1016/j.arth.2017.01.008
10. Lurie JD, Berven SH, Gibson-Chambers J, et al. Patient preferences and expectations for care: determinants in patients with lumbar intervertebral disc herniation. Spine (Phila Pa 1976). 2008;33:2663–2668. doi:10.1097/BRS.0b013e31818cb0db
11. McGregor AH, Hughes SP. The evaluation of the surgical management of nerve root compression in patients with low back pain: part 2: patient expectations and satisfaction. Spine (Phila Pa 1976). 2002;27:
12. Blanker MH, Admiraal A, Brandenbarg P, et al. Effectiveness of a newly developed online self‐management program for male patients with lower urinary tract symptoms. Neurourol Urodyn. 2019;38(8):2273–2279. doi:10.1002/nau.24131
13. Barry MJ, Fowler Jr FJ, O’Leary MP, et al. The American Urological Association symptom index for benign prostatic hyperplasia. The Measurement Committee of the American Urological Association. J Urol. 1992;148:
14. Coyne K, Revicki D, Hunt T, et al. Psychometric validation of an overactive bladder symptom and health-related quality of life questionnaire: the OAB-q. Qual Life Res. 2002;11:563–574. doi:10.1023/A:1016370925601
15. Viktrup L, Hayes RP, Wang P, Shen W. Construct validation of patient global impression of severity (PGI-S) and improvement (PGI-I) questionnaires in the treatment of men with lower urinary tract symptoms secondary to benign prostatic hyperplasia. BMC Urol. 2012;12:30. doi:10.1186/1471-2490-12-30
16. Culliton SE, Bryant DM, Overend TJ, MacDonald SJ, Chesworth BM. The relationship between expectations and satisfaction in patients undergoing primary total knee arthroplasty. J Arthroplasty. 2012;27:490–492. doi:10.1016/j.arth.2011.10.005
17. Hamilton DF, Lane JV, Gaston P, et al. What determines patient satisfaction with surgery? A prospective cohort study of 4709 patients following total joint replacement. BMJ Open. 2013;3:e002525. doi:10.1136/bmjopen,2012-002525
18. Noble PC, Conditt MA, Cook KF, Mathis KB. The John Insall Award: patient expectations affect satisfaction with total knee arthroplasty. Clin Orthop Relat Res. 2006;452:35–43. doi:10.1097/01.blo.0000238825.63648.1e
19. Flood AB, Lorence DP, Ding J, McPherson K, Black NA. The role of expectations in patients’ reports of post-operative outcomes and improvement following therapy. Med Care. 1993;31:1043–1056. doi:10.1097/00005650-199311000-00006
 © 2020 The Author(s). This work is published and licensed by Dove Medical Press Limited. The
full terms of this license are available at https://www.dovepress.com/terms
and incorporate the Creative Commons Attribution
- Non Commercial (unported, 3.0) License.
By accessing the work you hereby accept the Terms. Non-commercial uses of the work are permitted
without any further permission from Dove Medical Press Limited, provided the work is properly
attributed. For permission for commercial use of this work, please see paragraphs 4.2 and 5 of our Terms.
© 2020 The Author(s). This work is published and licensed by Dove Medical Press Limited. The
full terms of this license are available at https://www.dovepress.com/terms
and incorporate the Creative Commons Attribution
- Non Commercial (unported, 3.0) License.
By accessing the work you hereby accept the Terms. Non-commercial uses of the work are permitted
without any further permission from Dove Medical Press Limited, provided the work is properly
attributed. For permission for commercial use of this work, please see paragraphs 4.2 and 5 of our Terms.