Back to Journals » Diabetes, Metabolic Syndrome and Obesity » Volume 11
Weight outcome after 2 years of a diet that excludes six processed foods: exploratory study of the “1,2,3 diet” in a moderately obese population
Authors Courie R, Gaillard M, Lainas P, Hansel B, Naveau S, Dagher I, Tranchart H
Received 14 February 2018
Accepted for publication 13 April 2018
Published 12 July 2018 Volume 2018:11 Pages 345—355
DOI https://doi.org/10.2147/DMSO.S165598
Checked for plagiarism Yes
Review by Single anonymous peer review
Peer reviewer comments 2
Editor who approved publication: Professor Ming-Hui Zou
Rodi Courie,1 Martin Gaillard,2,3 Panagiotis Lainas,2,3 Boris Hansel,1 Sylvie Naveau,1,3 Ibrahim Dagher,2,3 Hadrien Tranchart2,3
1Department of Hepato-Gastroenterology and Nutrition, Antoine Béclère Hospital (AP-HP), Clamart, France; 2Department of Digestive Minimally Invasive Surgery, Antoine Béclère Hospital (AP-HP), Clamart, France; 3Paris-Saclay University, INSERM U1193, Orsay, France
Background: The Paleolithic diet, a diet devoid of food-processing procedure, seems to produce a greater decrease in weight compared to healthy reference diets but its limited food choices make it difficult to implement in our modern times where refined food is dominant.
Objective: To evaluate the effects of a 2-year diet that excludes only six refined foodstuffs implicated in obesity. Professional contact was kept minimal to approximate the approach used by most dieters.
Design: Single-arm, open-label, exploratory study.
Setting: One academic medical center, outpatient setting.
Patients: One hundred and five subjects with a mean age of 50 (SD, 14 years) and mean body mass index of 30.5 kg/m² (SD, 4 kg/m²). Thirty-nine percent had type 2 diabetes.
Intervention: An ad libitum diet that excludes six refined foodstuffs (margarine, vegetable oils, butter, cream, processed meat, and sugary drinks) called the “1,2,3 diet”.
Outcomes: Weight at 2 years was the primary outcome. Secondary outcomes included number of patients who lost more than 5% of initial body weight, glycated hemoglobin (HbA1c) level, and changes in dietary behavior.
Results: Average weight loss was 4.8 kg (p<0.001), representing 5.6% of their initial body weight. Among completers (51%), the average weight loss was 5.5 kg (p<0.001), and 56% had a reduction of at least 5% of their initial body weight. Among diabetics, weight loss was similar to nondiabetics, and mean HbA1c level decreased by 1% (p=0.001) without modification in glucose-lowering medications. A higher intake of bread, dairy products, chocolate, and fresh fruits was the typical trend in dietary changes reported by completers.
Conclusion: In this exploratory study, there was a significant long-term weight loss with the “1,2,3 diet” despite minimal professional contact. Given the lack of a control group and high attrition rate, further evaluation of this diet is warranted.
Keywords: traditional diet, obesity, type 2 diabetes, refined food, satiety, leptin sensitivity
Introduction
High-fat or high-carbohydrate foods in societies where the western diet (WD) has prevailed seem to be among the primary driving forces behind the obesity epidemic.1
WD is characterized by a consumption of highly palatable refined sugars and fats. Modern food transformation allowed for unprecedented levels of nutrient combinations and densities,4 and the body of evidence supporting mechanisms by which such food produces obesity is constantly growing.5,6 By contrast, the diets of our Paleolithic ancestors (2.6 million to ∼10,000 years ago), before the advent of modern agriculture, differed considerably from current standards and obesity remains virtually absent among populations who retain an ancestral nutrition.2
The “Paleolithic” diet is a modern dietary regimen that attempts to approximate the characteristics of such ancestral food. It primarily advocates the intake of lean meat, eggs, seafood, fruits, vegetables (including potatoes and other tubers) and nuts, and excludes cereal grains, dairy products, as well as all types of refined sugars or fats typically found in a WD.7 Short-term randomized studies have suggested beneficial effects of a Paleolithic diet on weight, waist circumference, and metabolic balance, including insulin sensitivity, when administered ad libitum versus other types of healthy reference diets.3,8–10 But a key finding is that weight loss was due to a spontaneous 20%–30% decrease in caloric intake11,12 that would be consistent with a better activation of satiety signals.5,13 If this dietary pattern seems attractive, its feasibility on the long-term is questionable because Paleolithic dieters report difficulty adhering to the diet in a real-life setting.12 This is in line with a 2015 US news survey ranking 35 diets with input from a panel of health experts, which placed the Paleolithic diet dead last, citing a great option but difficult to duplicate in modern times.14 Potential explanation to the unsustainably of Paleolithic nutrition includes the radical departure from the observed industrial food choices of the average consumer.15,16 Taken together, data suggest that a diet devoid of significant food-processing procedure could be more satiating and produces a greater weight loss than guideline-based diets but is virtually impossible to implement in our modern times where refined food is dominant in the global food system.16
As a result, we hypothesized that by excluding six of the most frequently reported refined foodstuffs associated with obesity in human and animal studies (margarine,17,18 vegetable oils,18,19 butter,17,20 cream,21,22 processed meat,20 and sugary drinks23), it was possible to overcome the limited food choices of the Paleolithic diet and induce a spontaneous decrease in food intake resulting in subsequent long-term weight loss.
We, therefore, implemented a nonrestricted calorie diet that fully excluded these six foodstuffs, named the “1,2,3” diet. Professional contact was kept minimal to approximate the approach used by most dieters.24 The aim of this one-arm exploratory study was to assess the effect of such diet on long-term body-weight change in an overweight and obese population. The clinical trial protocol registration number is ISRCTN49630431.
Methods
Design
We performed a one-arm, open-label study conducted over 2 years with outcome assessment at baseline, 6, 12, and 24 months. It was estimated that a sample size of 60 would give the study 90% power at the 5% significance level to detect a difference of 2.6 kg between baseline and 2 years. Based on an anticipated 40% dropout rate, we aimed to recruit at least 100 participants.
Setting
Recruitment and data collection were completed at the Gastroenterology/Nutrition Department, Hospital Antoine Beclère, Clamart, France.
Participants
Consecutive overweight and obese patients who presented to the outpatient consultation with a chief complaint related to their excess weight were recruited for the study. Participants completed a comprehensive medical examination and routine blood tests. Participants were eligible if they were older than 18 years and had a body mass index ≥25 kg/m2. Criteria for exclusion were pregnancy, recent modifications to the usual diet, or recent serious hypoglycemic events for diabetics. The study was conducted from February 2011 to December 2015. The study protocol was reviewed and approved by the Hospital Antoine-Belcère human subject’s committee and was conducted according to the guidelines laid down in the Declaration of Helsinki. Participants gave written informed consent.
Intervention: the 1,2,3 diet
The purpose of the “1,2,3 diet” is to help restore early satiety among overweight western dieters by excluding processed food. However, in order to avoid large departure from available food choices of the average western dieter, participants were asked to fully exclude only six of the most frequently reported processed foodstuffs associated with weight gain: vegetable oils, margarine, butter, cream, processed meat, and sugary drinks. All other foods were allowed and could be consumed freely until satiety. The diet prescription handed to patients is described in more detail in Figure 1. A practical example on how to implement the diet was given to each patient based on his 3-day food record performed at baseline. To approximate the approach used by most dieters in a real-life setting,24 we intentionally implemented a low-intensity intervention: Patients were encouraged to come back for a first visit 1 month after the onset of the diet and every 2–3 months thereafter. However, patients were free to consult more often if needed. There were no electronically delivered counseling between visits, and no specific advice was given regarding meal frequency or physical activity. The consultation did not last >60 minutes.
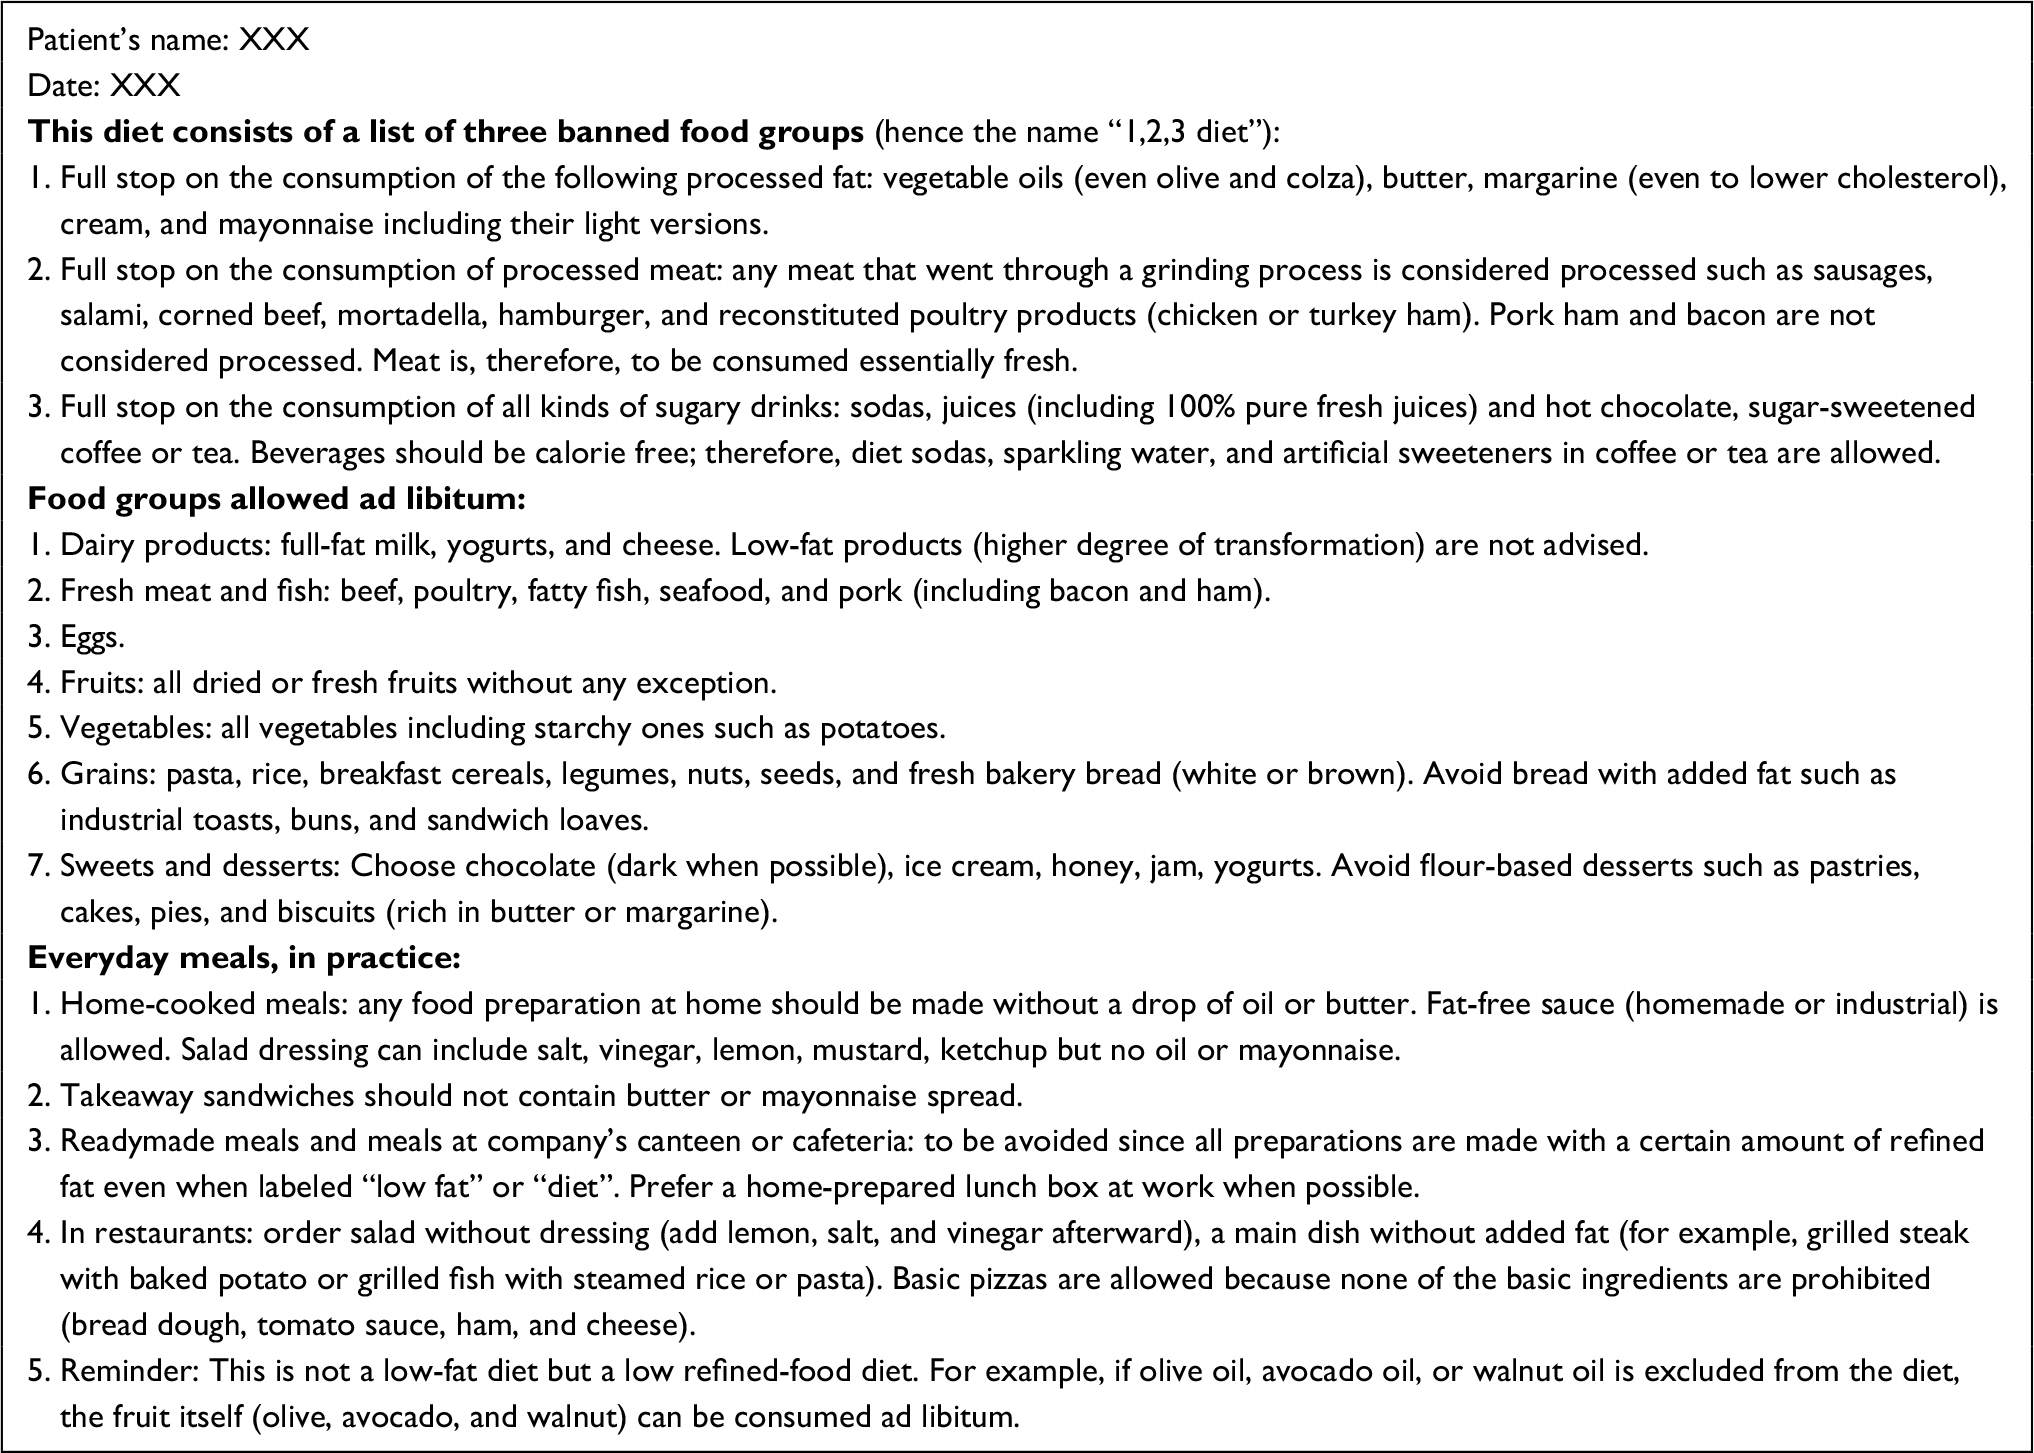 | Figure 1 The prescription of the “1,2,3 diet” handed to the patient. |
Outcomes and measurements
Weight
Body weight was measured at baseline and at each visit (while patients wore light clothing and no shoes) to the nearest 0.5 kg on the same scale calibrated daily. Height was measured by a stadiometer at baseline. The primary outcome was weight at 2 years.
Glycated hemoglobin (HbA1c)
Participants who presented with type 2 diabetes mellitus (T2DM) were followed elsewhere for diabetes. Therapeutic regimens were individualized at the discretion of their doctors throughout the study. Medications used (alone or in combination) for glycemic control were metformin, glucagon-like peptide-1 analog (GLP-1), dipeptidyl peptidase 4 inhibitor, and sulfonylureas. HbA1c level was analyzed in our hospital’s laboratory (high-performance liquid chromatography method) at baseline and at 6, 12, 18, and 24 months. Exposure to glucose-lowering therapy, including insulin, was assessed at baseline and every 6 months thereafter as well.
Changes in dietary behavior
A 3-day food record (2 week days and 1 weekend day) was completed by the participants before initiating the diet (baseline), at each subsequent visit and at 2 years. Subjects were instructed to estimate the amount of food eaten by using colored food-portion photographs representing known weights and household measuring utensils (e.g., cup, spoon, grams). The food record was reviewed and completed in detail with the help of a study dietician. We assessed overall changes in dietary behavior by comparing the diet composition at baseline and at 2 years.
Statistics
The primary outcome was the change in weight over a period of 2 years and the secondary outcome was the number of patients who lost >5% of their initial weight. We used the intention-to-treat principle and analyzed all the participants who were assigned to the diet. For the primary analysis, missing weight was handled using the last observation carried forward. Analysis has been also performed on the participants who completed the study. All other analyses were performed on participants who provided measurements at the concerning time point. The evolution of weight and HbA1c at 2 years has been analyzed using the signed rank test. The Clopper–Pearson method was used to calculate the 95% CI of proportion. The Wilcoxon test was used to compare the change in weight between subgroups. Quantitative data were expressed as mean (SD) and qualitative data as number and percentages (percentages were calculated excluding missing data). All tests were two-sided with α risk at 5%. Statistical analyses were performed using SAS version 9.4 (SAS Institute Inc., Cary, NC, USA).
Results
Participants
Of the 107 patients recruited, two were excluded because they were already dieting. A total of 105 adults (74 women and 31 men) with a mean age of 50 years (SD, 14 years) and a mean BMI of 31 kg/m2 (SD, 4 kg/m2) followed the “1,2,3 diet”. Most participants were white (55%), 34% were African, and 11% were Asian. Forty percent had T2DM with a mean HbA1c of 8.3% (SD, 2%), most (86%) were on average treated with 1.9 (SD, 1.2) oral antidiabetic drugs and 17% were on insulin. Fifty-four participants (51%) completed the study (i.e., provided measurements at 2 years; Figure 2). Baseline characteristics were similar among all participants and completers (Table 1).
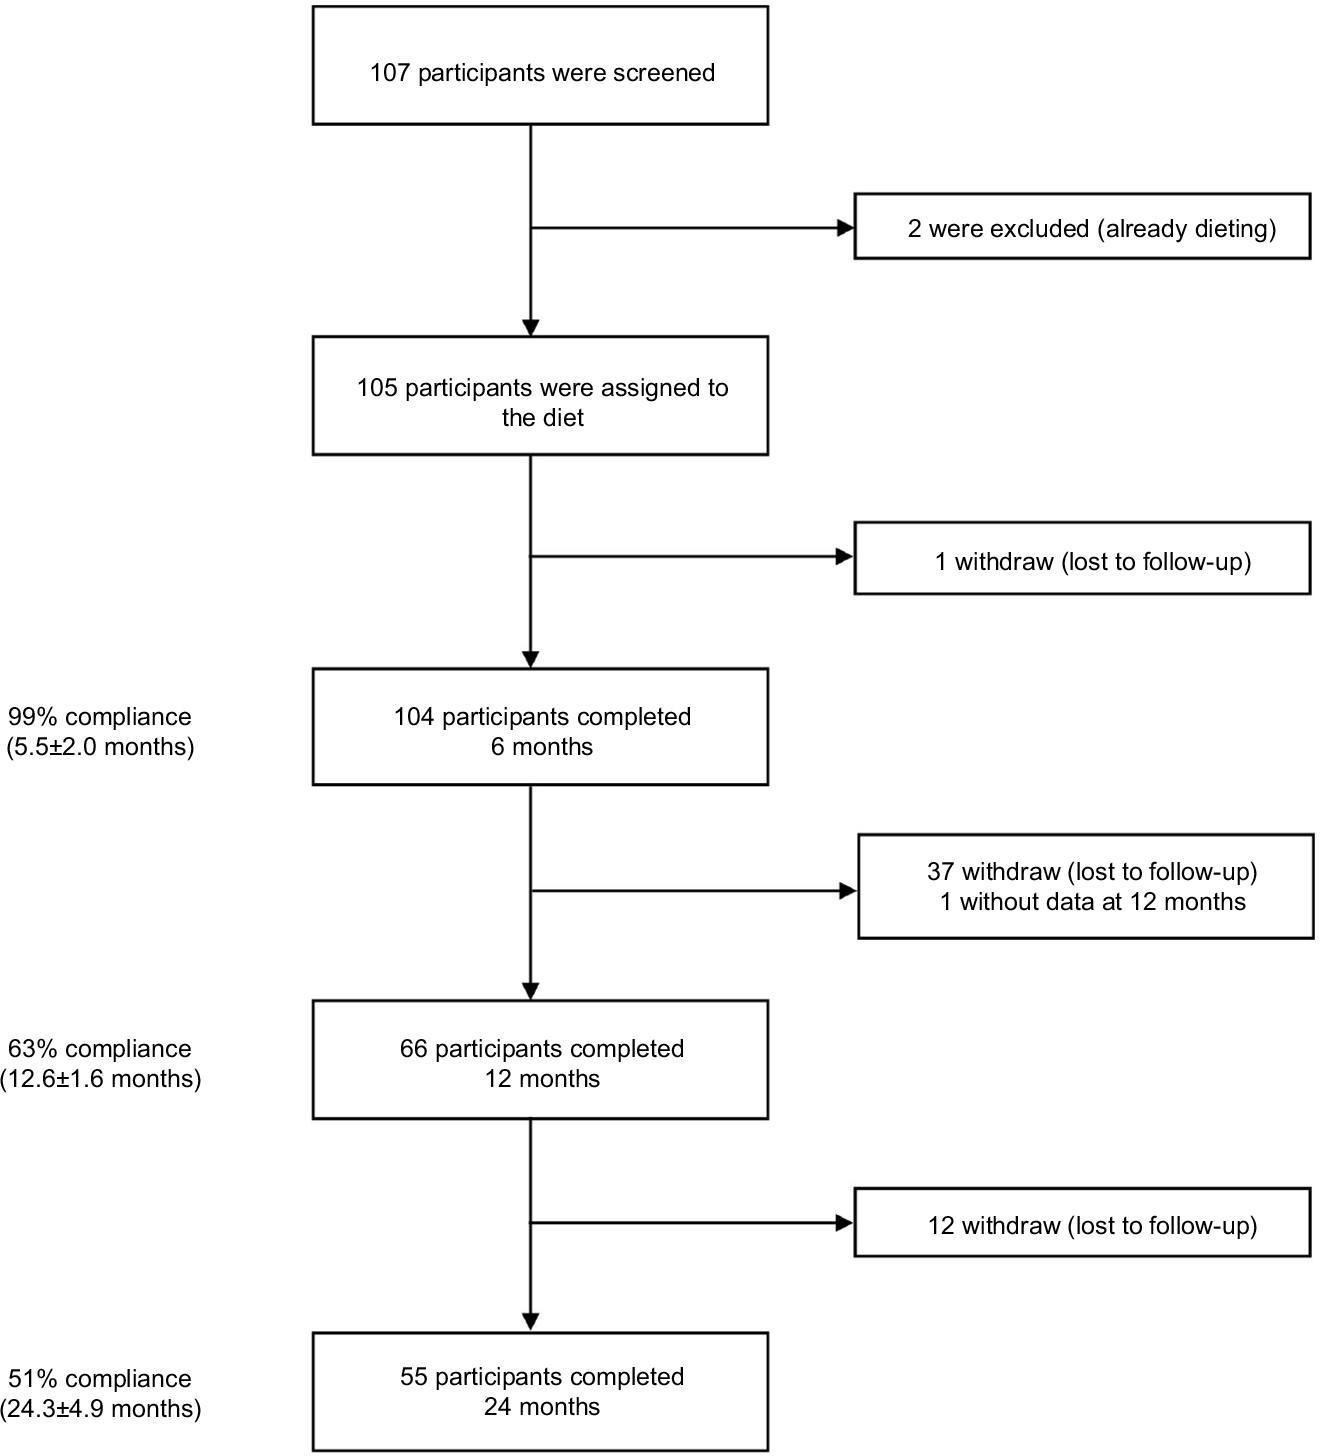 | Figure 2 Patient inclusion flowchart. |
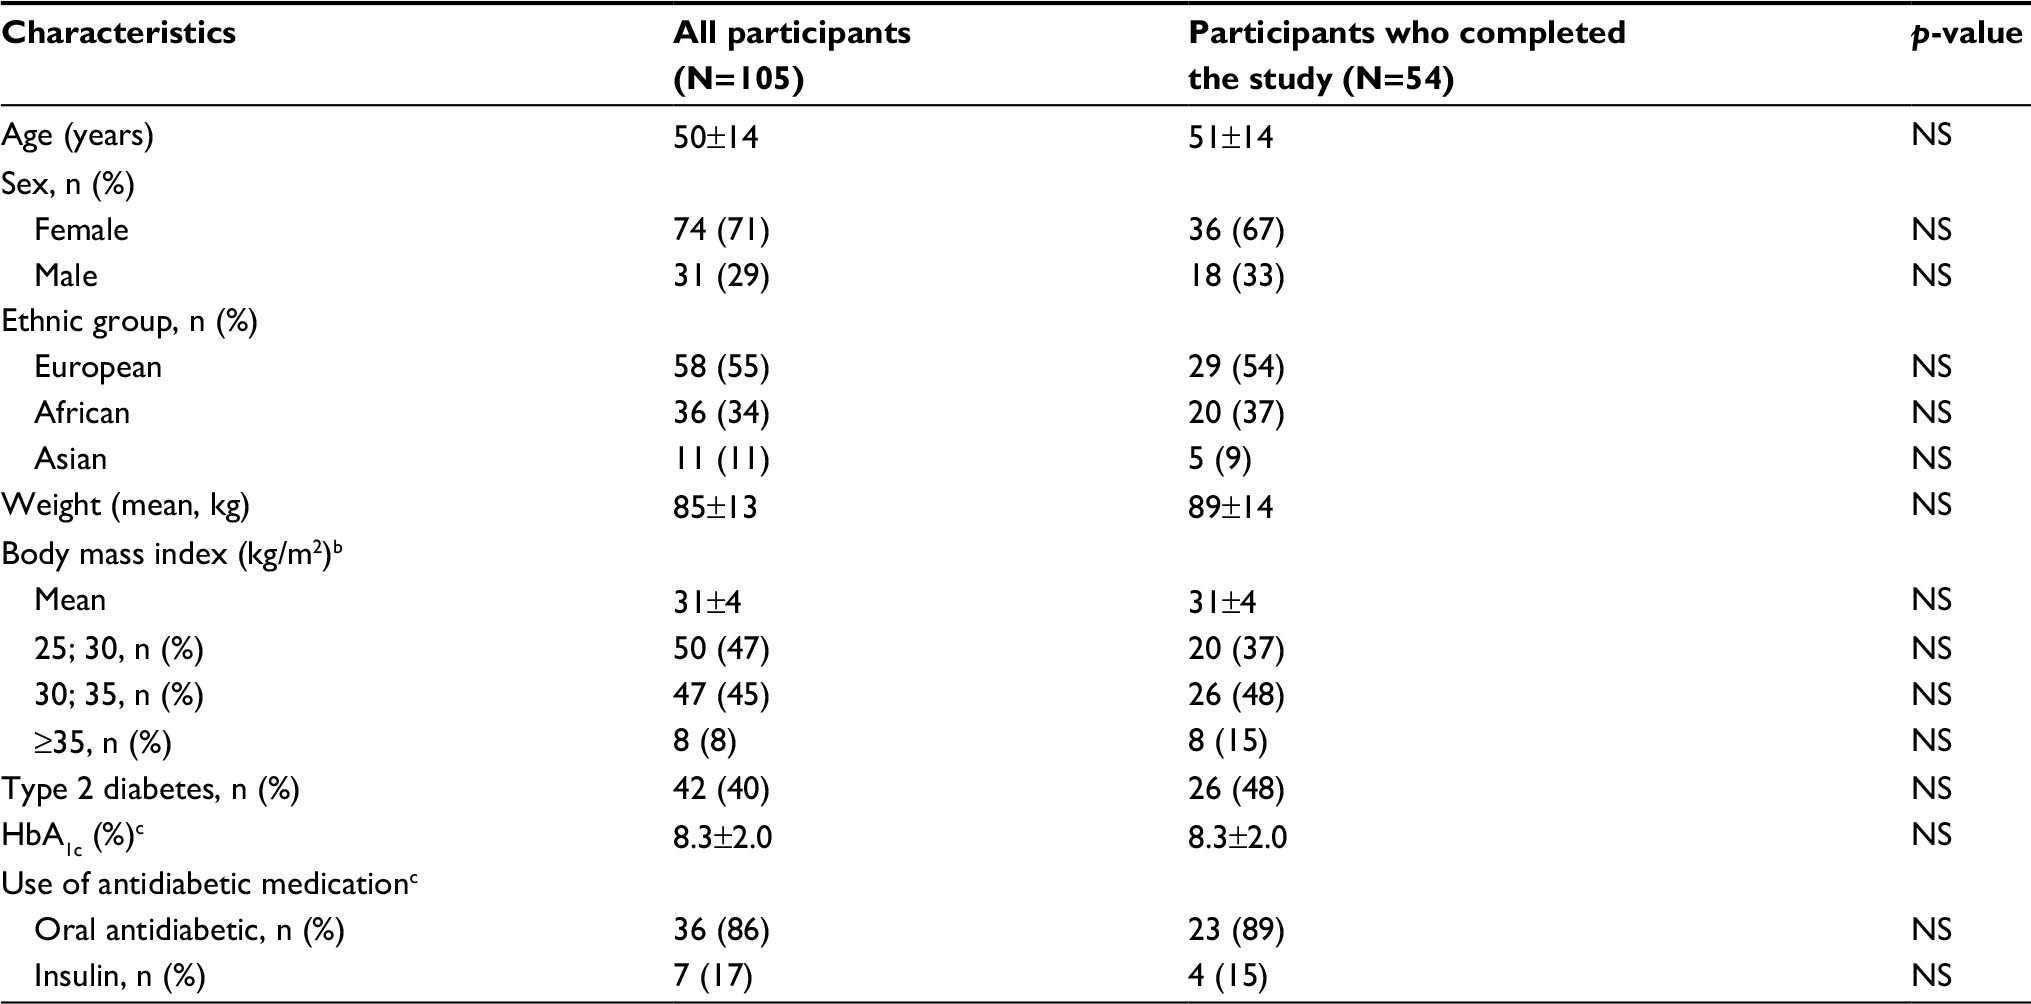 | Table 1 Baseline characteristics of the study participantsa Notes: aData presented as n (%) or mean ± SD. bThe body mass index is the weight in kilograms divided by the square of the height in meters. cData are for the participants with type 2 diabetes. Abbreviations: NS, nonsignificant; HbA1c, glycated hemoglobin. |
Body weight
The mean weight loss from baseline to 2 years was 4.8±5.0 kg (p<0.001), which represented 5.6% of initial weight. Among completers mean weight loss was 5.5±5.8 kg (p<0.001) or 6.2% of initial body weight (Figure 3). At 2 years, 56% (95% CI, 41–69) of the completers had lost >5% of their initial weight and 22% (95% CI, 12–36) had lost at least 10% of their initial weight. In subgroup analysis, the statistically significant decrease in weight was observed similarly in obese and overweight patients (Figure 4A) and in patients with or without T2DM (Figure 4B). A multivariate analysis (adjusted for age, sex, BMI, and diabetes) was performed, but no independent predictive factor on weight loss was identified.
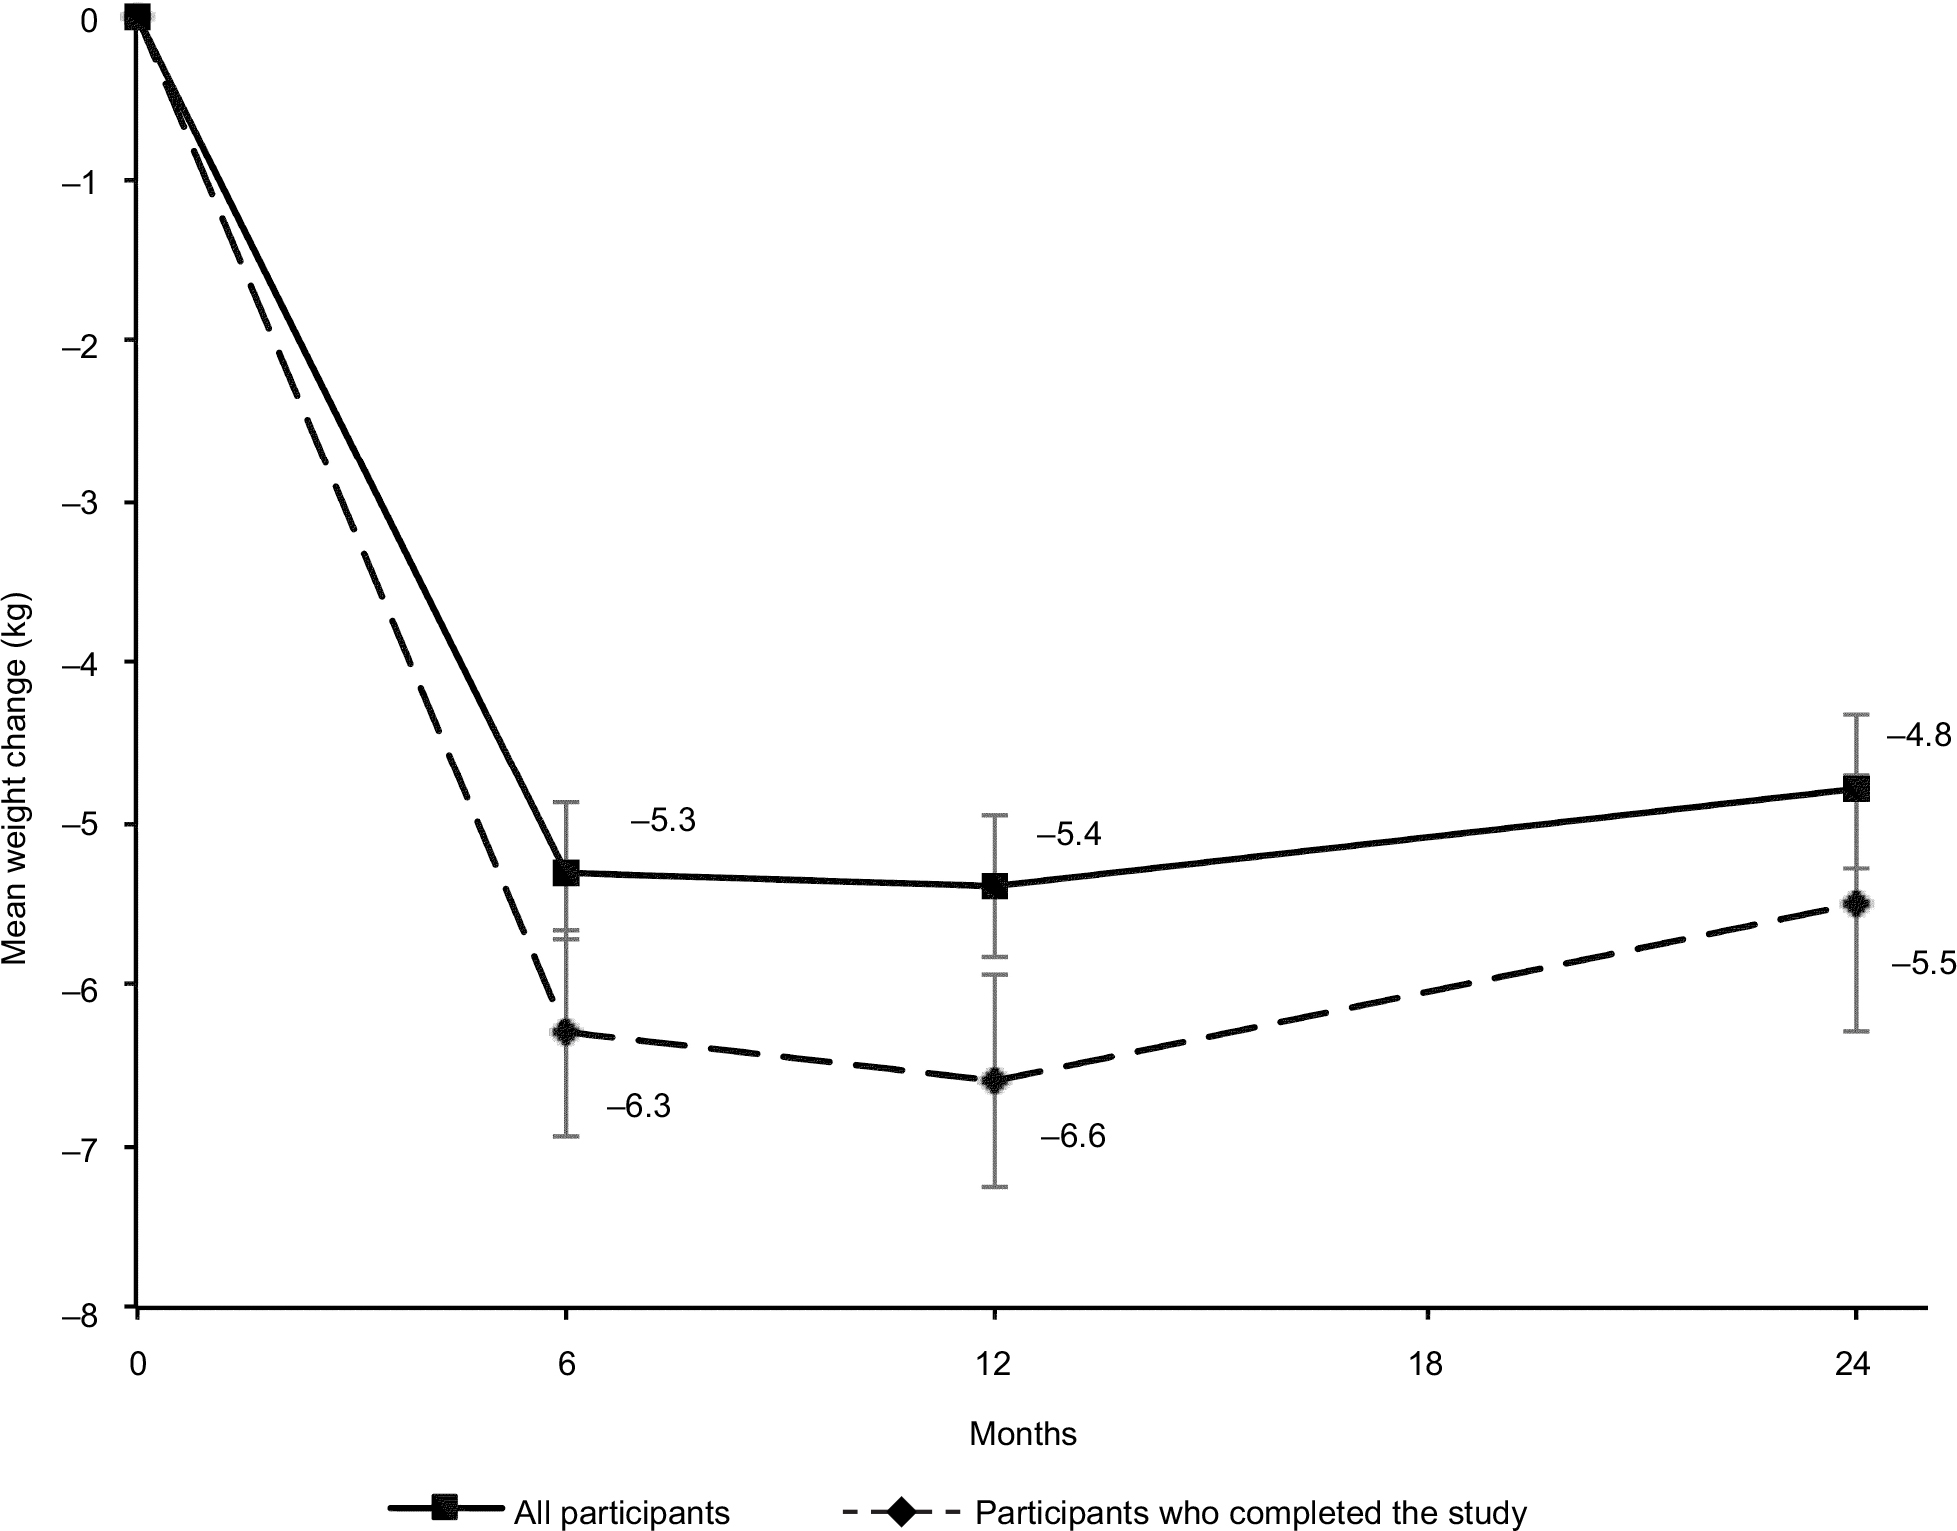 | Figure 3 Weight changes over 2 years. Note: Vertical bars indicate standard errors. |
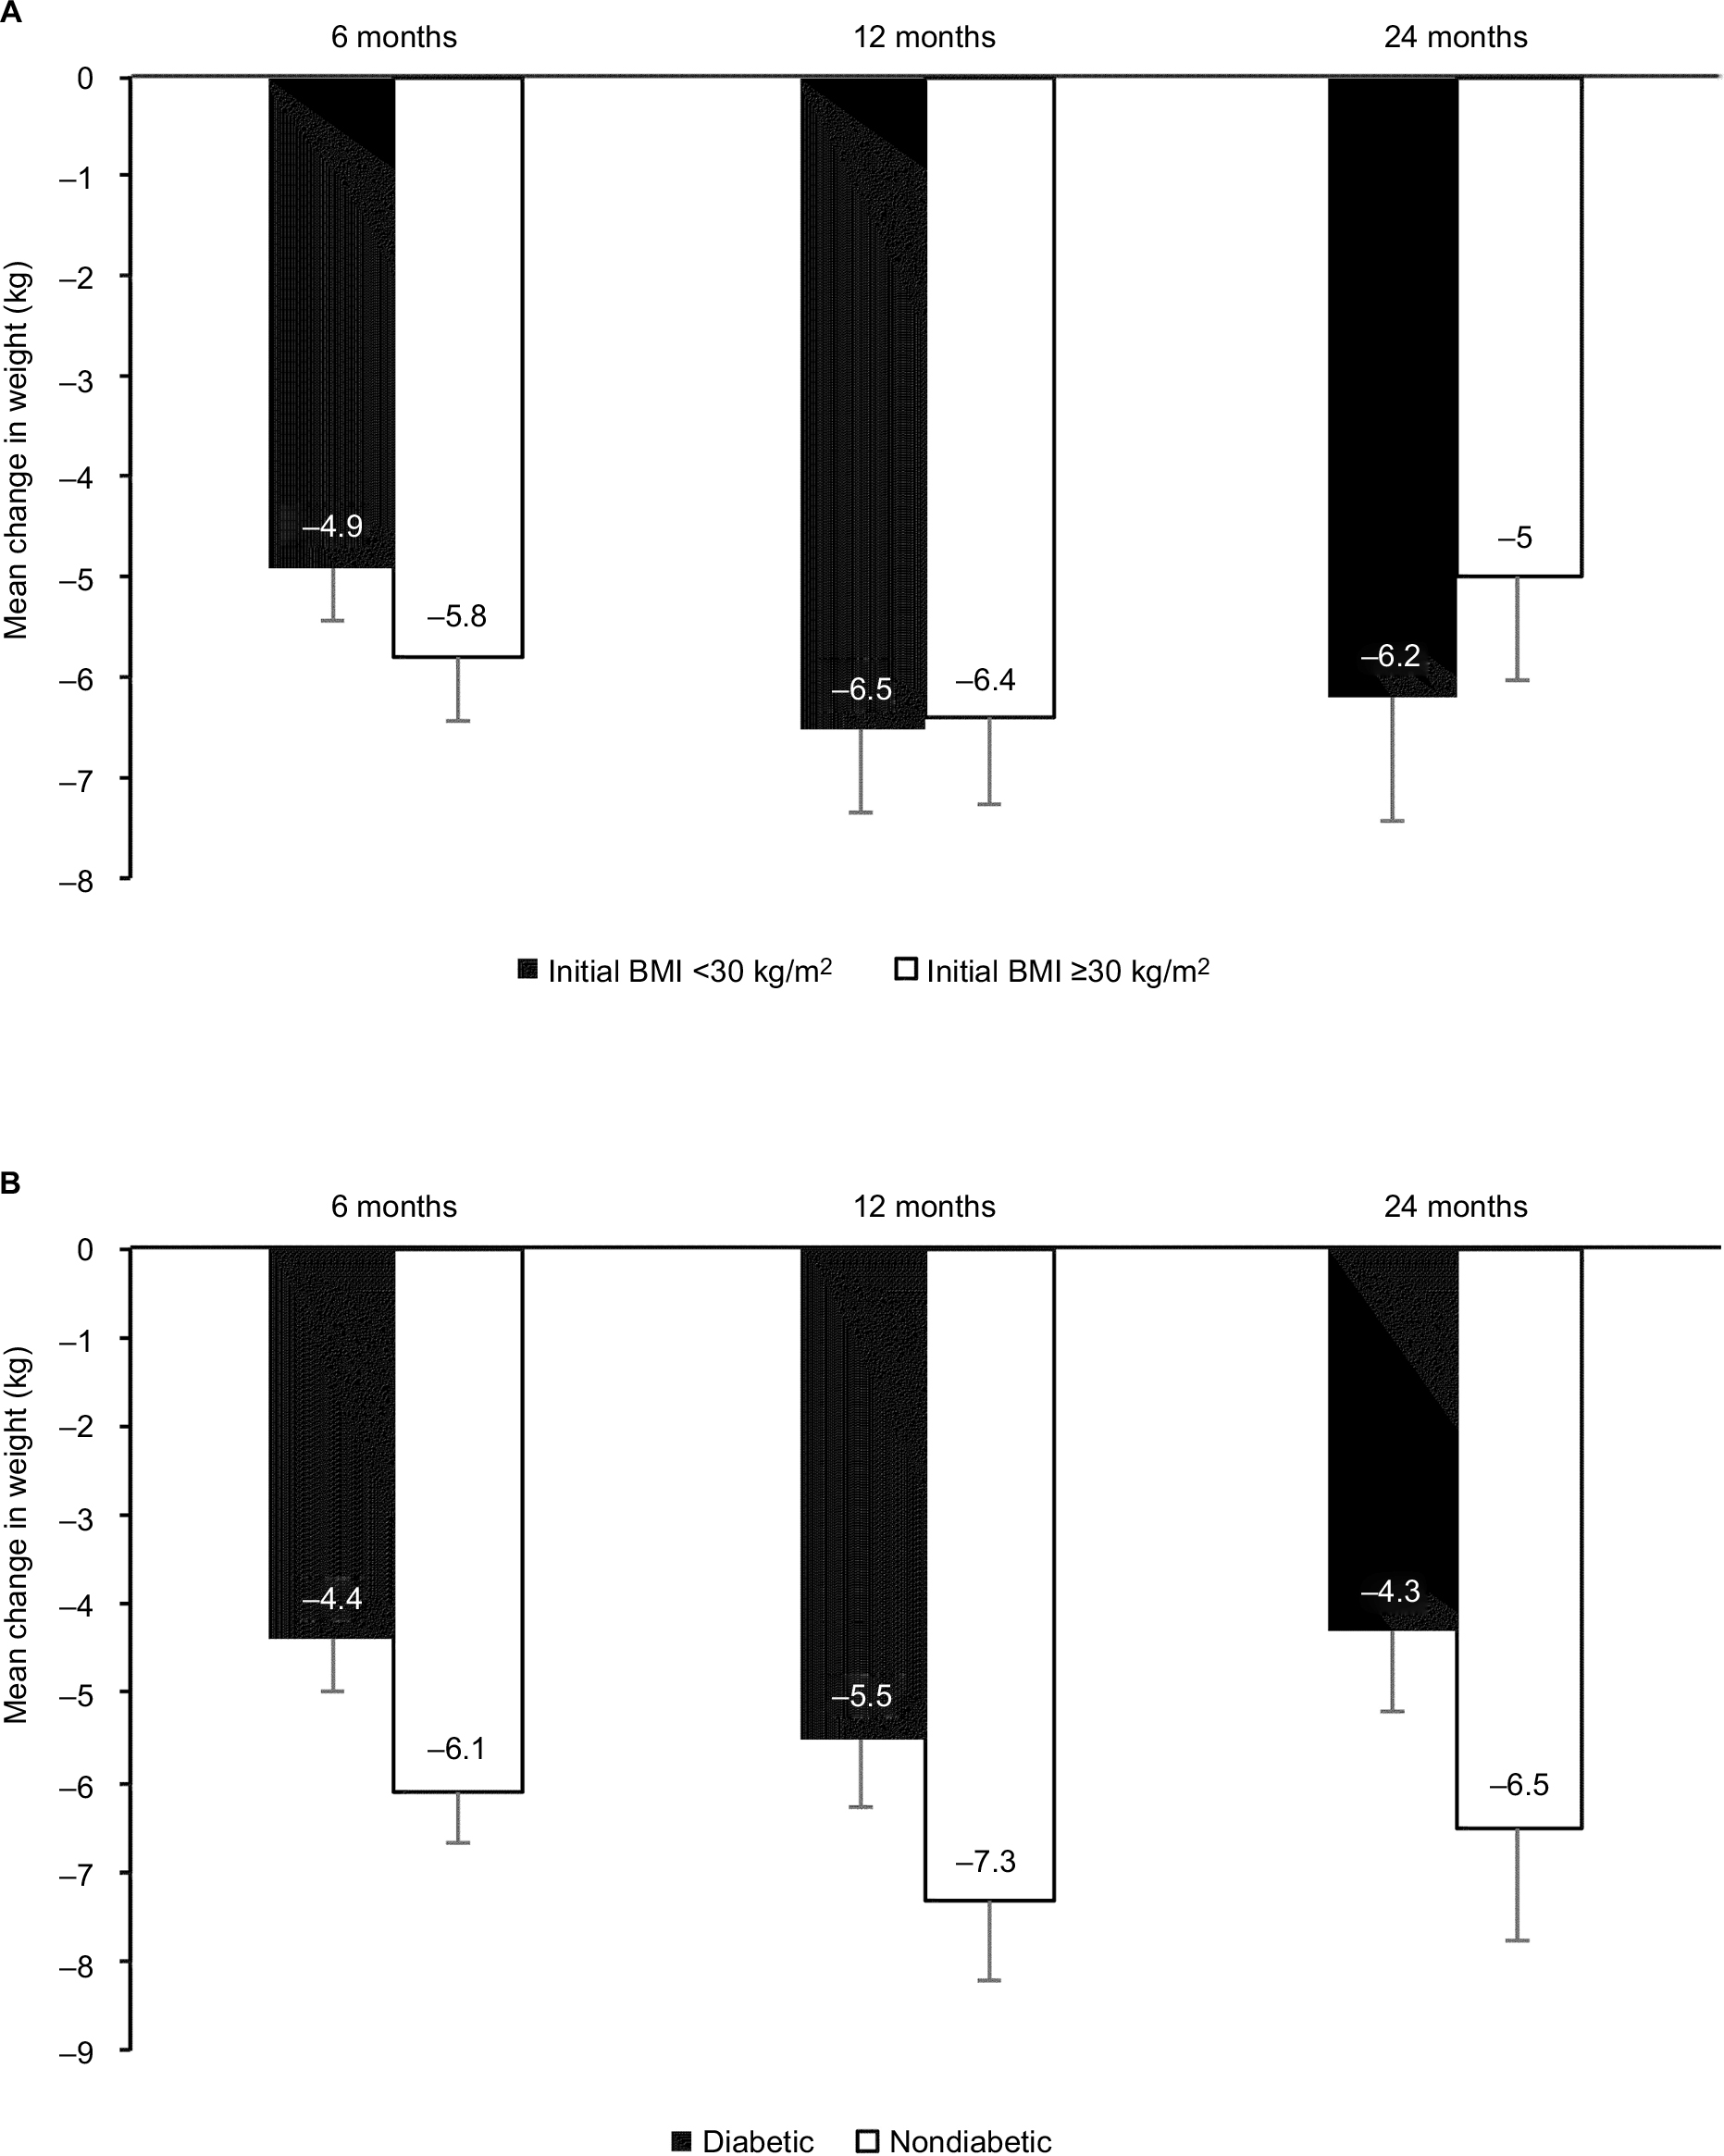 | Figure 4 Weight changes according to initial BMI (A) and type 2 diabetes mellitus (B) at various time points. Notes: T bars indicate standard errors. In the subgroup of initial BMI <30 kg/m2, the number of participants was 49 at 6 months, 27 at 12 months, and 20 at 24 months. It was, respectively, 55, 39, and 34 in the subgroup of initial BMI ≥30 kg/m2. In the subgroup of diabetic participants, the number of participants was 42 at 6 months, 31 at 12 months, and 26 at 24 months. It was, respectively, 62, 35, and 28 in the subgroup of nondiabetic participants. Abbreviation: BMI, body mass index. |
HbA1c
The mean HbA1c level was reduced at 6 months and this difference was still observed at 2 years (−1.1%±2.1%, p=0.001; Figure 5). On average, completers used 0.3±1.0 more oral medication to manage glycemia between baseline and 2 years; however, no statistical difference was observed (p=0.23). No new onset of T2DM was detected; however, among diabetics, seven patients were on insulin therapy at 2 years compared to four patients at baseline.
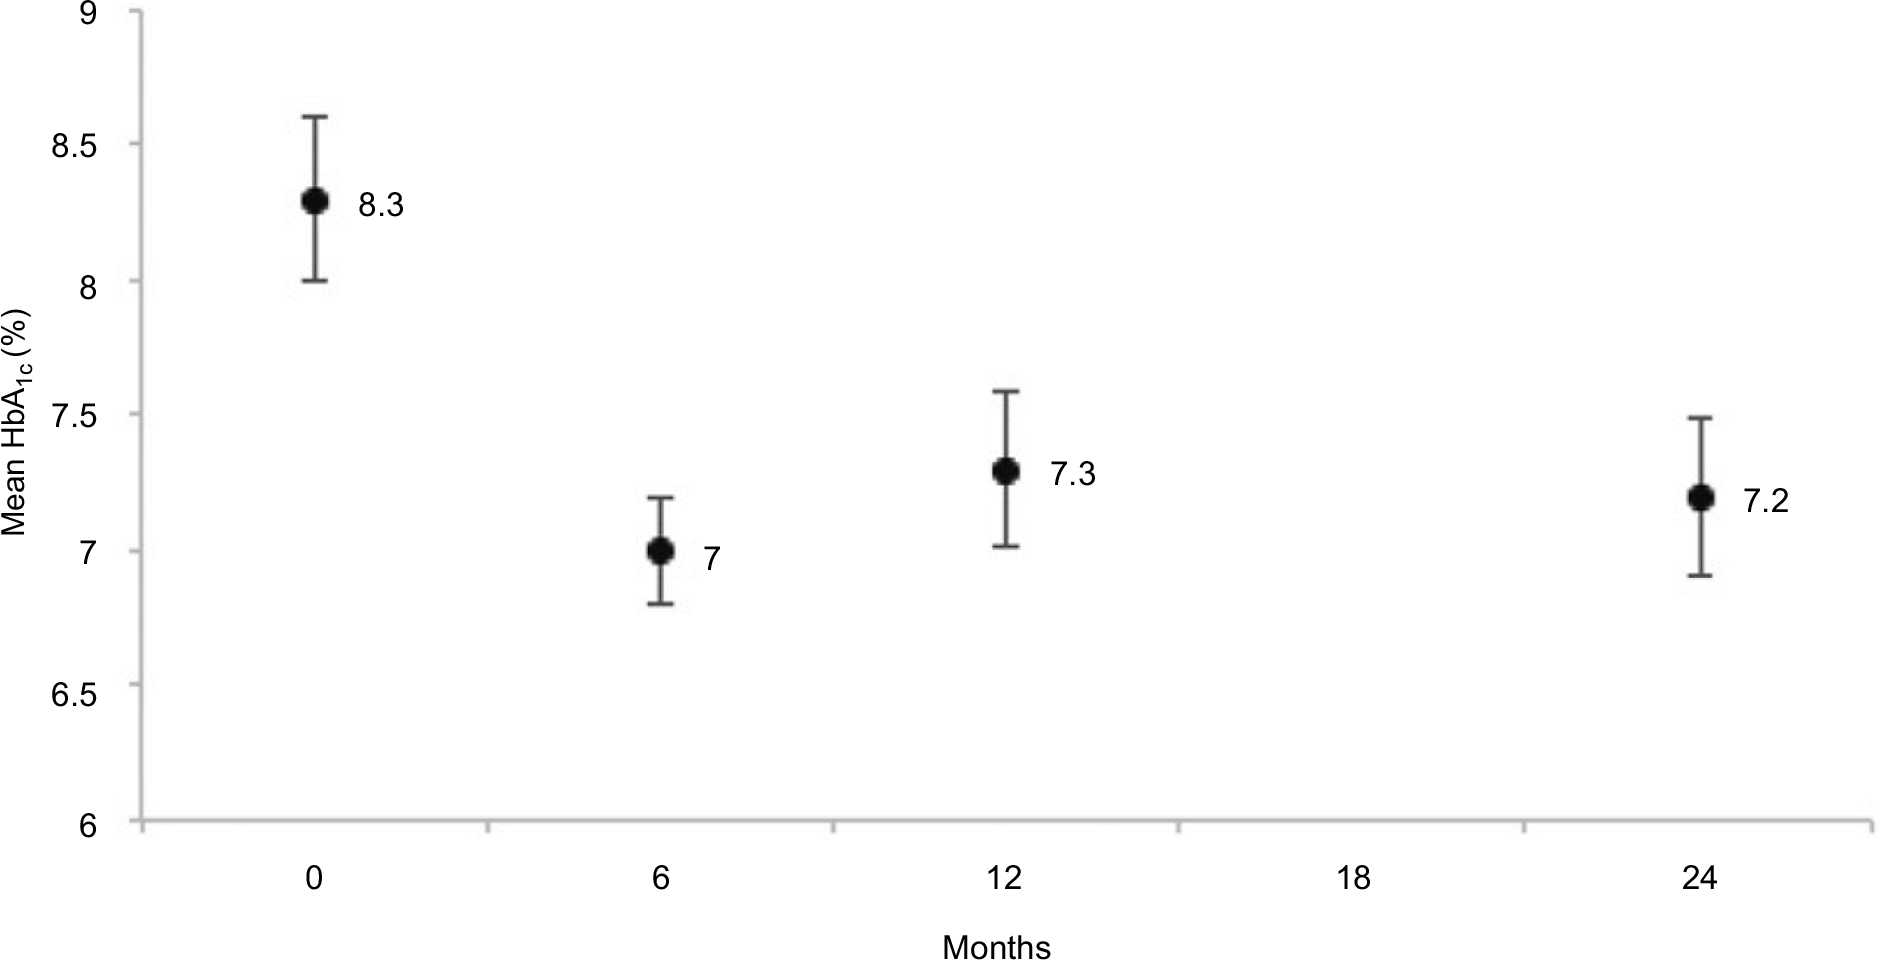 | Figure 5 HbA1c at various time points. Notes: Vertical bars indicate standard errors. Number of participants was 42 at baseline, 42 at 6 months, 31 at 12 months, and 26 at 24 months. Abbreviations: HbA1c, glycated hemoglobin. |
Changes in dietary behavior at 2 years
Reported food intake among completers showed excellent adherence to the “1,2,3 diet” because the consumption of all six prohibited foodstuffs was markedly lower (or became occasional). The typical trend in dietary changes reported by completers at 2 years is depicted in Table 2. Adherence to the diet was associated with a spontaneous higher intake of fresh bread, cheese, chocolate, and fresh fruits essentially, compared to their usual diet at baseline. Caloric intake was not assessed; however, a mean weight loss of 5.5 kg at 2 years corresponds to an average energy deficit of ~70 kcal/day.
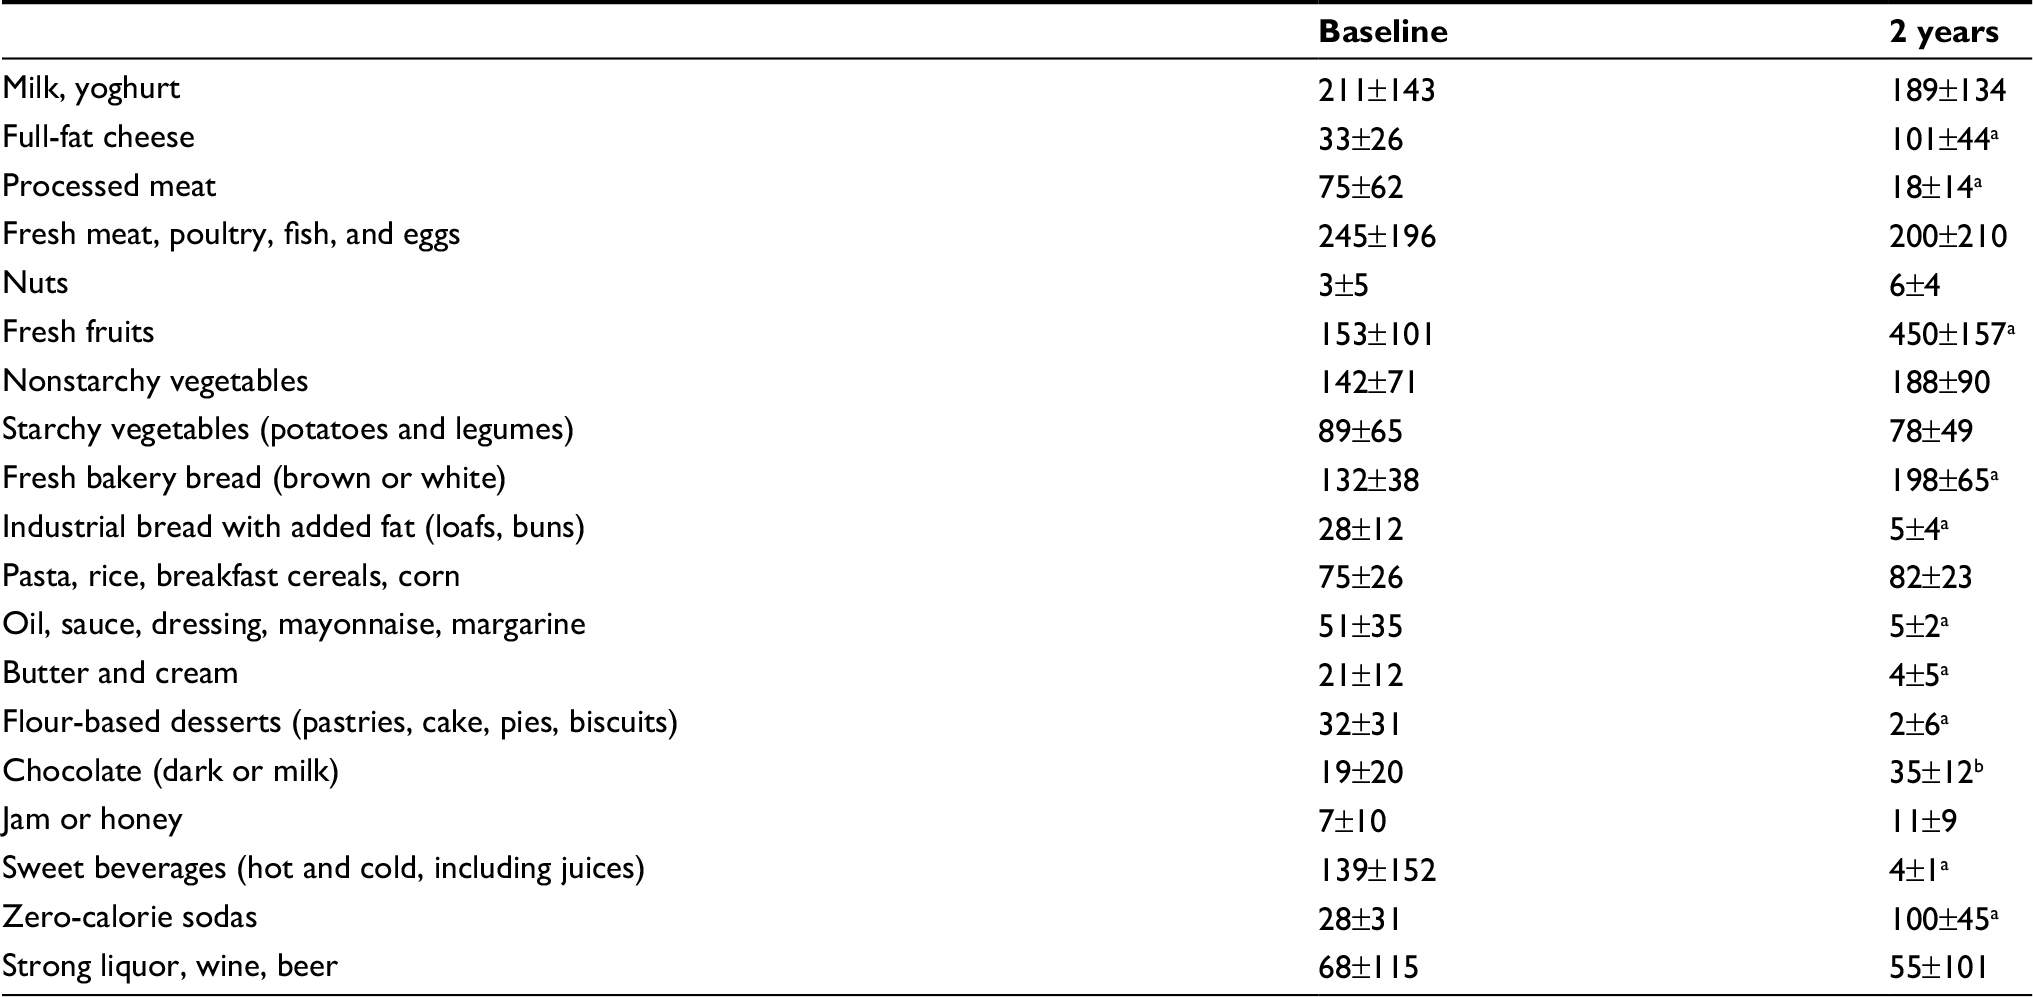 | Table 2 Diet composition (g/day) as estimated from 3-day food record among completers (n=51) at baseline and at 2 years Notes: Values are mean ± SD. aFor significant difference between baseline and 2 years (p<0.05). bp=0.061. |
Food preparations containing refined fat were easier to circumvent at home and in restaurants but difficult to avoid at company’s cafeterias and during friends or family gatherings. No side-effects were reported by completers.
Follow-up
Mean total number of visits per participant was 2.2±1.1, 5.2±1.7, and 9.7±2.9 at 6, 12, and 24 months, respectively, which is consistent with a low-intensity follow-up (one professional contact per month or less). For completers the mean number of visits per year was 4.9±1.5.
Discussion
Principal findings
This study suggests that moderately obese patients who avoid or markedly reduce oil, butter, margarine, mayonnaise, cream, processed meat, and sweet beverages might achieve successful weight loss at 2 years (5.6%) without counting calories or keeping up with an intensive professional follow-up. However, the high attrition rate suggests that it might be challenging for many to adhere to such diet on the long term. Glycemic levels improved significantly in diabetic patients, but the diet did not allow the reduction of glucose-lowering medication.
In the context of the current literature on weight-loss diets
Improvements in weight and HbA1c compared to baseline are in line with short-term Paleolithic diet studies.41 However, on the long term, a 2013 AHA/ACC/TOS obesity guideline and a 2015 systematic review and meta-analysis concluded that a macronutrient composition to a diet is of minor importance to weight loss.25,26 Instead, long-term effect on body weight depends mainly on the intensity of the intervention. Low-intensity (less than one monthly session) to moderate-intensity (between one and two sessions per month) interventions do not produce any weight loss. Only high-intensity comprehensive lifestyle intervention programs (>14 sessions with trained interventionists in 6 months) will allow 35%–60% of overweight/obese adults to maintain a loss ≥5% of initial body weight at 2 years’ follow-up.25,26 Based on this comprehensive data, the “1,2,3 diet” is the first low-intensity diet to our knowledge that suggests a possible weight loss at 2 years. A 2-year Paleolithic diet study in postmenopausal women showed similar weight loss, but intervention was of moderate intensity.3
Potential mechanism and explanations
Improved leptin sensitivity
Peripheral messengers such as leptin (a hormone essentially secreted by the adipose tissue) act strongly on the homeostatic central neural system (that mediates hunger/satiety feeling) to modulate food intake.27 During caloric restriction, weight loss induces a decrease in leptin levels resulting in an upregulation of these central neurons encouraging the consumption of food despite the persistence of adequate fat stores.28
In leptin-resistant states, in which leptin signaling is subdued,29 weight loss increases further the odds of weight regain.28 Added fats and oils, processed meat, and sugary drinks promote leptin resistance,5,21,22,30,31 a process mediated by the interplay of intestinal microbial dysbiosis, intestinal permeability, and the immune system.32 The exclusion of these foodstuffs in the “1,2,3” diet might have facilitated dietary restraint as witnessed by the meaningful long-term weight loss despite a low-intensity, ad libitum approach. This is consistent with an improved leptin sensitivity5,13 probably mediated by a more favorable microbiota and inflammatory profile. In parallel, the observed increase in fruits, dark chocolate, or fermented cheese consumption might have contributed as well to this enhanced satiety. Indeed, the regular consumption of those phenolic compound–rich foods may beneficially balance the gut microbiota,42 induce the release of satiating gut hormones such as GLP-1 and decrease the orexigenic ghrelin expression on the long term.43
Shifting from addictive obesogenic food to addictive nonobesogenic food
Another biologic process that facilitates weight regain after a diet is related to the addictive properties of processed food.28,33 Humans trying to cut back on such food during weight loss report craving and anxiety that ultimately drive food intake.28 However, not all addictive foods are equally implicated in weight gain. For instance, rats binging on sugar do not experience weight gain, whereas binging on refined fat-enriched food is associated with an increase in body weight.34,35 In the “1,2,3” diet patients compensated their low intake of processed fats by a higher consumption of fresh bread, cheese, and chocolate. These food items described as addictive33,36 seem, however, not to be associated with obesity or inflammatory microbiota.20,37,38 For instance, a recent human study39 indicates that an increase in cheese consumption can beneficially modify the gut microbiota to increase short-chain fatty acid (SCFA) levels when compared to diet containing butter. The evidence for a potential role of SCFA to counteract obesity by stimulating the secretion of satiety hormones and energy expenditure is increasing. Therefore, we can speculate that the long-term adherence to the “1,2,3” diet might be due to a spontaneous shift to highly rewarding, yet not obesogenic, food. These hypotheses remain speculative until further studies can be conducted that include a thorough assessment of dietary changes, microbiota, and leptin profiles.
Limitations of the study
The main strength of this exploratory study is the relatively long duration and a high heterogeneity of patients, making the results easier to generalize to other free-living populations. However, it has several limitations. This was a single-arm, open-label investigation. Although lacking a control group it suggests that this approach to weight loss might be helpful to motivate overweight or mildly obese patients not willing to engage in high-intensity programs. Further studies should include a control group to further test the efficacy of the “1,2,3” diet. The open-label design may introduce a bias. When participants know that they are being provided with an experimental diet, their compliance may rise and could lead to better outcomes.44 However, such bias is less relevant in long-term studies because diminished compliance after the first few months is typical in weight-loss trials.45
Another limitation is related to our primary analysis where missing weight was handled using the last observation carried forward. This statistical approach probably understates weight regain of lost-to-follow-up patients. Only completers’ data might, therefore, be relevant for assessment. Fifty-one percent of patients completed the study, making the attrition rate higher than our expected 40% (however, the power attained with our sample size remains above 90%). This high attrition rate at 2 years underscores the difficulty of long-term follow-up with diets. However, attrition rates attributable to lifestyle modification programs are higher than 35% in one-third of clinical trials and appear to be strongly correlated with treatment duration and inversely correlated to intensity of interventions.40 This reminds us that, because many studies did not control for high attrition rates, the reported results in the literature are probably a best-case scenario.
Implications
This 2-year preliminary study suggests that most mildly obese patients were able to successfully adopt an ad libitum diet devoid of only six refined foods even with minimal professional contact. Adherence to such diet revealed significant sustained weight loss and improved glycemic profile among this population. These long-term data suggest that the “1,2,3” diet could be a viable option for some obese and diabetic patients not willing to engage in constraining lifestyle intervention programs. Further research is necessary to confirm these data and assess the long-term safety of the “1,2,3” diet.
Data sharing statement
Please contact author for data requests.
Author contributions
Designed research (RC, SN and HT), conducted research (RC and SN), analyzed data (HT, MG, PL, SN, ID and BH), wrote paper (RC, HT), had primary responsibility for final content (ID, SN, and RC). All the authors (RC, MG, PL, BH, SN, ID, and HT) contributed to revising, editing, and approving the final manuscript.
Disclosure
The authors report no conflicts of interest in this work.
References
Chaput JP, Perusse L, Despres JP, Tremblay A, Bouchard C. Findings from the Quebec Family Study on the Etiology of Obesity: genetics and environmental highlights. Curr Obes Rep. 2014;3:54–66. | ||
Lindeberg S, Berntorp E, Nilsson-Ehle P, Terent A, Vessby B. Age relations of cardiovascular risk factors in a traditional Melanesian society: the Kitava Study. Am J Clin Nutr. 1997;66(4):845–852. | ||
Mellberg C, Sandberg S, Ryberg M, et al. Long term effet of a Paleolithic-type diet in obese postmenopausal women: two-year randomized trial. Eur J Clin Nutr. 2014;68(3):350–357. | ||
Cordain L, Eaton SB, Sebastian A, et al. Origins and evolution of the Western diet: health implications for the 21th century. Am J Clin Nutr. 2005;81(2):341–354. | ||
Spreadbury I. Comparison with ancestral diets suggests dense acellular carbohydrates promote an inflammatory microbiota, and may be the primary dietary cause of leptin resistance and obesity. Diabetes Metab Syndr Obes. 2012;5:175–189. | ||
de Lartigue G, Ronveaux CC, Raybould HE. Deletion of leptin signaling in vagal afferent neurons results in hyperphagia and obesity. Mol Metab. 2014;3(6):595–607. | ||
Eaton SB, Eaton SB 3rd. Paleolithic vs. modern diets-selected pathophysiological implications. Eur J Nutr. 2000;39(2):67–70. | ||
Lindeberg S, Jönsson T, Granfeldt Y, et al. A Palaeolithic diet improves glucose tolerance more than a Mediterranean-like diet in individuals with ischaemic heart disease. Diabetologia. 2007;50(9):1795–1807. | ||
Jonsson T, Granfeldt Y, Ahrén B, et al. Beneficial effects of a Paleolithic diet on cardiovascular risk factors in type 2 diabetes: a randomized cross-over pilot study. Cardiovasc Diabetol. 2009;8:35. | ||
Boers I, Muskiet FA, Berkelaar E, et al. Favourable effects of consuming a Palaeolithic-type diet on characteristics of the metabolic syndrome: a randomized controlled pilot-study. Lipids Health Dis. 2014;13:160. | ||
Jonsson T, Granfeldt Y, Erlanson-Albertsson C, Ahren B, Lindeberg S. A paleolithic diet is more satiating per calorie than a mediterranean-like diet in individuals with ischemic heart disease. Nutr Metab (Lond). 2010;7:85. | ||
Jonsson T, Granfeldt Y, Lindeberg S, Hallberg AC. Subjective satiety and other experiences of a Paleolithic diet compared to a diabetes diet in patients with type 2 diabetes. Nutr J. 2013;12:105. | ||
Huo L, Maeng L, Bjorbaek C, Grill HJ. Leptin and the control of food intake: neurons in the nucleus of the solitary tract are activated by both gastric distension and leptin. Endocrinology. 2007;148(5):2189–2197. | ||
US [webpage on the Internet]. News Best Diet Rankings; 2015. Available from: http://health.usnews.com/best-diet. | ||
Metzgar M, Rideout TC, Fontes-Villalba M, Kuipers RS. The feasibility of a Paleolithic diet for low-income consumers. Nutr Res. 2011;31(6):444–451. | ||
Monteiro CA, Moubarac JC, Cannon G, Ng SW, Popkin B. Ultra-processed products are becoming dominant in the global food system. Obes Rev. 2013;14(Suppl 2):21–28. | ||
Keita H, Ramirez-San Juan E, Paniagua-Castro N, Garduno-Siciliano L, Quevedo L. The long-term ingestion of a diet high in extra virgin olive oil produces obesity and insulin resistance but protects endothelial function in rats: a preliminary study. Diabetol Metab Syndr. 2013;5(1):53. | ||
Dong D, Bilger M, van Dam RM, Finkelstein EA. Consumption of specific foods and beverages and excess weight gain among children and adolescents. Health Aff (Millwood). 2015;34(11):1940–1948. | ||
Deol P, Evans JR, Dhahbi J, et al. Soybean oil is more obesogenic and diabetogenic than coconut oil and fructose in mouse: potential role for the liver. PLoS One. 2015;10(7):e0132672. | ||
Mozaffarian D, Hao T, Rimm EB, Willett WC, Hu FB. Changes in diet and lifestyle and long-term weight gain in women and men. N Engl J Med. 2011;364(25):2392–2404. | ||
Deopurkar R, Ghanim H, Friedman J, et al. Differential effects of cream, glucose, and orange juice on inflammation, endotoxin, and the expression of Toll-like receptor-4 and suppressor of cytokine signaling-3. Diabetes Care. 2010;33(5):991–997. | ||
Vasselli JR, Scarpace PJ, Harris RB, Banks WA. Dietary components in the development of leptin resistance. Adv Nutr. 2013;4(2):164–175. | ||
Hu FB. Resolved: there is sufficient scientific evidence that decreasing sugar-sweetened beverage consumption will reduce the prevalence of obesity and obesity-related diseases. Obes Rev. 2013;14(8):606–619. | ||
Foster GD, Wyatt HR, Hill JO, et al. A randomized trial of a low-carbohydrate diet for obesity. N Engl J Med. 2003;348(21):2082–2090. | ||
Jensen MD, Ryan DH, Apovian CM, et al. 2013 AHA/ACC/TOS guideline for the management of overweight and obesity in adults: a report of the American College of Cardiology/American Heart Association Task Force on Practice Guidelines and The Obesity Society. J Am Coll Cardiol. 2014;63:2985–3023. | ||
Tobias DK, Chen M, Manson JE, Ludwig DS, Willett W, Hu FB. Effect of low-fat diet interventions versus other diet interventions on long-term weight change in adults: a systematic review and meta-analysis. Lancet Diabetes Endocrinol. 2015;3(12):968–979. | ||
Ochner CN, Tsai AG, Kushner RF, Wadden TA. Treating obesity seriously: when recommendations for lifestyle change confront biological adaptations. Lancet. Diabetes Endocrinol. 2015;3(4):232–234. | ||
Ochner CN, Barrios DM, Lee CD, Pi-Sunyer FX. Biological mechanisms that promote weight regain following weight loss in obese humans. Physiol Behav. 2013;120:106–113. | ||
Zhang F, Chen Y, Heiman M, Dimarchi R. Leptin: structure, function and biology. Vitam Horm. 2005;71:345–372. | ||
la Fleur SE, van Rozen AJ, Luijendijk MC, Groeneweg F, Adan RA. A free-choice high-fat high-sugar diet induces changes in arcuate neuropeptide expression that support hyperphagia. Int J Obes (Lond). 2010;34(3):537–546. | ||
Kratz M, von Eckardstein A, Fobker M, et al. The impact of dietary fat composition on serum leptin concentrations in healthy nonobese men and women. J Clin Endocrinol Metab. 2002;87(11):5008–5014. | ||
Cox AJ, West NP, Cripps AW. Obesity, inflammation, and the gut microbiota. Lancet Diabetes Endocrinol. 2015;3(3):207–215. | ||
Schulte EM, Avena NM, Gearhardt AN. Which foods may be addictive? The roles of processing, fat content, and glycemic load. PLoS One. 2015;10(2):e0117959. | ||
Avena NM. The study of food addiction using animal models of binge eating. Appetite. 2010;55(3):734–737. | ||
Avena NM, Rada P, Hoebel BG. Sugar and fat bingeing have notable differences in addictive-like behavior. J Nutr. 2009;139(3):623–628. | ||
Keser A, Yüksel A, Yeşiltepe-Mutlu G, Bayhan A, Özsu E, Hatun Ş. A new insight into food addiction in childhood obesity. Turk J Pediatr. 2015;57(3):219–224. | ||
Cuenca-Garcia M, Ruiz JR, Ortega FB, Castillo MJ; HELENA Study Group. Association between chocolate consumption and fatness in European adolescents. Nutrition. 2014;30(2):236–239. | ||
Serra-Majem L, Bautista-Castano I. Relationship between bread and obesity. Br J Nutr. 2015;113(Suppl 2):S29–S35. | ||
Zheng H, Yde CC, Clausen MR, et al. Metabolomics investigation to shed light on cheese as a possible piece in the French paradox puzzle. J Agric Food Chem. 2015;63(10):2830–2839. | ||
Turk MW, Yang K, Hravnak M, Sereika SM, Ewing LJ, Burke LE. Randomized clinical trials of weight loss maintenance: a review. J Cardiovasc Nurs. 2009;24(1):58–80. | ||
Manheim EW, van Zuuren EJ, Fedorowicz Z, Pijl H. Paleolithic nutrition for metabolic syndrome: systematic review and meta-analysis. Am J Clin Nutr. 2015;102(4):922–932. | ||
Ozdal T, Sela DA, Xiao J, Boyacioglu D, Chen F, Capanoglu E. The reciprocal interactions between polyphenols and gut microbiota and effects on bioaccessibility. Nutrients. 2016;8(2):78. | ||
Serrano J, Casanova-Martí À, Depoortere I, et al. Subchronic treatment with grape-seed phenolics inhibits ghrelin production despite a short-term stimulation of ghrelin secretion produced by bitter-sensing flavanols. Mol Nutr Food Res. 2016;60(12):2554–2564. | ||
Kawamura A, Kajiya K, Kishi H, et al. Effects of the DASH-JUMP dietary intervention in Japanese participants with high-normal blood pressure and stage 1 hypertension: an open-label single-arm trial. Hypertens Res. 2016;39(11):777–785. | ||
Saks FM, Bray GA, Carey VJ, et al. Comparison of weight-loss diets with different compositions of fat, protein, and carbohydrates. N Engl J Med. 2009;360(9):859–873. |
 © 2018 The Author(s). This work is published and licensed by Dove Medical Press Limited. The
full terms of this license are available at https://www.dovepress.com/terms
and incorporate the Creative Commons Attribution
- Non Commercial (unported, 3.0) License.
By accessing the work you hereby accept the Terms. Non-commercial uses of the work are permitted
without any further permission from Dove Medical Press Limited, provided the work is properly
attributed. For permission for commercial use of this work, please see paragraphs 4.2 and 5 of our Terms.
© 2018 The Author(s). This work is published and licensed by Dove Medical Press Limited. The
full terms of this license are available at https://www.dovepress.com/terms
and incorporate the Creative Commons Attribution
- Non Commercial (unported, 3.0) License.
By accessing the work you hereby accept the Terms. Non-commercial uses of the work are permitted
without any further permission from Dove Medical Press Limited, provided the work is properly
attributed. For permission for commercial use of this work, please see paragraphs 4.2 and 5 of our Terms.