Back to Journals » Clinical Ophthalmology » Volume 14
VRF-G, a New Intraocular Lens Power Calculation Formula: A 13-Formulas Comparison Study
Authors Hipólito-Fernandes D ![]() , Elisa Luís M
, Elisa Luís M ![]() , Gil P
, Gil P ![]() , Maduro V, Feijão J, Yeo TK, Voytsekhivskyy O
, Maduro V, Feijão J, Yeo TK, Voytsekhivskyy O ![]() , Alves N
, Alves N
Received 9 November 2020
Accepted for publication 2 December 2020
Published 16 December 2020 Volume 2020:14 Pages 4395—4402
DOI https://doi.org/10.2147/OPTH.S290125
Checked for plagiarism Yes
Review by Single anonymous peer review
Peer reviewer comments 2
Editor who approved publication: Dr Scott Fraser
Diogo Hipólito-Fernandes,1 Maria Elisa Luís,1 Pedro Gil,1 Vitor Maduro,1 João Feijão,1 Tun Kuan Yeo,2 Oleksiy Voytsekhivskyy,3 Nuno Alves1
1Department of Ophthalmology, Centro Hospitalar Universitário De Lisboa Central, Lisbon 1169-050, Portugal; 2Department of Ophthalmology, Tan Tock Seng Hospital, National Healthcare Group Eye Institute, Singapore; 3Department of Ophthalmology, Kyiv Clinical Ophthalmology Hospital Eye Microsurgery Center, Medical City, Kyiv 03680, Ukraine
Correspondence: Diogo Hipólito-Fernandes
Department of Ophthalmology, Centro Hospitalar Universitário De Lisboa Central, Alameda De Santo António Dos Capuchos, Lisbon 1169-050, Portugal
Tel +351 21 313 6300
Email [email protected]
Purpose: To compare the accuracy of a newly developed intraocular lens (IOL) power formula (VRF-G) with twelve existing formulas (Barret Universal II, EVO 2.0, Haigis, Hill-RBF 2.0, Hoffer Q, Holladay 1, Kane, Næeser 2, PEARL-DGS, SRK/T, T2 and VRF).
Methods: Retrospective case series including 828 patients having uncomplicated cataract surgery with the implantation of a single IOL model (SN60WF). Using optimised constants, refraction prediction error of each formula was calculated for each eye. Subgroup analysis was performed based on the axial length (short ≤ 22.0mm; medium > 22.0mm to < 26.0mm; long ≥ 26.0mm). Main outcomes included mean prediction error (ME) mean (MAE) and median absolute error (MedAE), in diopters (D), and the percentage of eyes within ± 0.25D, ± 0.50D, ± 0.75D and ± 1.00D.
Results: Formulas absolute errors were statistically different among them (p< 0.001), with Kane having the lowest MAE of all formulas, followed by EVO 2.0 and VRF-G, which had the lowest MedAE. The Kane formula had the highest percentage of eyes within ± 0.25D (47.0%) and ± 1.00D (97.7%) and the VRF-G formula had the highest percentage of eyes within ± 0.50D (79.5%). For all AL subgroups, Kane, EVO 2.0 and VRF-G formulas had the most accurate performances (lowest MAE).
Conclusion: New generation formulas may help us in achieving better refractive results, lowering the variance in accuracy in extreme eyes – Kane, EVO 2.0 and VRF-G formulas are promising candidates to fulfil that goal.
Keywords: intraocular lens power calculation formulas, biometry, cataract, phacoemulsification, formulas accuracy
Introduction
Cataract surgery is the most frequently performed refractive procedure worldwide. Achieving the desired target refractive outcome has become a key tenet in recent years as patients’ refractive expectations continue to rise.
The most widely used intraocular lens (IOL) power formulas are vergence-based,1 estimating the effective lens position (ELP) from 2 to 7 eye parameters (Barrett Universal II, Haigis, Hoffer Q, Holladay 1 and 2 and SRK/T), and traditionally classified by generation.
Recently, some modern formulas have appeared, using newer methodologies like artificial intelligence and larger number of preoperative eye parameters for prediction, which may be outside the proposed categories for formulas classification described in 2017.2
Previous studies, using biometers based on partial coherence interferometry (PCI), swept-source optical coherence tomography (SS-OCT) or optical low-coherence interferometry (OLCR), revealed promising results with regard to some of these new formulas.3–9 Kane formula seems to be the most accurate formula available,4–6 with Barrett Universal II continuing to be a very reliable option (84% of eyes within 0.50D for Kane formula and 80% of for Barrett Universal II).3,4 Very recently, EVO (version 2.0) also showed good results, being one of the most accurate formulas using both SS-OCT and PCI based biometers to obtain biometric data.6,8
However, we are unaware of comparative studies including EVO (version 2.0) and PEARL-DGS, using an OLCR biometer.
VRF formula is a vergence-based thin-lens formula using four variables: axial length, keratometry, anterior chamber depth, and horizontal corneal diameter. However, it does not consider parameters such as lens thickness and gender and published results did not position it as one of the most accurate formulas. VRF-G formula is a modification of VRF, based on theoretical optics with regression and ray-tracing components, operating eight variables for IOL power calculation to improve previsions accuracy (VRF parameters described above plus lens thickness, preoperative refraction, central corneal thickness, gender).
Our study aimed to assess and compare the overall accuracy of the classic, vergence-based formulas, with new-generation formulas, using measurements obtained from an OLCR biometer Lenstar LS900® (Haag-Streit AG, Köniz, Switzerland). Moreover, we want to report the first results obtained with a newly developed formula – VRF-G.
Materials and Methods
Patients
This was a retrospective review study that included consecutive patients who underwent cataract surgery and implantation of a monofocal in-the-bag IOL from 2017 to 2019 at Centro Hospitalar Universitário de Lisboa central, performed by six different surgeons. The study adhered to the principles of the Declaration of Helsinki and approval was obtained by Centro Hospitalar Unviversitário de Lisboa Central Ethics Committee. Written informed consent was obtained from all patients regarding the use of their medical records for a scientific investigation.
Inclusion criteria were patient’s age of at least 18 years-old and the implantation of an Acrysof IQ SN60WF (Alcon Laboratories, Geneva, Switzerland) IOL through a 2.75mm clear corneal incision. Exclusion criteria were: (1) incomplete biometry data; (2) postoperative corrected distance visual acuity inferior than 20/40; (3) keratometric astigmatism > 4D; (4) any intraoperative or postoperative complication; (5) previous intraocular or refractive surgery; (6) any corneal disease, as keratoconus or corneal scarring of any aetiology.
Based on Hoffer K.J. et al10 recommendations, only one eye per patient was included. If both eyes of the same patient fulfilled the above-mentioned criteria, the eye included was chosen randomly.
Preoperative optical biometry was performed with optical low-coherence reflectometry (OLCR) – Lenstar LS-900® (Haag-Streit AG, Köniz, Switzerland), obtaining the following data for each patient: axial length (AL), anterior chamber depth (ACD), central corneal thickness (CT), keratometry (K), lens thickness (LT) and horizontal corneal diameter (HCD). The keratometric index used was 1.3375. Postoperative manifest refraction was assessed 4 weeks after surgery by an ophthalmologist.
Formula Calculation
Spherical equivalent predictions from thirteen IOL power calculation formulas were obtained. Calculations were performed as follows:
- Barrett Universal II (UII), a multiple-parameter vergence-based thick-lens formula is included in the software of Lenstar LS900®. The formula is also freely available online.23 Constant optimisation and data analysis were performed for us by the author, Graham Barrett, FRANZCO.
- Emmetropia Verifying Optical (EVO) formula26 (version 2.0) is a thick-lens formula based on the theory of emmetropization and is freely available online. Constant optimisation and data analysis were performed by the author Tun Kuan Yeo, FRCOphth.
- Vergence-based Haigis,11 HofferQ12 Holladay 1,13 and SRK/T14 formulas were calculated by Jack Kane, MD, using an already validated Excel (Microsoft Corporation, Redmond, WA, USA) spreadsheet.15 The results were confirmed and validated against optical biometer printouts by one of the authors (DHF).
- Hill-RBF 2.0 uses adaptive learning from a large dataset to predict refractive outcomes through artificial intelligence – it was calculated using its online platform.24 Constant optimisation and data analysis were performed Jack Kane, MD and the results were confirmed by one of the authors (DHF)
- Kane formula25 is based on theoretical optics and incorporates both regression and artificial intelligence components to refine predictions. Constant optimisation and data analysis were performed by the author Jack Kane, MD.
- Næeser216 is a thick-lens vergence formula that predicts the geometric ACD, instead of ELP. The formula is available in Excel (Microsoft Corporation, Redmond, WA, USA) from its author. Optimisation and data analysis were performed by one of this study authors (O.V.V) following the recommendations of the formula’s author (Kristian Næeser, MD).
- PEARL-DGS27 formula uses machine learning modelling and output linearization to predict ELP and adjustments for extreme biometric values. Constant optimisation and data analysis were performed by one of the authors (Guillaume Debellemanière, MD).
- T2 formula was developed as an improvement to the SRK/T.17 The formula was computed on Excel (Microsoft Corporation, Redmond, WA, USA) and constant optimisation was performed by one of this study authors (O.V.V)
- VRF formula18 is a vergence-based thin-lens formula, developed by Oleksiy V. Voytsekhivskyy, MD and available on its software (VIOL Commander V.2.0.0.0.) Constant optimisation and data analysis were performed by the author.
- VRF-G formula is an unpublished new formula developed by Oleksiy V. Voytsekhivskyy. This is a next-generation formula based on theoretical optics with regression and ray-tracing components. It operates eight variables for IOL power calculation. It was programmed into Excel (Microsoft Corporation, Redmond, WA, USA) – constant optimisation, and data analysis were performed by the formula’s author.
Differences regarding metrics used by each formula are summarized in Supplementary Table 1.
As above-mentioned, each formula constant used was optimised for the entire dataset of patients, to achieve an arithmetic mean prediction error (ME) of zero, following recommended protocols.10,19 Any small residual ME was nulled by adjusting the refractive prediction error for each eye up or down by an amount equal to the ME of that group, as described by Wang L et al.20
Outcome Measurements
Refractive prediction error was calculated as the difference between the spherical equivalent of the post-operative manifest refraction and the formula prediction error. A negative refractive prediction error represents a myopic error, and a positive prediction error represents a hyperopic error.20
Study outcome measures included ME and its standard deviation (SD), mean absolute error (MAE) and median absolute error (MedAE) of each formula, following Hoffer K. and Savini G.19 and Wang L et al20 recommendations. The percentage of eyes with a prediction error within ±0.25, ±0.50, ±0.75 and ±1.00 dioptres were also calculated.
The subgroup analysis was performed based on AL intervals: short (AL ≤ 22.0 mm), medium (22.0 mm < AL < 26.0 mm) and long (AL ≥ 26 mm) eyes.
Statistical Analysis
Demographics and biometric data of patients were described with frequencies (percentages) and mean (SD: standard deviation). Data normality was assessed by the Kolmogorov–Smirnov test. The parametric one sample t-test or non-parametric Wilcoxon signed-rank test (1 sample) were used, as appropriate, to evaluate whether the mean refractive prediction error of each formula was different from zero. ANOVA with repeated measures were used to compare formulas prediction error. The comparisons of the absolute errors were assessed using the Friedman test (non-parametric ANOVA) with Bonferroni correction, as recommended,20,21 using Wilcoxon rank sum test for pairwise comparisons. The Cochran Q test was used to compare the percentage of eyes within ±0.25D, ±0.50D and ±1.00D, with Bonferroni adjustment, using Dunn post-test. A p-value of less than 0.05 was considered statistically significant. Statistical analysis was performed using SPSS for Windows Software (version 24.0, SPSS, Inc.).
Results
Demographics and Biometric Data
A total of 828 eyes of 828 Caucasian patients fulfilled the inclusion criteria. Patients’ demographics and biometric data are presented in Table 1.
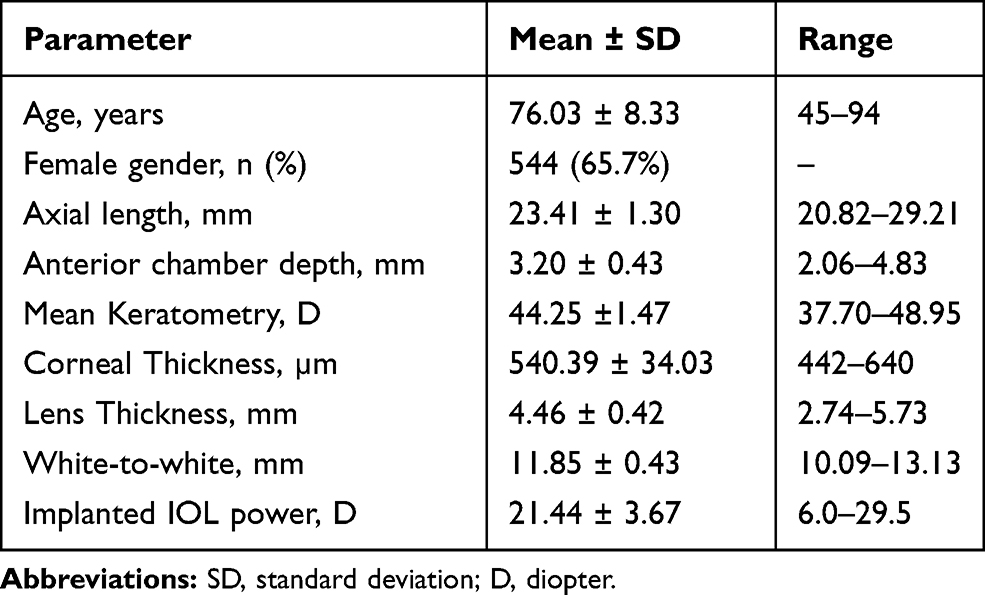 |
Table 1 Demographic and Biometric Data of Patients |
Based on AL, 82 eyes (9.9%) were classified as short, 695 (83.9%) as medium and 51 (6.2%) as long. Optimised constants used are shown in Supplementary Table 1.
Overall Formulas Accuracy
There was no statistically significant difference between the ME of formulas, since all formulas were optimised to have a ME of zero (p=0.998).
Over the entire sample, there was a significant difference between the formulas’ absolute prediction errors (p<0.001). The lowest MAE and MedAE were obtained with Kane, EVO 2.0 and VRF-G formulas – their absolute errors were lower than SRK/T, Holladay 1, Hoffer Q, Haigis and Næeser 2 (p<0.001 for each comparison). The Kane formula absolute error was also lower than the error obtained with Hill-RBF 2.0, Barrett UII, PEARL-DGS, VRF and T2 formulas (p<0.001). EVO 2.0 revealed a better performance compared to Barrett UII, PEARL-DGS and VRF (p<0.001). On the other hand, Hoffer Q had the highest absolute error, which was significantly higher than all other formulas (p<0.001), except Haigis and Næeser 2. Table 2 reveals the outcomes of each formula ranked by MAE. Supplementary Table 2 includes the formulas ranked by MedAE.
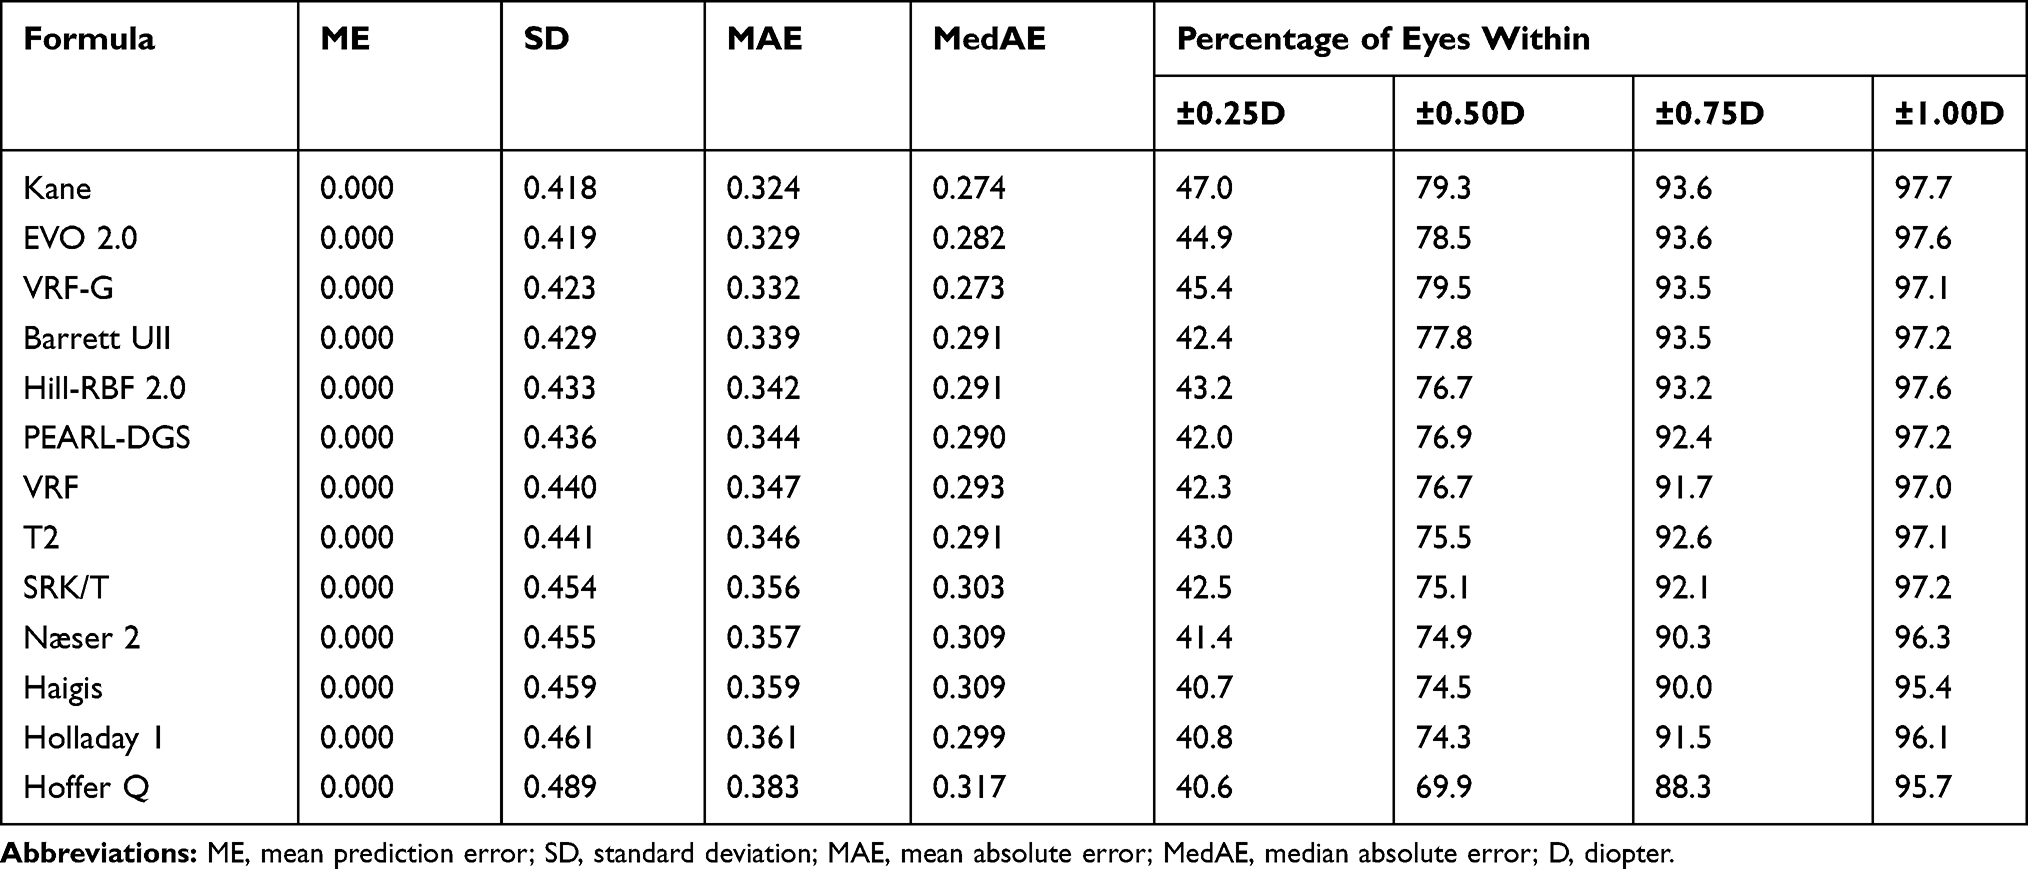 |
Table 2 Refractive Outcomes of Each of the Investigated Formulas, Over the Entire Axial Length Range, Ordered by MAE (n=828) |
Figure 1 displays the proportion of eyes within a prediction error of ±0.25D, ±0.50D, ±0.75D and ±1.00D, which were statistically different among the investigated formulas (p=0.001 for ±0.25D and p<0.001 for the remaining). Every formula, except Næser 2, Haigis, Holladay 1 and Hoffer Q had a percentage of eyes within ±0.50D higher than 75%.
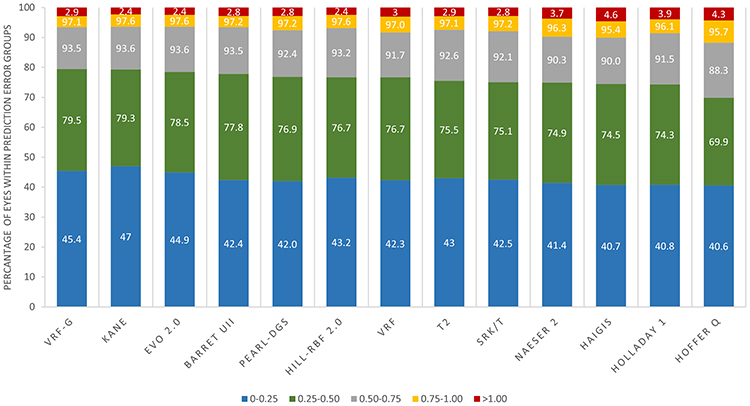 |
Figure 1 Stacked histogram comparing the percentages of eyes within ±0.25D, ±0.50D, ±0.75D and ±1.00D of prediction error. Formulas are ranked according to the higher percentage of eyes within ±0.50D. |
The Kane formula had a higher percentage of eyes within ±0.25D compared to the Holladay 1, Haigis and Hoffer Q formulas (p<0.05). The Hoffer Q formula had the lowest percentage of eyes within ±0.50D, being significantly lower than all other formulas (p<0.05), except Holladay 1. Kane and VRF-G also had a significantly higher percentage of eyes within ±0.50D than Holladay 1, Næser 2 and Haigis (p<0.05). The T2 also had significantly better percentages than the Haigis formula (p=0.002).
Regarding the proportion of eyes within ±0.75D, the Hoffer Q formula had a significantly lower outcome compared to all other formulas except Haigis and Næser 2. Moreover, Kane, EVO 2.0, VRF-G, Barrett UII and Hill-RBF 2.0 formulas produced a higher percentage compared to Næser 2 and Haigis (p<0.05). Næser 2’s percentage was inferior compared to SRK/T (p=0.006).
With respect to the proportion of eyes within ±1.00D, Haigis had a significantly lower percentage than all other formulas (p<0.05), except for VRF, Hoffer Q and Næser 2. Hoffer Q also had a lower percentage compared to Kane, EVO 2.0 and Hill-RBF 2.0 (p<0.05).
Globally, the Kane formula had the lowest SD, MAE, and the highest percentage of eyes within ±0.25D and ±0.75D. VRF-G formula produced the lowest MedAE and the highest percentage of eyes within ±0.50D. Kane (3.3%), followed by EVO 2.0 and Hill-RBF 2.0 (3.4% for both) had the lowest risk of a refractive surprise (refractive error greater than 1.00D).
Formulas Accuracy According to the Axial Length
In all axial length subgroups, a statistically significant differences between formulas absolute errors were found (p<0.001) – each formula results are shown in Table 3.
 |
Table 3 Mean Absolute Error of Each Formula by Axial Length Group |
In short eyes (n=82), Hoffer Q produced a higher absolute error when compared to VRF-G, EVO 2.0, Kane and VRF (p<0.001). In medium eyes (n=695), Kane and EVO 2.0 were more accurate than Haigis and Næser 2 (p<0.001). Moreover, the Kane formula absolute error was also significantly lower than the MAE of SRK/T, Hoffer Q and VRF.
Finally, in long eyes (n=51), Hoffer Q and Holladay 1 performance was worse than any other formulas (p<0.05).
For all AL subgroups, Kane, EVO 2.0 and VRF-G formulas had the most accurate performances.
Figure 2 presents a smooth-line graph representing the mean prediction error of each formula according to the AL. The graph reveals a tendency for a myopic shift in short eyes and a more pronounced hyperopic shift in long eyes. Kane, EVO 2.0, VRF-G and Hill-RBF 2.0 formulas did not present a mean prediction error significantly different from zero across the entire AL range. Interestingly, despite not reaching the most accurate absolute errors among all formulas, Næser 2 also did not have a ME significantly different from zero, independent of the AL range.
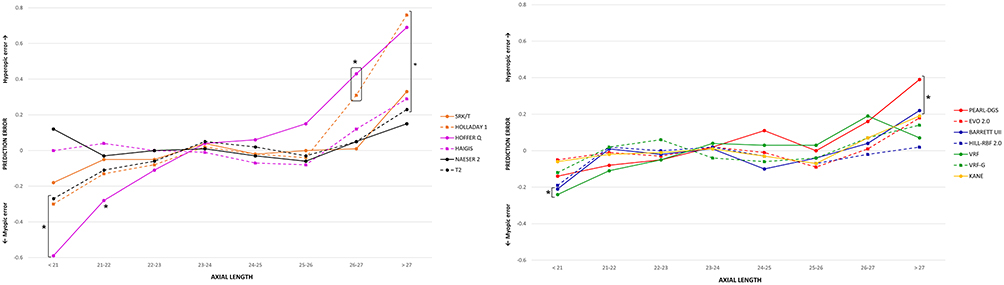 |
Figure 2 Mean Arithmetic Prediction Error (in diopters) of each formula versus axial length (in millimetres). *p<0.05 – one sample t-test/wilcoxon signed-rank test. |
Discussion
Our study evaluated the accuracy of new-generation formulas along with the well validated vergence-based formulas, using one single IOL model AcrySof SN60WF (Alcon Laboratories, Geneva, Switzerland). To the best of our knowledge this is the first clinical study evaluating some of these new formulas (EVO 2.0 and PEARL-DGS) using data obtained from an OLCR-biometer (Lenstar LS900). Furthermore, we report the first results of a newly developed, unpublished formula – VRF-G.
Overall, the Kane and VRF-G formulas presented the most accurate outcomes. The Kane formula had the lowest SD and MAE and the highest percentage of eyes within ±1.00D. On the other hand, VRF-G formula revealed the lowest MedAE and the highest percentage of eyes within ±0.50D. Regarding short eyes, VRF-G presented the lowest MAE and in medium and long eyes Kane obtained the most accurate results.
Regarding the Kane formula, these results are in agreement with recently published literature,4,5,9 independent of OLCR or PCI biometers. With new SS-OCT biometers, similar results were also reported.6–8 With respect with VRF-G formula, it is a newly developed formula based on theoretical optics with regression and ray-tracing components. We are unable to discuss the results due to lack of literature. However, based on our outcomes, both the Kane and VRF-G formulas are shown to be promising formulas.
EVO formula, in its earlier version, had relatively more myopic and hyperopic outcomes in short and long eyes.3 However, our results suggest that with an OLCR biometer, the improved 2.0 version is considerably more accurate, confirming reported outcomes by authors who used other biometer technologies.6–8 In fact, it had the second lowest MAE for all AL subgroups, revealing its regularity across the entire AL range.
Hill-RBF 2.0 showed consistent results across the entire set of eyes (fourth lowest MAE and fifth lowest MedAE) and after AL subgroup analysis, confirming an improvement with this second version.4,5,9 PEARL-DGS also revealed an overall good result, but it was not ranked among the best formulas. This may be because it is optimised for values obtained with the IOLMaster700® (Zeiss, Jena, Germany). However, in a recent study using IOLMaster700®6 it had a relatively lower performance compared to the other new generation formulas (Kane, EVO 2.0 and Hill-RBF 2.0) and Barrett UII, which are in agreement with our findings. This performance may be explained by its hyperopic tendency in long eyes.
Before the introduction of the most recent formulas, Barrett UII was shown to be the best-performing formula.3,15,22 In our study, the Barrett UII remained one of the most accurate formulas. Its accuracy was not statistically different than any of the newer formulas, confirming that it continues to be an accurate and good choice for IOL power selection. However, attention must be paid in short eyes in which the formula tends to have relatively poorer performance, based on our results, which is corroborated by some published literature.5,9
The T2 formula was developed as an improvement to the SRK/T formula. Despite revealing better results than SRK/T, the improvement was not statistically significant, and the formula did not perform as well as other modern formulas, in agreement with a recently published study.6 The VRF formula results were similar to those obtained with the T2 formula. There are some conflicting results about which one of these two formulas perform better7,8,18 – differences in published outcomes may be explained by differences in biometers used. The thick-lens vergence formula Næser 2 results were not among the best, in agreement with Savini et al7 results.
Finally, considering mean arithmetic prediction error behaviour according to the AL, our drawn graph revealed a significant hyperopic shift of the Hoffer Q, Holladay 1 (as expected3) and PEARL-DGS in long eyes. Also, as Melles R et al3 reported, the Hoffer Q is the formula more negatively influenced by AL variance. In contrast, Kane, VRF-G, EVO 2.0, Hill-RBF 2.0 and Næser 2 formulas did not present a mean prediction error significantly different from zero across the entire AL range. We are unable to discuss this last result due to the lack of published literature.
Our study limitations include its retrospective design, similar to most studies related to IOL formulas assessment. Moreover, a 4 m distance was used for manifest refraction which influence formulas constants values, being higher than usually reported. This methodology was consistently used in every patient and therefore does not influence formulas comparison. The inclusion of data from different surgeons may also introduce bias. However, it allows us to more accurately represent a real-world scenario and support a greater generalization of the results. Despite its limitations, this study followed the strict recommended criteria for IOL formula studies based on published literature.10,19,21
Analysing our data, we conclude that newly introduced formulas, along with refined surgical techniques and improved intraocular lenses, may help us achieve better refractive outcomes after cataract surgery. These new and accurate formulas ideally should be included in the software of biometers in the future to avoid transcription errors and allow improved refractive outcomes. One of the biggest challenges for IOL formulas is to have lower variance in accuracy, even in extreme eyes, delivering more reliable and predictable results. The Kane, EVO 2.0 and VRF-G formulas are promising candidates to fulfil these goals.
Data Sharing Statement
Data are available on reasonable request (biometric measurements, implanted IOL power, postoperative refraction, prediction error by each formula) from Diogo Hipólito-Fernandes, MD ([email protected]).
Acknowledgments
To Graham Barrett, FRANZCO, Jack Kane, MD and Guillaume Debellamanière, MD, who independently analysed our data and provided optimised constants. To Carlos Batalha, MD for the technical assistance regarding biometric measurements.
Author Contributions
All authors contributed to data analysis, drafting or revising the article, have agreed on the journal to which the article will be submitted, gave final approval of the version to be published, and agree to be accountable for all aspects of the work.
Funding
No funding or grant support.
Disclosure
Dr. Oleksiy Voytsekhivskyy reports the following patents issued: PU№101404 and PU№109842; and is the inventor and exclusive owner of the VRF and VRF-G formulas. Both formulas are the intellectual property of the doctor Voytsekhivskyy. Dr. Oleksiy Voytsekhivskyy has a patent on the method of estimation of postoperative lens position (ELP) and the calculation of its optical power and is the author and copyright holder of a computer program called ViOL Commander version 2.0.0.0 (V/B/C Systems, Kyiv, Ukraine) for PC. Dr. Tun Kuan Yeo is the creator of the EVO 2.0 formula. The following authors have no financial disclosures: Diogo Hipólito-Fernandes, Maria Elisa Luís, Pedro Gil, Vitor Maduro, João Feijão, Nuno Alves. The authors report no other potential conflicts of interest for this work.
References
1. Fedorov SN, Kolinko AIKA. [Estimation of optical power of the intraocular lens] [Russian]. Vestn Oftalmol. 1967;80:27–31.
2. Koch DD, Hill W, Abulafia A, Wang L. Pursuing perfection in intraocular lens calculations: I. Logical approach for classifying IOL calculation formulas. J Cataract Refract Surg. 2017;43(6):717–718. doi:10.1016/j.jcrs.2017.06.006
3. Melles RB, Holladay JT, Chang WJ. Accuracy of Intraocular Lens Calculation Formulas. Ophthalmology. 2018;125(2):169–178. doi:10.1016/j.ophtha.2017.08.027
4. Melles RB, Kane JX, Olsen T, Chang WJ. Update on Intraocular Lens Calculation Formulas. Ophthalmology. 2019;126(9):1334–1335. doi:10.1016/j.ophtha.2019.04.011
5. Darcy K, Gunn D, Tavassoli S, Sparrow J, Kane JX. Assessment of the accuracy of new and updated intraocular lens power calculation formulas in 10 930 eyes from the UK National Health Service. J Cataract Refract Surg. 2020;46(1):2–7. doi:10.1016/j.jcrs.2019.08.014
6. Cheng H, Kane JX, Liu L, Li J, Cheng B, Wu M. Refractive Predictability Using the IOLMaster 700 and Artificial Intelligence–Based IOL Power Formulas Compared to Standard Formulas. J Refract Surg. 2020;36(7):466–472. doi:10.3928/1081597X-20200514-02
7. Savini G, Hoffer KJ, Balducci N, Barboni P, Schiano-Lomoriello D. Comparison of formula accuracy for intraocular lens power calculation based on measurements by a swept-source optical coherence tomography optical biometer. J Cataract Refract Surg. 2020;46(1):27–33. doi:10.1016/j.jcrs.2019.08.044
8. Savini G, Di Maita M, Hoffer KJ, et al. Comparison of 13 formulas for IOL power calculation with measurements from partial coherence interferometry. Br J Ophthalmol. 2020:1–6. doi:10.1136/bjophthalmol-2020-316193
9. Connell BJ, Kane JX. Comparison of the Kane formula with existing formulas for intraocular lens power selection. BMJ Open Ophthalmology. 2019;4(1):1–6. doi:10.1136/bmjophth-2018-000251
10. Hoffer KJ, Aramberri J, Haigis W, et al. Protocols for studies of intraocular lens formula accuracy. Am J Ophthalmol. 2015;160(3):403–405.e1. doi:10.1016/j.ajo.2015.05.029
11. Haigis W, Lege B, Miller N, Schneider B. Comparison of immersion ultrasound biometry and partial coherence interferometry for intraocular lens calculation according to Haigis. Graefe’s Arch Clin Exp Ophthalmol. 2000;238(9):765–773. doi:10.1007/s004170000188
12. Hoffer KJ. The Hoffer Q formula: A comparison of theoretic and regression formulas. J Cataract Refract Surg. 1993;19(6):700–712. doi:10.1016/S0886-3350(13)80338-0
13. Holladay JT, Musgrove KH, Prager TC, Lewis JW, Chandler TY, Ruiz RS. A three-part system for refining intraocular lens power calculations. J Cataract Refract Surg. 1988;14(1):17–24. doi:10.1016/S0886-3350(88)80059-2
14. Retzlaff JA, Sanders DR, Kraff MC. Development of the SRK/T intraocular lens implant power calculation formula. J Cataract Refract Surg. 1990;16(3):333–340. doi:10.1016/S0886-3350(13)80705-5
15. Kane JX, Van Heerden A, Atik A, Petsoglou C. Intraocular lens power formula accuracy: comparison of 7 formulas. J Cataract Refract Surg. 2016;42(10):1490–1500. doi:10.1016/j.jcrs.2016.07.021
16. Næser K, Savini G. Accuracy of thick-lens intraocular lens power calculation based on cutting-card or calculated data for lens architecture. J Cataract Refract Surg. 2019;45(10):1422–1429. doi:10.1016/j.jcrs.2019.05.021
17. Sheard RM, Smith GT, Cooke DL. Improving the prediction accuracy of the SRK/T formula: the T2 formula. J Cataract Refract Surg. 2010;36(11):1829–1834. doi:10.1016/j.jcrs.2010.05.031
18. Voytsekhivskyy OV. Development and Clinical Accuracy of a New Intraocular Lens Power Formula (VRF) Compared to Other Formulas. Am J Ophthalmol. 2018;185:56–67. doi:10.1016/j.ajo.2017.10.020
19. Hoffer KJ, Savini G. Update on Intraocular Lens Power Calculation Study Protocols. Ophthalmology. 2020. doi:10.1016/j.ophtha.2020.07.005
20. Wang L, Koch DD, Hill W, Abulafia A. Pursuing perfection in intraocular lens calculations: III. Criteria for analyzing outcomes. J Cataract Refract Surg. 2017;43(8):999–1002. doi:10.1016/j.jcrs.2017.08.003
21. Aristodemou P, Knox Cartwright NE, Sparrow JM, Johnston RL. Statistical analysis for studies of intraocular lens formula accuracy. Am J Ophthalmol. 2015;160(5):1085–1086. doi:10.1016/j.ajo.2015.08.010
22. Cooke DL, Cooke TL. Comparison of 9 intraocular lens power calculation formulas. J Cataract Refract Surg. 2016;42(8):1157–1164. doi:10.1016/j.jcrs.2016.06.029
23. Barrett GD Barrett universal ii formula. singapore, asia-pacific association of cataract and refractive surgeons. Available from: https://www.apacrs.org/barrett_universal2.
24. Hill WE Hill-RBF calculator version 2.0. Available from: https://rbfcalculator.com.
25. Kane K. Kane Formula. Available from https://www.iolformula.com.
26. Evo YT Formula calculator version 2.0. Available from: https://www.evoiolcalculator.com.
27. Debellemanière G, Gatinel D, Saad A, PEARL-DGS Calculator. Available from https://iolsolver.com.
 © 2020 The Author(s). This work is published and licensed by Dove Medical Press Limited. The
full terms of this license are available at https://www.dovepress.com/terms
and incorporate the Creative Commons Attribution
- Non Commercial (unported, 3.0) License.
By accessing the work you hereby accept the Terms. Non-commercial uses of the work are permitted
without any further permission from Dove Medical Press Limited, provided the work is properly
attributed. For permission for commercial use of this work, please see paragraphs 4.2 and 5 of our Terms.
© 2020 The Author(s). This work is published and licensed by Dove Medical Press Limited. The
full terms of this license are available at https://www.dovepress.com/terms
and incorporate the Creative Commons Attribution
- Non Commercial (unported, 3.0) License.
By accessing the work you hereby accept the Terms. Non-commercial uses of the work are permitted
without any further permission from Dove Medical Press Limited, provided the work is properly
attributed. For permission for commercial use of this work, please see paragraphs 4.2 and 5 of our Terms.