Back to Journals » Clinical Ophthalmology » Volume 11
Vitreoretinal interface abnormalities in diabetic macular edema and effectiveness of anti-VEGF therapy: an optical coherence tomography study
Authors Kulikov AN, Sosnovskii SV, Berezin RD ![]() , Maltsev DS
, Maltsev DS ![]() , Oskanov DH, Gribanov NA
, Oskanov DH, Gribanov NA
Received 11 July 2017
Accepted for publication 5 October 2017
Published 14 November 2017 Volume 2017:11 Pages 1995—2002
DOI https://doi.org/10.2147/OPTH.S146019
Checked for plagiarism Yes
Review by Single anonymous peer review
Peer reviewer comments 2
Editor who approved publication: Dr Scott Fraser
Alexei N Kulikov, Sergei V Sosnovskii, Roman D Berezin, Dmitrii S Maltsev, Dzhambulat H Oskanov, Nikolai A Gribanov
Department of Ophthalmology, Military Medical Academy, St Petersburg, Russia
Purpose: To study vitreoretinal interface (VRI) abnormalities in diabetic macular edema (DME) and the influence of these on the effectiveness of intravitreal anti-vascular endothelial growth factor (VEGF) therapy.
Methods: VRI status and central retinal thickness (CRT) were evaluated using line and 3D-reference scans obtained using spectral domain-optical coherence tomography RTVue-100 before and 1 month after intravitreal anti-VEGF injection (IVI). VRI status was categorized into five subgroups: normal VRI, retinal surface wrinkling associated with the eccentric epiretinal membrane (ERM), ERM involving the macular center, vitreomacular adhesion (VMA), and vitreomacular traction (VMT).
Results: A total of 105 eyes of 89 patients were included in the study. One month after IVI, the mean change of CRT in normal VRI eyes and eyes with VRI abnormalities was –128.0±144.7 µm and –53.0±96.4 µm (p<0.05), respectively. The mean change of CRT 1 month after IVI in each subgroup with VRI abnormalities, apart from the subgroup with retinal wrinkling associated with eccentric ERM, was statistically significantly lower compared to the eyes with normal VRI (p<0.05).
Conclusion: VRI abnormalities significantly reduce the effectiveness of intravitreal anti-VEGF therapy in eyes with DME. Eyes with noticeable changes of VRI, including ERM involving the macular center, VMA, and VMT have a poorer response to anti-VEGF therapy compared to eyes with normal VRI or eccentric ERM.
Keywords: diabetic macular edema, anti-VEGF, optical coherence tomography, epiretinal membrane, vitreomacular adhesion, vitreomacular traction
Introduction
Diabetic macular edema (DME) is the leading cause of deteriorated visual acuity in patients with diabetes.1,2 However, two recent innovations in ophthalmology have revolutionized DME management. Optical coherence tomography (OCT) allows for the “in vivo” evaluation of microstructural vitreoretinal interface (VRI) changes.3–5 The discovery of vascular endothelial growth factor (VEGF) and the subsequent development of new agents targeting VEGF pathway have made a pathogenesis-oriented approach possible for DME therapy.6–9 Currently, intravitreal anti-VEGF injections (IVIs) are considered to be the first-line therapy for treatment of DME.10–15 However, anti-VEGF therapy alone is not sufficient in controlling macular edema in all cases. Variable outcomes among the DME patients treated with anti-VEGF reflect the multifactorial pathogenesis of the disease, where not only VEGF but many other factors also play an important role. A number of spectral domain-OCT (SD-OCT)–based studies have shown the importance of VRI changes in the development of a macular hole, epiretinal membrane (ERM), and vitreomacular traction (VMT) syndrome.16–20 Currently, the range of VRI abnormalities detected by SD-OCT includes ERM, VMT, vitreomacular adhesion (VMA), macular cysts, paravascular cysts, full thickness macular hole, and lamellar macular hole.21,22 The prevalence of VRI abnormalities reported in the literature ranges from 6.5% to 75% depending on definitions and methods used.23–28
In this article, we studied VRI abnormalities in DME and the effect of these on the effectiveness of anti-VEGF therapy.
Materials and methods
This was a retrospective case–control study. The study was approved by the Ethics Committee of Military Medical Academy and followed the tenets of the Declaration of Helsinki. All patients gave written informed consent for both participation in the study and for anti-VEGF therapy.
Only patients with DME (defined as central retinal subfield thickening >250 μm based on RTVue-100 [Optovue Inc, Fremont, CA, USA] SD-OCT) and well-controlled diabetes (defined as hemoglobin A1c [HbA1c] <7.5%) who received at least three consecutive injections of intravitreal anti-VEGF agents on a monthly basis were included in the study.
Exclusion criteria included tractional retinal detachment; full-thickness macular hole; ischemic maculopathy (demonstrated by fluorescein angiography); OCT strength signal index <50.0; previous vitrectomy, intravitreal steroids, laser treatment, or any other intraocular surgery during the study as well as any coexisting retinal diseases (including retinal vein occlusion and uveitis).
After comprehensive ophthalmic examination, including measurement of the best-corrected visual acuity (BCVA) and fundus biomicroscopy with a noncontact lens, all patients underwent an OCT examination for analysis of the VRI. The BCVA was assessed using a Snellen chart. BCVA values were converted to logMAR for statistical analysis. Patients were followed-up on a monthly basis. BCVA measurement and OCT examination were repeated at every visit.
Patients were eligible for anti-VEGF treatment if central retinal thickness (CRT) >250 μm at initial visit or during the follow-up. The administration of 0.3 mg ranibizumab was performed following topical anesthesia and povidone–iodine eye cleansing.
Spectral domain optical coherence tomography
All OCT examinations were performed with an SD-OCT RTVue-100 using a standardized protocol. For each eye, a retinal cross-sectional image and a three-dimensional macular scan pattern centered on the fovea were performed. Retinal cross-sectional images were obtained with line scan pattern (16,384 A-scans averaged to a single scan image), 6 mm in length, with enhanced depth imaging. Three-dimensional macular scans were obtained using the 3D-reference scan pattern, which was composed of 141 7-mm B-scans each consisting of 385 A-scans. For all study eyes, CRT value, defined as the average retinal thickness (distance from the inner limiting membrane to the retinal pigment epithelium) within a central subfield, was obtained with EMM5 scan pattern. VRI changes within the central subfield were evaluated on cross-sectional image centered on the fovea. VRI changes outside the central subfield were evaluated on each individual scan of the 3D-reference scan pattern.
In VRI abnormalities, group changes of VRI were categorized into four subgroups: 1) retinal surface wrinkling with the presence of eccentric ERM, 2) ERM involving the macular center, 3) VMA, 4) VMT (Figure 1). Our classification scheme for VRI abnormalities was based on previously published classifications.22,27 Normal VRI (control group) was defined as retinal thickening with intraretinal cystoid spaces without retinal surface wrinkling, ERM, or vitreoretinal traction/adhesion.
 | Figure 1 Representative examples of cross-sectional optical coherence tomography scans from eyes with diabetic macular edema with a normal vitreoretinal interface and various vitreoretinal interface abnormalities. |
VMA was considered present when the posterior hyaloid had partially detached from the inner retinal surface but remained attached within a 3-mm radius of the fovea without any changes in the retinal contour.22 If a partial adhesion of posterior hyaloid within a 3-mm radius of the fovea was present in combination with resulting changes in the retinal contour, the eye was considered to have VMT.22,29 VMT syndrome was considered present when the posterior hyaloid had partially detached from the inner retinal surface but remained adhered in the fovea with symptomatic intraretinal structural changes of the foveal retina (distortion of the foveal surface, macular schisis, and lamellar macular hole).22,29 ERM was defined as a partially adhered hyperreflective band on the inner retinal surface with corrugation within the inner retinal layers. Additionally, in cases of eccentric ERM and ERM involving the macular center, the location of ERM was evaluated by OCT en face imaging (Figure 2).
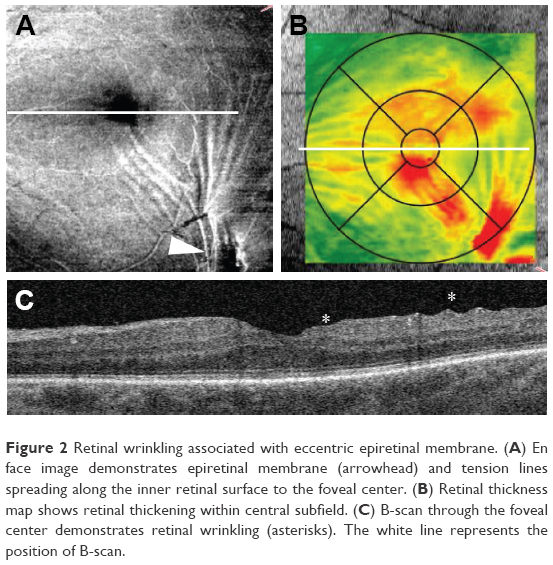 | Figure 2 Retinal wrinkling associated with eccentric epiretinal membrane. (A) En face image demonstrates epiretinal membrane (arrowhead) and tension lines spreading along the inner retinal surface to the foveal center. (B) Retinal thickness map shows retinal thickening within central subfield. (C) B-scan through the foveal center demonstrates retinal wrinkling (asterisks). The white line represents the position of B-scan. |
The presence or absence of VRI abnormalities as well as baseline CRT and CRT at 1 month after IVI were evaluated for each individual IVI. In cases where the patient received more than one IVI, the data for each individual injection were included in the analysis.
Primary and secondary outcome measures
Primary outcome measures were the presence or absence of VRI abnormalities: retinal wrinkling associated with eccentric ERM, ERM involving the macular center, VMA, and VMT. Secondary outcome measure was the change in CRT 1 month after IVI compared to baseline.
Statistical analysis
All data were collected and analyzed by Statistica 10.0 (StatSoft, Inc., Tulsa, OK). One-way analysis of variance test with Bonferroni correction for multiple comparisons was used to compare baseline variables between the study groups. The chi-square testing (two-tailed Fisher’s exact test) was used to compare categorical variables between the groups. Differences in CRT measurements between eyes before and after anti-VEGF injections were analyzed with the Mann–Whitney U test. A p<0.05 was significant. The values are expressed as the mean ± standard deviation.
Results
Medical records and OCT images from 120 eyes of 89 patients were retrospectively reviewed from February 2011 to August 2016. One hundred and five eyes of 72 patients fulfilled the inclusion criteria and were included in the study. Patients were aged from 30 to 97 years (average, 66.3±13.5 years). Of the 72 patients, 40 (55.5%) were men and 32 (44.5%) were women. The mean duration of DME was 17.3±22.8 months. Patients included in the study received a mean of 1.5 (range, 1–3) anti-VEGF treatments per eye and in total 162 individual IVIs were performed during the study. The mean follow-up was 1.7±1.1 (range, 1–4) months.
The mean baseline BCVA was 0.71±0.45 logMAR. One month after IVI, the mean BCVA changed to 0.70±0.50 logMAR (p=0.56) but this change was not statistically significant. Mean CRT at baseline and 1 month after IVI was 553.7±153.7 μm and 451.5±123.4 μm, respectively (p<0.05). At baseline, 59 eyes (56%) and 46 eyes (44%) demonstrated normal VRI and VRI abnormalities, respectively (Table 1). During the study period, VRI abnormalities were noted in 77 of 162 individual IVIs (47.7%). In normal VRI eyes and eyes with VRI abnormalities, mean baseline CRT was 560.0±158.6 μm and 521.8±135.8 μm (p=0.11), respectively. One month after IVI, the mean CRT in normal VRI eyes and eyes with VRI abnormalities decreased significantly to 432.0±113.5 μm (p<0.001) and 468.8±110.6 μm (p<0.05), respectively (Figure 3). After IVI, the mean change of CRT in normal VRI eyes and eyes with VRI abnormalities was −128.0±144.7 μm and −53.0±96.4 μm, respectively (Figure 4).
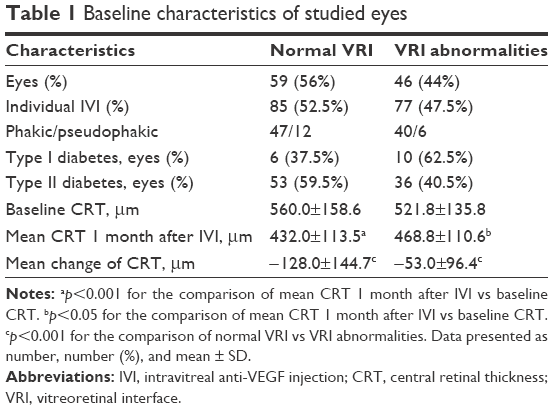 | Table 1 Baseline characteristics of studied eyes |
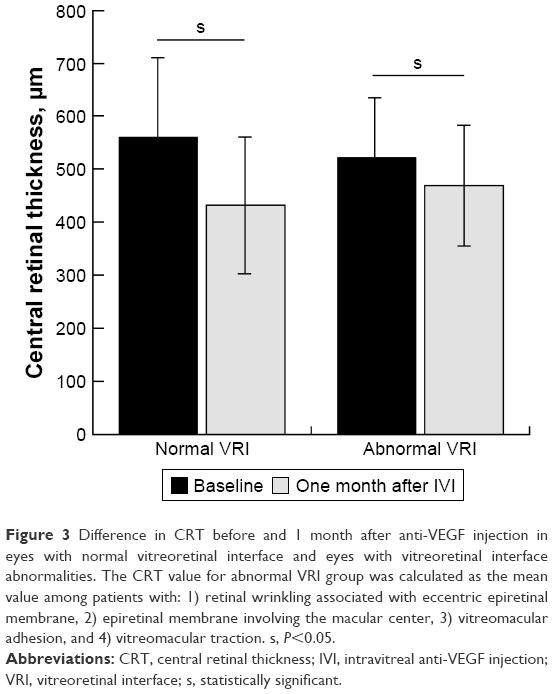 | Figure 3 Difference in CRT before and 1 month after anti-VEGF injection in eyes with normal vitreoretinal interface and eyes with vitreoretinal interface abnormalities. The CRT value for abnormal VRI group was calculated as the mean value among patients with: 1) retinal wrinkling associated with eccentric epiretinal membrane, 2) epiretinal membrane involving the macular center, 3) vitreomacular adhesion, and 4) vitreomacular traction. s, P<0.05. |
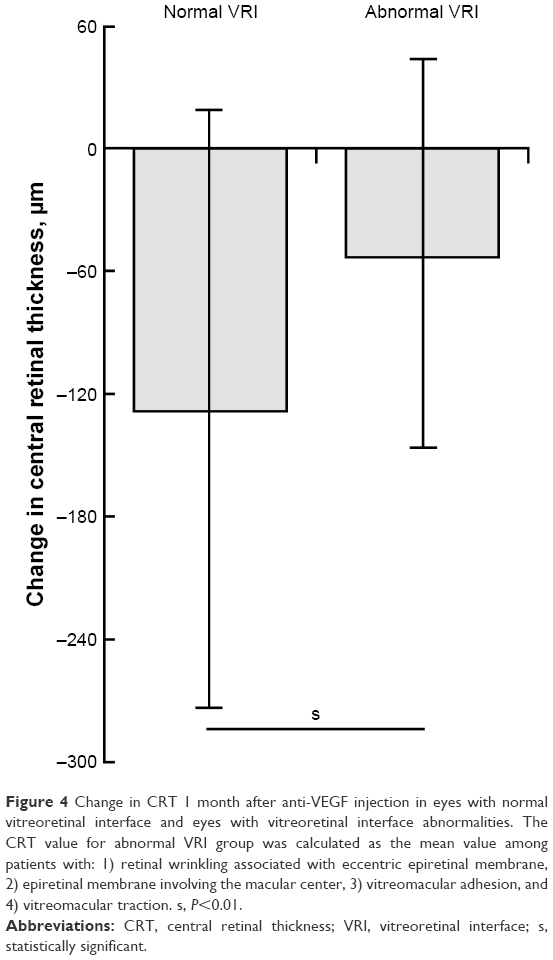 | Figure 4 Change in CRT 1 month after anti-VEGF injection in eyes with normal vitreoretinal interface and eyes with vitreoretinal interface abnormalities. The CRT value for abnormal VRI group was calculated as the mean value among patients with: 1) retinal wrinkling associated with eccentric epiretinal membrane, 2) epiretinal membrane involving the macular center, 3) vitreomacular adhesion, and 4) vitreomacular traction. s, P<0.01. |
At baseline, retinal wrinkling was identified in six (5.7%) eyes (13.0% of the eyes with VRI abnormalities). In all eyes with retinal wrinkling, en face imaging revealed eccentric ERM. When the prevalence of an ERM was analyzed using all 105 eyes at all 162 individual IVIs, an ERM was detected in 10 (6.2%) of those individual IVIs (13.0% of individual IVIs in eyes with VRI abnormalities), with 152 individual IVIs free of eccentric ERM. At baseline, ERM was identified in 13 (12.4%) eyes (28.2% of the eyes with VRI abnormalities). The presence of an ERM was analyzed using all 105 eyes at all 162 individual IVIs. An ERM was found in 17 (10.5%) of those individual IVIs (28.2% of individual IVIs in eyes with VRI abnormalities), with 145 individual IVIs free of ERM. At baseline, VMA was identified in 17 (16.2%) eyes (37.0% of the eyes with VRI abnormalities). A VMA was found in 37 (22.8%) of 162 individual IVIs (48.0% of individual IVIs in eyes with VRI abnormalities), with 125 individual IVIs free of ERM. At baseline, VMT was identified in 10 (9.5%) eyes (21.7% of the eyes with VRI abnormalities). A VMT was found in 14 (8.6%) of 162 individual IVIs (18.2% of individual IVIs in eyes with VRI abnormalities), with 148 individual IVIs free of ERM. Table 2 shows the baseline characteristics of abnormal VRI subgroups.
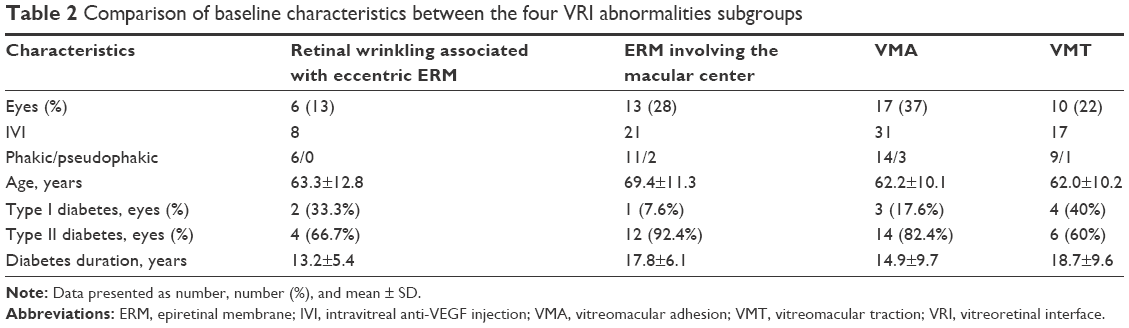 | Table 2 Comparison of baseline characteristics between the four VRI abnormalities subgroups |
One month after IVI, the CRT showed a statistically insignificant decrease in all abnormal VRI subgroups (Table 3). In eyes with retinal wrinkling associated with eccentric ERM, CRT decreased from 655.0±183.1 μm to 535.5±139.9 μm (p>0.05). In eyes with center involving ERM CRT decreased from 516.7±160.2 μm to 451.7±124.0 μm (p>0.05). In eyes with VMA and VMT, CRT decreased from 507.6±105.7 μm to 463.2±94.3 μm and from 468.6±94.6 μm to 450.7±111.7 μm (p>0.05), respectively (Figure 5). The mean change of CRT 1 month after IVI in eyes with retinal wrinkling associated with eccentric ERM, eyes with center involving ERM, eyes with VMA, and eyes with VMT was −119.5±131.0 μm, −65.0±87.4 μm, −44.3±85.7 μm, and −17.9±89.7 μm, respectively. The mean change of CRT 1 month after IVI in each subgroup with VRI abnormalities, apart from the subgroup with retinal wrinkling associated with eccentric ERM, was statistically significantly lower compared to the eyes with normal VRI (p<0.05) (Figure 6).
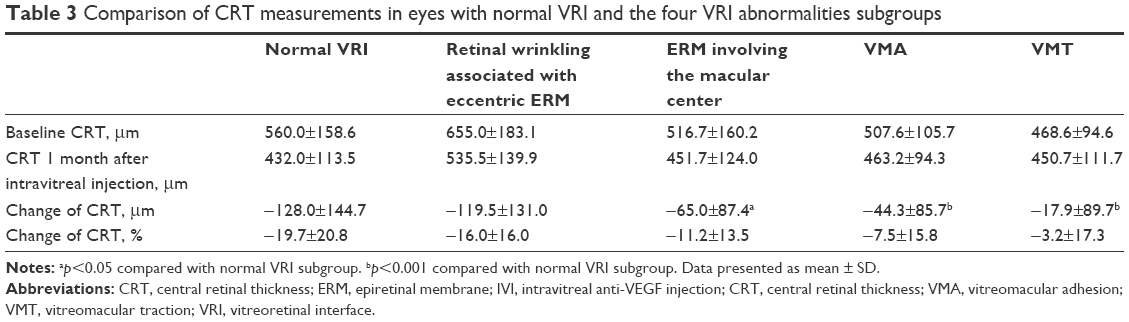 | Table 3 Comparison of CRT measurements in eyes with normal VRI and the four VRI abnormalities subgroups |
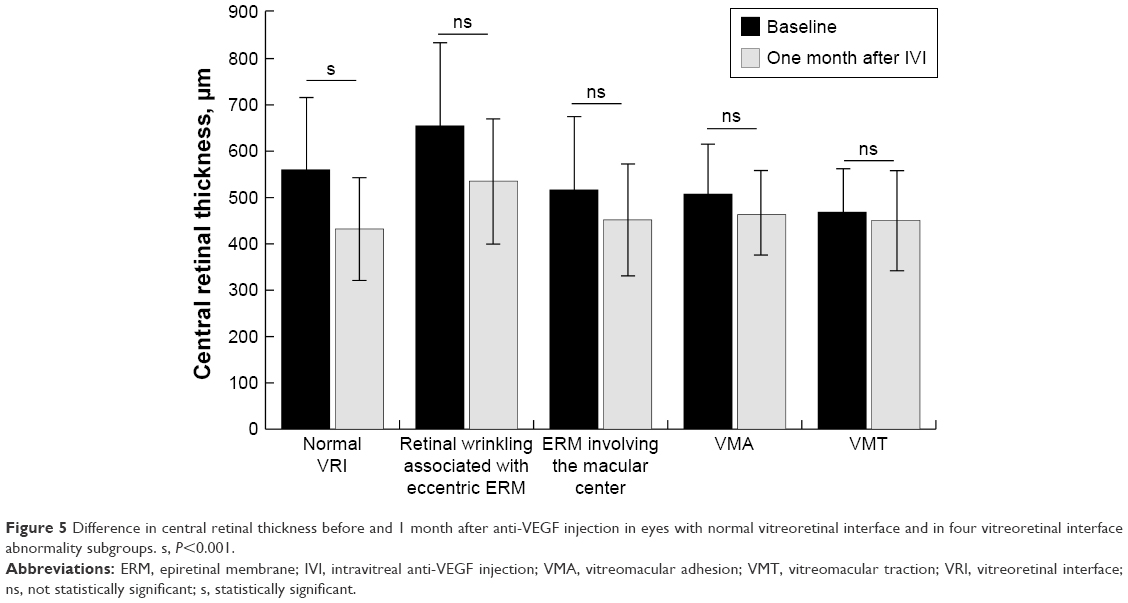 | Figure 5 Difference in central retinal thickness before and 1 month after anti-VEGF injection in eyes with normal vitreoretinal interface and in four vitreoretinal interface abnormality subgroups. s, P<0.001. |
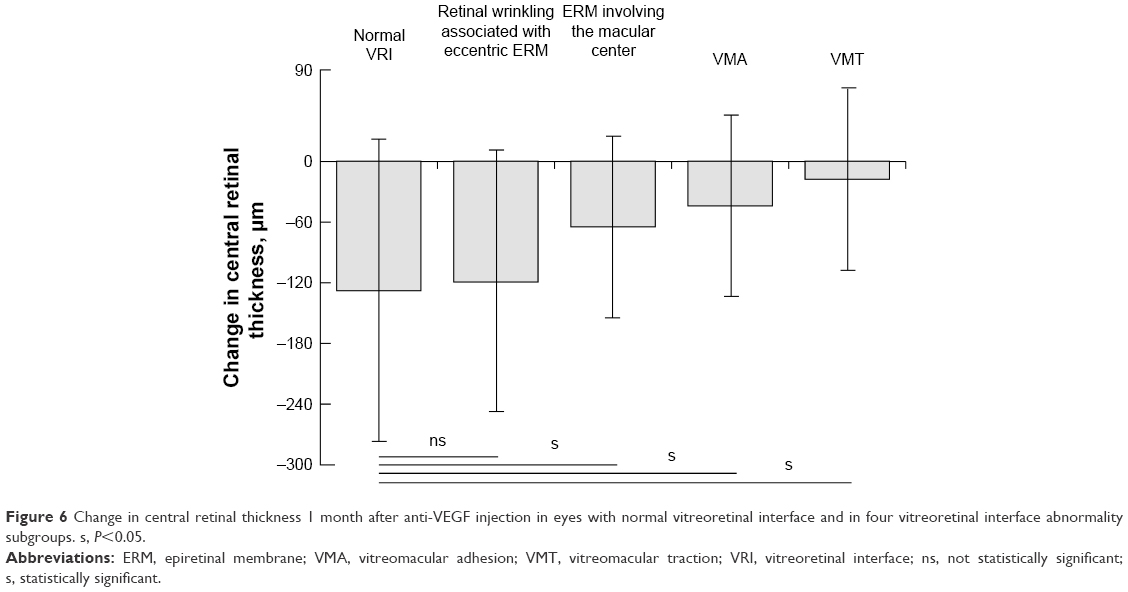 | Figure 6 Change in central retinal thickness 1 month after anti-VEGF injection in eyes with normal vitreoretinal interface and in four vitreoretinal interface abnormality subgroups. s, P<0.05. |
Discussion
IVIs are the standard approach for the treatment of DME. With adequate dosing regimen, anti-VEGF treatment provides a decrease of CRT on OCT and substantial and stable improvement of visual acuity. However, randomized clinical trials were not designed to evaluate the effectiveness of anti-VEGF therapy with regard to VRI abnormalities. At the same time, changes of VRI play an important role in the pathophysiology of macular diseases, including macular hole,16 ERM,17 and VMT18 all of which are associated with an increase in CRT. In contrast to DME, in these conditions, an increase of CRT is caused not by upregulation of VEGF and vascular hyperpermeability, but anteroposterior or tangential tractions which are followed by secondary vascular hyperpermeability and retinal thickening.
We found that anti-VEGF treatment is most effective in eyes without any VRI abnormalities detected by OCT in the border zone between the retina and vitreous. In these eyes, CRT was statistically significantly lower 1 month after IVI compared to baseline value.
The absence of statistically significant differences in baseline CRT between normal VRI eyes and eyes with VRI abnormalities excludes the role of VRI changes as a significant cause of retinal thickening in DME eyes with VRI abnormalities. At the same time, change of CRT 1 month after IVI in normal VRI eyes was statistically significantly higher than that in eyes with VRI abnormalities. This fact proves the inferiority of anti-VEGF therapy for DME eyes associated with VRI abnormalities compared to those with normal VRI.
There was no statistically significant difference in CRT 1 month after IVI compared to baseline for eyes with any subtype of VRI abnormalities. Nevertheless, change of CRT 1 month after IVI in eyes with retinal wrinkling associated with eccentric ERM was found to be not statistically significantly different from that in normal VRI eyes, whereas it was statistically significantly lower in eyes with ERM involving the macular center, VMA, and VMT.
These findings suggest that retinal wrinkling associated with eccentric ERM should be considered a distinct subtype of VRI abnormality. This subtype of VRI abnormality is characterized by wrinkling of retinal surface or retinal plication in the macular center associated with retinal thickening. In a recent study, Wong et al described eccentric ERM and ERM involving the macular center as two distinct clinically significant conditions, but the practical application of such classification was not considered.27 In our study, we showed that the difference between normal VRI and eccentric ERM (as well as the similarity between the latter and other subtypes of abnormal VRI) results from the absence of a statistically significant difference between baseline CRT and CRT 1 month after IVI in eyes with eccentric ERM as was found in eyes with VRI abnormalities but not in eyes with normal VRI. On the other hand, eyes with eccentric ERM did not show a significant difference in CRT change after IVI compared to normal VRI eyes. Therefore, retinal wrinkling associated with eccentric ERM appears to be the mildest abnormal VRI subtype (and the most sensitive to anti-VEGF treatment) among all abnormal VRI subtypes considered in this study.
A possible explanation for retinal wrinkling can be found through analysis of en face OCT images. Using en face imaging, ERM was found outside of the macular center in all eyes with retinal wrinkling. The proliferation of the cellular component leading to progressive contraction of the ERM results in radial tangential traction lines and irregular tension along the inner retinal surface involving the foveal center and appearing as retinal wrinkling. Therefore, even though ERM is absent just above the fovea, tangential traction forces cause distant changes of inner foveolar contour. This suggestion for the cause of retinal wrinkling explains the fact that anti-VEGF effectiveness in terms of retinal thickness varies widely within the subgroup of eyes having eccentric ERM (which includes both eyes with a significant reduction of CRT after IVI and eyes with poor anti-VEGF response). The distance from eccentric ERM to the foveal center might have a correlation with the reduction of retinal thickness following anti-VEGF therapy. For example, far eccentric ERM, despite the association with retinal wrinkling, may contribute less to retinal thickening, compared to parafoveolar, but not center involving ERM. In contrast, parafoveolar ERM may have a relatively stronger mechanical impact on retinal thickening, which results in a decrease of the magnitude of retinal thickness reduction during anti-VEGF therapy. Nevertheless, evidence from additional study is needed to confirm this suggestion.
This study is not without limitations. First, only morphological changes (change in CRT) and not visual acuity were considered as a measure of the effectiveness of treatment, although it should be remembered that the effectiveness of anti-VEGF therapy is not obviously correlated with functional outcome, since the latter can be compromised by persistent structural change in the fovea including ellipsoid zone disruption or ischemic maculopathy. The second limitation of this study relates to its retrospective nature. Third, the size of subgroups with VRI abnormalities was relatively small and not controlled. This fact could partially explain the absence of a statistically significant difference in CRT before and after anti-VEGF treatment in each separate abnormal VRI subgroup while CRT significantly decreased when considering all abnormal VRI subgroups as a whole.
The data from this study may have an impact on clinical practice patterns in DME management and could allow clarification of the optimal intervention in certain naïve, or poor, anti-VEGF response patients with regard to the status of VRI and subtype of VRI abnormality. To begin with, for patients without VRI abnormalities, having the lowest risk for tangential or anteroposterior tractions, the preferred practice pattern may be based on intravitreal anti-VEGF therapy. Second, patients with VRI abnormalities (ERM involving the macular center, VMT, and VMA) which result in significant traction forces, may be recommended for vitrectomy. Last, the choice of treatment for patients with eccentric ERM may depend on the eccentricity of ERM but can be accurately determined after a single IVI. For patients with a poor response after a single IVI, vitrectomy for eccentric ERM might be an effective option.
Conclusion
In this study, we have shown that traction forces play a major role in the pathogenesis of DME and reduce the effectiveness of intravitreal anti-VEGF therapy in eyes with VRI abnormalities. This study also demonstrates the significant variability in response to anti-VEGF therapy among eyes with DME associated with different subtypes of VRI abnormalities. Eyes with noticeable changes of VRI, including ERM involving the macular center, VMT, and VMA, have a poorer response to anti-VEGF therapy compared to eyes with normal VRI or eccentric ERM.
Disclosure
The authors report no conflicts of interest in this work.
References
Musat O, Cernat C, Labib M, et al. Diabetic macular edema. Rom J Ophthalmol. 2015;59(3):133–136. | ||
Zimmet P, Alberti KG, Shaw J. Global and societal implications of the diabetes epidemic. Nature. 2001;414(6865):782–787. | ||
Goebel W, Kretzchmar-Gross T. Retinal thickness in diabetic retinopathy: a study using optical coherence tomography (OCT). Retina. 2002;22(6):759–767. | ||
Hee MR, Izatt JA, Swanson EA, et al. Optical coherence tomography of the human retina. Arch Ophthalmol. 1995;113(3):325–332. | ||
Thomas D, Laidlaw D. OCT vitreoretinal interface patterns. Eye (Lond). 2003;17(4):541–542. | ||
Ferrara N, Henzel WJ. Pituitary follicular cells secrete a novel heparin-binding growth factor specific for vascular endothelial cells. Biochem Biophys Res Commun. 1989;161(2):851–858. | ||
Papadopoulos N, Martin J, Ruan Q, et al. Binding and neutralization of vascular endothelial growth factor (VEGF) and related ligands by VEGF Trap, ranibizumab and bevacizumab. Angiogenesis. 2012;15(2):171–185. | ||
Park SJ, Oh J, Kim YK, et al. Intraocular pharmacokinetics of intravitreal vascular endothelial growth factor-Trap in a rabbit model. Eye (Lond). 2015;29(4):561–568. | ||
Stewart MW. The expanding role of vascular endothelial growth factor inhibitors in ophthalmology. Mayo Clin Proc. 2012;87(1):77–88. | ||
Brown DM, Schmidt-Erfurth U, Do DV, et al. Intravitreal aflibercept for diabetic macular edema: 100-week results from the VISTA and VIVID studies. Ophthalmology. 2015;122(10):2044–2052. | ||
Diabetic Retinopathy Clinical Research Network, Elman MJ, Aiello LP, et al. Randomized trial evaluating ranibizumab plus prompt or deferred laser or triamcinolone plus prompt laser for diabetic macular edema. DRCRNet. Ophthalmology. 2010;117(6):1064–1077. | ||
Googe J, Brucker AJ, Bressler N, et al; Diabetic Retinopathy Clinical Research Network: Randomized trial evaluating short-term effects of intravitreal ranibizumab or triamcinolone acetonide on macular edema after focal/grid laser for diabetic macular edema in eyes also receiving panretinal photocoagulation. Retina. 2011;31(6):1009–1027. | ||
Korobelnik JF, Do DV, Schmidt-Erfurth U, et al. Intravitreal aflibercept for diabetic macular edema. Ophthalmology. 2014;121(11):2247–2254. | ||
Mitchell P, Bandello F, Schmidt-Erfurth U, et al. The RESTORE Study: ranibizumab monotherapy or combined with laser versus laser monotherapy for diabetic macular edema. Ophthalmology. 2011;118(4):615–625. | ||
Wells JA, Glassman AR, Ayala AR, et al. Aflibercept, bevacizumab, or ranibizumab for diabetic macular edema. N Engl J Med. 2015;372(13):1193–1203. | ||
Maier M, Abraham S, Frank C, et al. Therapeutic options in vitreomacular traction with or without a macular hole. Klin Monbl Augenheilkd. 2016;233(5):622–630. | ||
Schumann RG, Gandorfer A, Ziada J, et al. Hyalocytes in idiopathic epiretinal membranes: a correlative light and electron microscopic study. Graefes Arch Clin Exp Ophthalmol. 2014;252(12):1887–1894. | ||
Kozak I, Barteselli G, Sepah YJ, et al. Correlation of vitreomacular traction with foveal thickness, subfoveal choroidal thickness, and vitreomacular/foveal angle. Curr Eye Res. 2017;42(2):297–301. | ||
Ophir A, Martinez MR, Mosqueda P, Trevino A. Vitreous traction and epiretinal membranes in diabetic macular oedema using spectral-domain optical coherence tomography. Eye (Lond). 2010;24(10):1545–1553. | ||
Sonmez K, Capone A Jr, Trese MT, Williams GA. Vitreomacular traction syndrome: impact of anatomical configuration on anatomical and visual outcomes. Retina. 2008;28(9):1207–1214. | ||
Meuer SM, Myers CE, Klein BEK, et al. The epidemiology of vitreoretinal interface abnormalities as detected by SD-OCT: The Beaver Dam Eye Study. Ophthalmology. 2015;122(4):787–795. | ||
Duker JS, Kaiser PK, Binder S, et al. The International Vitreomacular Traction Study Group classification of vitreomacular adhesion, traction, and macular hole. Ophthalmology. 2013;120(12):2611–2619. | ||
Akbar KhI, Mohamed MD, Mann SS, Hysi PG, Laidlaw DA. Prevalence of vitreomacular interface abnormalities on spectral domain optical coherence tomography of patients undergoing macular photocoagulation for centre involving diabetic macular oedema. Br J Ophthalmol. 2015;99(8):1078–1081. | ||
Chang C-K, Cheng C-K, Bai C-H, et al. Development of vitreo macular interface abnormality in patients with diabetic macular edema. Taiwan J Ophthalmol. 2012;2(3):93–98. | ||
Ghazi NG, Ciralsky JB, Shah SM, et al. Optical coherence tomography findings in persistent diabetic macular edema: the vitreomacular interface. Am J Ophthalmol. 2007;144(5):747–754. | ||
Ophir A, Martinez MR. Epiretinal membranes and incomplete posterior vitreous detachment in diabetic macular edema, detected by spectral-domain optical coherence tomography. Invest Ophthalmol Vis Sci. 2011;52(9):6414–6420. | ||
Wong Y, Steel DH, Habib MS, et al. Vitreoretinal interface abnormalities in patients treated with ranibizumab for diabetic macular oedema. Graefes Arch Clin Exp Ophthalmol. 2017;255(4):733–742. | ||
Wu PC, Lai CH, Chen CL, Kuo CN. Optical coherence tomographic patterns in diabetic macula edema can predict the effects of intravitreal bevacizumab injection as primary treatment. J Ocul Pharmacol Ther. 2012;28(1):59–64. | ||
Romano MR, Comune C, Ferrara M, et al. Retinal changes induced by epiretinal tangential forces. J Ophthalmol. 2015;2015:372564. |
 © 2017 The Author(s). This work is published and licensed by Dove Medical Press Limited. The
full terms of this license are available at https://www.dovepress.com/terms
and incorporate the Creative Commons Attribution
- Non Commercial (unported, 3.0) License.
By accessing the work you hereby accept the Terms. Non-commercial uses of the work are permitted
without any further permission from Dove Medical Press Limited, provided the work is properly
attributed. For permission for commercial use of this work, please see paragraphs 4.2 and 5 of our Terms.
© 2017 The Author(s). This work is published and licensed by Dove Medical Press Limited. The
full terms of this license are available at https://www.dovepress.com/terms
and incorporate the Creative Commons Attribution
- Non Commercial (unported, 3.0) License.
By accessing the work you hereby accept the Terms. Non-commercial uses of the work are permitted
without any further permission from Dove Medical Press Limited, provided the work is properly
attributed. For permission for commercial use of this work, please see paragraphs 4.2 and 5 of our Terms.