Back to Journals » Clinical Ophthalmology » Volume 8
Visual field examination using a video projector: comparison with Humphrey perimeter
Authors Brouzas D, Tsapakis S, Nitoda E, Moschos M
Received 14 September 2013
Accepted for publication 1 November 2013
Published 11 March 2014 Volume 2014:8 Pages 523—528
DOI https://doi.org/10.2147/OPTH.S54524
Checked for plagiarism Yes
Review by Single anonymous peer review
Peer reviewer comments 3
Dimitrios Brouzas, Stylianos Tsapakis, Eirini Nitoda, Marilita M Moschos
First Department of Ophthalmology, Medical School, University of Athens, Greece
Purpose: To present a method of visual field examination using a video projector. Also, we compare our results with those of a Humphrey perimeter, which is accepted as standard in automated perimetry.
Materials and methods: Software implementing a full-threshold 4-2-step staircase algorithm for the central 30-2 of the visual field (76 points) has been developed and tested in nine eyes of seven patients using an Epson TW 700 video projector. The results were compared to those obtained from the same patients using the Humphrey perimeter.
Results: High correlation between the video projector visual fields and those of the Humphrey perimeter was found. The point-to-point correlation coefficient ranged from 0.75 to 0.90, with P<0.0001 for each eye.
Conclusion: Visual field examination results using a video projector have high correlation with those of a Humphrey perimeter. The method is possibly suitable for clinical use.
Keywords: visual fields, video projector, computerized perimetry, automated perimetry, visual field software
Introduction
The possibility of using the display of a laptop computer for visual field examination was described by Wu et al in 1991.1 Also, Quigley et al described the use of a computer display as an alternative method for visual field examination for glaucoma screening in 1993.2
Today, there are many psychophysical tests for visual field examination, downloadable from the Internet, using computer displays, such as:
- visual field test – for self-examination over the Internet using a computer (http://testvision.org)
- the Ophthimus system – high-pass resolution perimetry (http://www.visumetrics.com/ophthimus.html)
- motion-detection perimetry of Michael Wall3
- rarebit perimetry using computer graphics on a single display4
- visual field perimetry on a small computer screen5
- visual field testing through the Internet (http://www.keepyoursight.org)
- Peristat – a test for glaucoma self-testing on a computer monitor using the Internet6
- computerized visual field test for children using multiple moving fixation targets.7
The widespread use of visual field testing using a PC-driven display has been limited however, mainly because of the small size of available displays. With the advance of technology, these problems probably will not be an issue. Available displays are constantly increasing in size, but cost is still an issue. The use of visual field examination using a video projector overcomes the size problem of the available displays. Also, the cost is reasonable, and the method has not been proposed and tested so far.
The purpose of our study was to present a method of visual field examination using a video projector, and to compare our results with those of a Humphrey perimeter, which is the standard today in automated perimetry.
Materials and methods
Software implementing a 76-point full-threshold 4-2-step staircase algorithm at the central 30-2 visual field has been developed for the purpose of testing. An Epson (Suwa, Japan) TW 700 video projector with 1,600-lumen nominal output power was used. Screen background was set to 0.25 asb (0.08 Lux) while the maximum luminous stimulus was set at 377 asb (120 Lux). The distance between the video projector and screen was set to 4 m, while the distance of the video projector from the floor was 2.5 m. The maximum video-projector power was 120 Lux, while the minimum was 0.04 Lux on screen, as read on a photometer. The projected stimuli intensity was distributed on a logarithmic scale.
Software features
Software features include:
- a 76-point threshold, 4-2-step staircase strategy for the central 30-2 visual field; The test starts from 4 db lower than the average age-expected value of each spot with three reversals, and we accept the lower value of the last reversal interval
- automatic blind-spot detection, patient’s distance detection, and corresponding stimuli position and size adjustment
- patient fixation monitoring using the Heijl–Krakau blind-spot monitoring method, and pausing the exam in the case of two consecutive fixation losses
- USB camera connectivity, to allow for patient monitoring and pausing the examination during testing
- suprathreshold stimuli to check for false-negative results as well as blind-spot stimuli for counting fixation losses
- variable stimulus-presentation rate, adjusted to patient’s response time
- stimulus presentation time 200 milliseconds
- initial patient-response waiting time 500 milliseconds, adjusted to patient’s response time between a minimum 500 milliseconds and a maximum 2 seconds
- stimulus characteristics analogous to Goldman III stimulus.
Examination procedure
During testing, the patient sits comfortably in front of a video-projector screen and stares at the central fixation point, while using a mouse to click whenever they see a visual stimulus on the screen. The patient needs to be within a “distance range” from the screen. The software then locates the blind spot, computes the patient–screen distance, and adjusts the location and size of test points automatically (Figure 1).
 | Figure 1 The patient sits comfortably in front of a video-projector screen. The 76 test points are shown with the fixation target. |
The location and size of test points can be set manually. The points are projected using proper trigonometry adjustment to compensate for the difference between classical bowl perimeter and the video-projector flat screen, so that stimuli appear on the retina as if they were projected from a classical bowl perimeter (Figure 2).
 | Figure 2 Geometry relations between projector screen and a classical perimeter bowl. |
Nine eyes of seven patients consecutively presenting at a visual field lab with different pathology were randomly allocated and tested using a Humphrey perimeter and video-projector method successively within hours for comparison. The results were statistically analyzed and compared. Other short-throw projectors for limited space are currently under evaluation (Figure 3).
 | Figure 3 Two (A and B) short-throw projectors are under evaluation. Notice the projector-to-screen distance is small. |
Statistical analysis
The point-to-point correlation coefficient (r) between the video-projector method and the Humphrey perimeter was computed for each eye using InStat version 3.05 (GraphPad Software, La Jolla, CA, USA). When value distribution was not normal, the nonparametric Spearman correlation coefficient (r) was used.
Results
Our data are summarized in Figures 4– 6. The point-to-point Spearman correlation coefficients (r) for each eye between the two methods are presented in Table 1. The correlation coefficients (r) in all tested eyes between the two methods were statistically significant at P<0.0001.
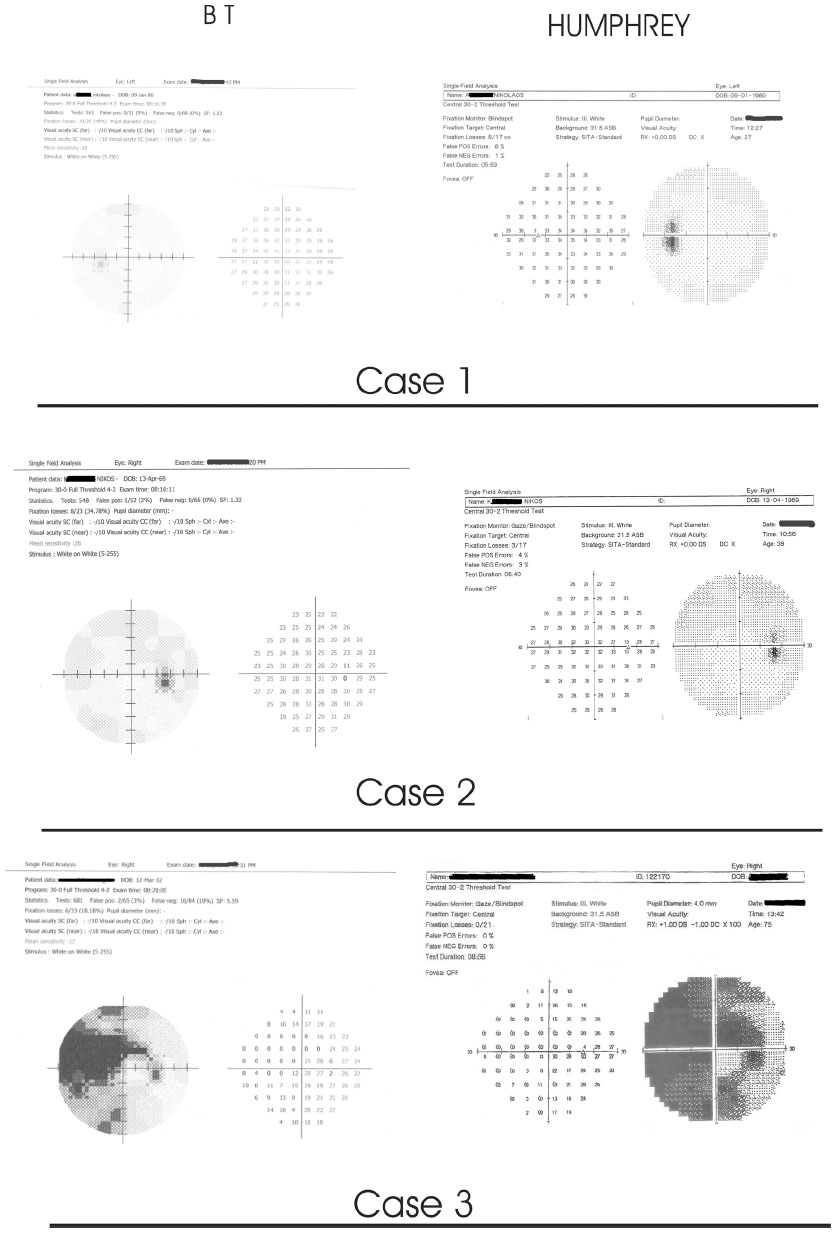 | Figure 4 Results: eyes 1, 2, and 3. |
 | Figure 5 Results: eyes 4, 5, and 6. |
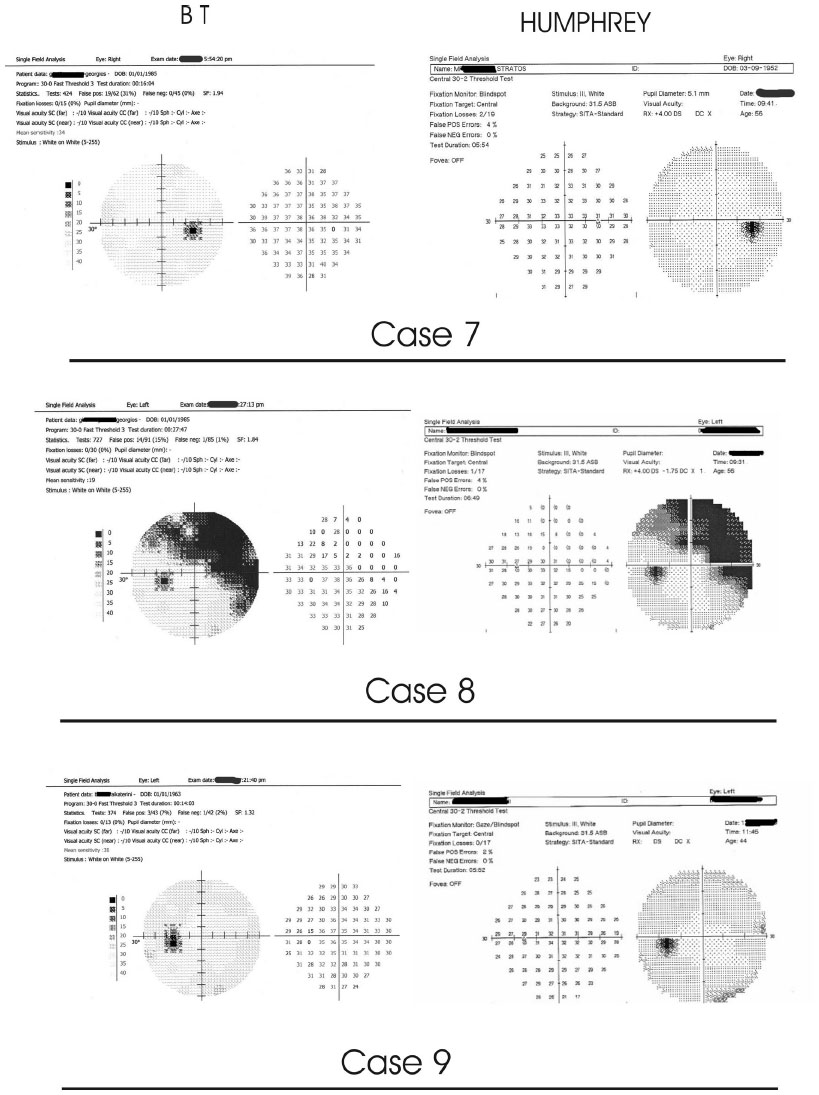 | Figure 6 Results: eyes 7, 8, and 9. |
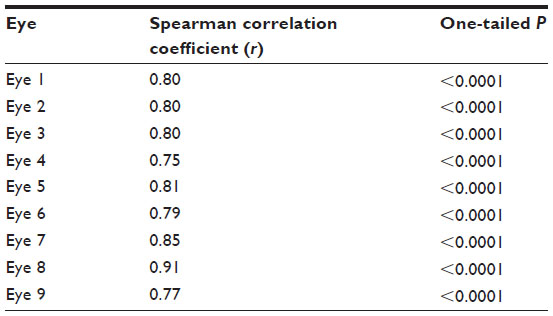 | Table 1 Point-to-point Spearman correlation coefficient (r) between the two methods for each eye |
Discussion
Video-projector perimetry bears many similarities to Humphrey classical bowl perimetry, which is also a projection perimeter, but there are some differences due to the hardware used. The most important advantages of our video-projector method are the ease of use and the comfortable patient position; in fact, it was found that patients tolerated the test well, with few fixation losses. Our method is also low in cost, and this makes it suitable for use when cost is a limiting factor.
In all bowl perimeters, the results are comparable to a significant degree, but each perimeter is different from the others. For example, in the Octopus 101 analyzer, the 5 dB attenuation is equal to 316 asb, while in the Humphrey analyzer the 5 dB attenuation is equal to 3,160 asb. In the Humphrey analyzer 0 dB corresponds to 10,000 asb, while in the Octopus 101 analyzer 0 dB corresponds to 1,000 asb stimulus. These differences make comparisons more difficult between different perimeters. This justifies the statistical difference between the mean values of our video-projector method and the Humphrey perimeter, but the correlation coefficient (r) between the two methods was statistically significant (P<0.0001) for all tested eyes.
It should be noted that differences between perimeters are mainly due to the hardware used and the available luminosity provided. As the available luminosity and luminosity steps of one perimeter approach another, the results become more comparable, if both perimeters implement the same algorithm. This is why the results between different perimeters are comparable but not the same.
The high correlation coefficient between the video-projector method and the Humphrey perimeter, which is accepted as standard in automated (computerized) perimetry, shows that the video-projector method is possibly suitable for clinical use.
Disclosure
The authors report no conflicts of interest in this work.
References
Wu JX, Wormald R, Fitzke F, Poinoosawmy D, Nagasubramanian S, Hitchings R. Laptop computer perimetry for glaucoma screening. Invest Opthalmol Vis Sci. 1991;32:810. | |
Quigley HA, West SK, Munoz B, Mmbaga BBO, Glovinsky Y. Examination methods for glaucoma surveys. Arch Ophthalmol. 1993;111:1409–1415. | |
Wall M, Brito C, Kutzko K. Motion detection perimetry: properties and results. In: Wall M, Heijl A, editors. Perimetry Update 1996/1997. Amsterdam: Kugler; 1997:21–33. | |
Brusini P, Salvetat ML, Parisi L, Zeppieri M. Probing glaucoma visual damage by rarebit perimetry. Br J Ophthalmol. 2005;89:180–184. | |
Kasha JR Jr, inventor. Patent Storm, assignee. Visual field perimetry on a small computer screen. United States patent US 5565949. October 15, 1996. | |
Ianchulev T, Pham P, Makarov V, Francis B, Minckler D. Peristat: a computer-based perimetry self-test for cost effective population screening of glaucoma. Curr Eye Res. 2005;30:1–6. | |
Johnston SC, Damato BE, Evans AL, Allan D. Computerized visual field test for children using multiple moving fixation targets. Med Biol Eng Comput. 1989;27:612–616. |
 © 2014 The Author(s). This work is published and licensed by Dove Medical Press Limited. The
full terms of this license are available at https://www.dovepress.com/terms
and incorporate the Creative Commons Attribution
- Non Commercial (unported, 3.0) License.
By accessing the work you hereby accept the Terms. Non-commercial uses of the work are permitted
without any further permission from Dove Medical Press Limited, provided the work is properly
attributed. For permission for commercial use of this work, please see paragraphs 4.2 and 5 of our Terms.
© 2014 The Author(s). This work is published and licensed by Dove Medical Press Limited. The
full terms of this license are available at https://www.dovepress.com/terms
and incorporate the Creative Commons Attribution
- Non Commercial (unported, 3.0) License.
By accessing the work you hereby accept the Terms. Non-commercial uses of the work are permitted
without any further permission from Dove Medical Press Limited, provided the work is properly
attributed. For permission for commercial use of this work, please see paragraphs 4.2 and 5 of our Terms.