Back to Journals » Clinical Ophthalmology » Volume 11
Visual field examination method using virtual reality glasses compared with the Humphrey perimeter
Authors Tsapakis S ![]() , Papaconstantinou D, Diagourtas A
, Papaconstantinou D, Diagourtas A ![]() , Droutsas K, Andreanos K, Moschos MM, Brouzas D
, Droutsas K, Andreanos K, Moschos MM, Brouzas D
Received 27 December 2016
Accepted for publication 13 April 2017
Published 7 August 2017 Volume 2017:11 Pages 1431—1443
DOI https://doi.org/10.2147/OPTH.S131160
Checked for plagiarism Yes
Review by Single anonymous peer review
Peer reviewer comments 2
Editor who approved publication: Dr Scott Fraser
Stylianos Tsapakis, Dimitrios Papaconstantinou, Andreas Diagourtas, Konstantinos Droutsas, Konstantinos Andreanos, Marilita M Moschos, Dimitrios Brouzas
1st Department of Ophthalmology, National and Kapodistrian University of Athens, Athens, Greece
Purpose: To present a visual field examination method using virtual reality glasses and evaluate the reliability of the method by comparing the results with those of the Humphrey perimeter.
Materials and methods: Virtual reality glasses, a smartphone with a 6 inch display, and software that implements a fast-threshold 3 dB step staircase algorithm for the central 24° of visual field (52 points) were used to test 20 eyes of 10 patients, who were tested in a random and consecutive order as they appeared in our glaucoma department. The results were compared with those obtained from the same patients using the Humphrey perimeter.
Results: High correlation coefficient (r=0.808, P<0.0001) was found between the virtual reality visual field test and the Humphrey perimeter visual field.
Conclusion: Visual field examination results using virtual reality glasses have a high correlation with the Humphrey perimeter allowing the method to be suitable for probable clinical use.
Keywords: visual fields, virtual reality glasses, perimetry, visual fields software, smartphone
Introduction
Automated perimetry is a useful method to assess visual fields in many ophthalmic and neurological diseases. Current perimeters are accurate, but they have a number of disadvantages. Visual field testing is a time-consuming process. It is inconvenient and stressful for debilitated, claustrophobic, ill, or elderly patients to keep their heads still in the perimeter bowl throughout the test. To overcome these problems, visual field testing using a video projector has been proposed.1 The majority of computerized perimeters are specialized pieces of hardware/software. They typically consist of a projection area, an embedded microcontroller, an input device for the operator, and a button for the patient. These devices, built for physicians’ offices or hospitals, are bulky, heavy, and expensive. They are not portable, and they cannot be used at bedside. However, smartphones are found everywhere, and they are inexpensive. Virtual reality (VR) glasses have some advantages in visual field testing. They are lightweight, portable, comfortable, and affordable, and there is no need for an eye patch.
The possibility of using VR glasses for visual field testing has been described since 1998, patent no: US5737060A. However, at that time, hardware and software was an issue. Smartphones and similar portable devices were not as improved as they are today. VR glasses for smartphones did not exist. Win98 was actually just a shell over DOS. The first iPhone was released on January 9, 2007, whereas the Android version 1.0 was released on September 23, 2008. For these reasons, specialized hardware was used with built-in liquid crystal display (LCD).2–4
Commercially available visual reality glasses with built-in displays do not perform well. These VR glasses are usually built for gaming, and the display is usually small with low resolution. This requires moving the fixation point, which confuses older patients, whereas custom-built VR glasses with bigger displays are more expensive and lack standardization. For these reasons, widespread testing of visual field using VR glasses has been limited.
Today’s smartphones are much more powerful, affordable, have bigger displays, and standardization can be achieved by selecting proper hardware/software.
Materials and methods
To test the reliability of visual fields using visual reality glasses, 20 eyes of 10 patients, who were chosen randomly and consecutively at our glaucoma department, were tested successively using a Humphrey perimeter and the VR glasses method within hours for comparison. Approval was obtained from the Ethical Committee of the General Hospital of Athens “G Gennimatas”. Written informed consent was obtained from all patients in the study.
Trust EXOS 3D VR glasses and Alcatel One Touch Pixi 4 (6) 8050D smartphone with 6 inch display were used. The patients were allowed to wear his/her glasses during testing if they felt it was necessary (Figure 1A–C).
 | Figure 1 Virtual reality glasses. (A) front view, (B) rear view, and (C) prescription glasses used with virtual reality glasses. |
Virtual display focus distance is adjusted with the 2 rotating knobs on the sides. Trial glasses were not used as the patient could wear his/her glasses during testing if necessary (Figure 1C).
Proprietary software implementing a fast-threshold 3 dB step staircase algorithm at central 24°/52 points of visual field was used for the purpose of testing (Figure 2). The projected stimuli intensity was distributed on a logarithmic scale.
 | Figure 2 Computer – Virtual reality glasses – computer setup. |
The typical luminosity of a LCD screen is 250 cd/m2. The results of a visual field test depend on the luminosity of the examination display. As different smartphone models may be used for visual field testing, the luminosity of a display must be adjusted in order to make sure that the data are consistent from one visit to another and between successive tests. This allows for the data to be analyzed over time and between different installations.
Contrast ratio is the ratio of luminance between the brightest white and the darkest black that can be produced. Brightness sets the black point and determines the low light output level (black level) of the display.
Gamma describes the relationship between the pixel level and the luminance of the monitor (the light energy it emits). LCDs are considered linear devices; therefore, technically they do not need gamma correction. Gamma correction, however, corrects for the deficiencies (non-linearity) of cathode ray tube (CRT) monitors.
The software uses gamma 1.0 because LCDs are linear but gamma is adjustable to match the viewing system’s gamma for optimum performance (Figure 3).
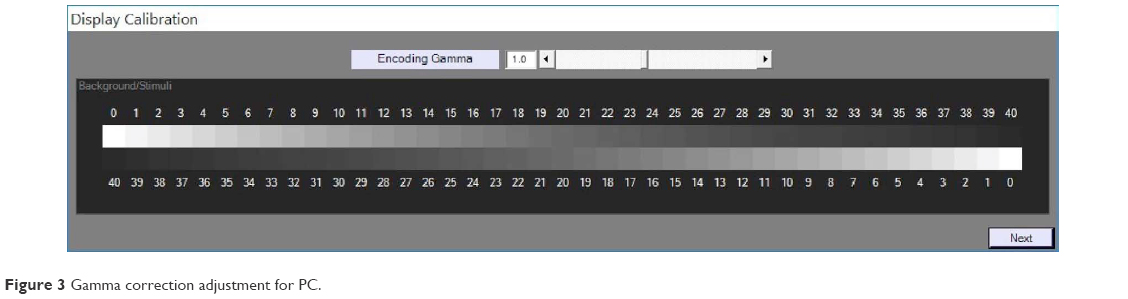 | Figure 3 Gamma correction adjustment for PC. |
The VR glasses gamma is set separately (Figure 4).
 | Figure 4 Gamma correction adjustment for mobile device. |
The display’s gamma/brightness/contrast can be visually calibrated.5,6 Visual calibration is sufficiently reliable to be used as an alternative to calibration using an expensive photometer.5 The software uses a gray scale step wedge for display adjustment. The settings should be set to a point that makes the shades of gray distinct and clearly visible (Figure 5A–D).
 | Figure 5 Mobile device display adjustments and points to be tested. (A) gamma correction, (B) brightness adjustment, (C) left eye points, and (D) right eye points. |
In our case, for better accuracy and comparability, a photometer was used and the luminosity of white color was set at 130 Lux (approximately 410 asb). This was about 50% of the maximum available brightness for the smartphone used (Alcatel Pixi 4(6) 8050D).
Software features
- Fast-threshold, 3 dB step staircase strategy, 52 points, central 24° of visual field.
- The software uses the Heijl–Krakau blind spot method to monitor fixation. The software detects the blind spot by projecting stimuli at maximum luminosity at expected blind spot locations until finding the correct response.
- The software pauses the test in case of fixation loss.
- Supra threshold stimuli are used to check for false negative results. The software also checks for false positive responses.
- Variable stimuli presentation rate, adjusted to patient’s response time.
- Stimuli presentation time 250 ms.
- Initial patient’s response waiting time 500 ms, adjusted to patient’s response time.
The software includes eye tracking capability using AForge. NET computer vision and artificial intelligence language. The source code and binaries of the project are available under the terms of the Lesser GPL and the GPL (GNU General Public License). Pupil diameter and eye movements were not recorded during examination because they were not supported by the VR glasses used. The points are projected using proper trigonometry adjustment to compensate for the classical perimeter bowl of VR glasses so that stimuli appear on the retina as if they were projected from a classical bowl perimeter (Figure 6).
 | Figure 6 Trigonometrical projection to compensate bowl perimetry. |
Examination procedure
During testing, the patient should sit comfortably, put on the VR glasses, and adjust the head straps. The VR glasses should not be tilted, off-center, too high, or too low. Pupil distance should be adjusted with the rotating knob on top. To optimize image quality, focus distance should be adjusted with the 2 rotating knobs on both sides of the VR headset until the picture is sharp.
The VR glasses should be positioned appropriately to avoid lens rim artifact (LRA), which can sometimes be confused as nasal step scotomas. According to a study in central static threshold visual fields (Humphrey 30-2 Program) performed with a corrective lens, LRA was present in 10.4% of 704 fields examined retrospectively and 6.2% of 276 fields evaluated prospectively.7
LRA occurred in one of our patients. If it occurs, then the test should be repeated with better placement of the VR glasses (Figure 7).
 | Figure 7 Rim lens artifact. |
To avoid LRA, the software allows the doctor to project all stimuli (at maximum intensity so that all points are clearly visible, provided there is no absolute scotoma) and make appropriate adjustments. In most cases, this is enough (Figure 8).
 | Figure 8 Software visual field test user interface. |
The software locates the blind spot automatically and adjusts the location and size of the test points. Furthermore, the location and size of test points can be set manually.
Each eye was tested separately, and no eye patch was used. During testing, the patient should stare at the central fixation point and click a mouse whenever he/she sees a visual stimulus on the display (Figure 9).
 | Figure 9 Patient taking the test. |
The patient is free to change position or move his/her head while testing. VR glasses are lightweight; they weigh ~385 g while the smartphone weighs ~179 g. The patient may use his/her hand to hold the VR glasses, making testing more comfortable.
Twenty eyes of 10 patients appearing randomly and consecutively at the visual fields lab were tested successively using a Humphrey perimeter and the VR glasses method within hours for comparison.
The results were statistically analyzed and compared.
The patients tolerated the VR test very well. All the patients reported that it was much more comfortable compared to the standard bowl perimeter (Humphrey).
Statistical analysis
Point-to-point correlation coefficient (r) between the VR glasses and the Humphrey perimeter was computed for each eye and for all eyes together using the InStat version 3.05 of GraphPad Software, Inc. When the distribution of values was not normal, nonparametric Spearman correlation coefficient (r) was used.
VR glasses tests are 24° (52 points), whereas Humphrey tests are 30° (76 points). Only the corresponding (common 52 points) between these are taken into consideration (Figures 10–16).
 | Figure 10 Results, eye 1–3. |
 | Figure 11 Results, eye 4–6. |
 | Figure 12 Results, eye 7–9. |
 | Figure 13 Results, eye 10–12. |
 | Figure 14 Results, eye 13–15. |
 | Figure 15 Results, eye 16–18. |
 | Figure 16 Results, eye 19, 20. |
Results
In each eye and in all eyes together, the mean difference value between the two methods was statistically significant at P<0.0001.
The correlation coefficient (r) in all tests between the two methods was statistically extremely significant at P<0.0001.
Discussion
VR glasses perimetry has many similarities to classical bowl perimetry. There are some differences due to the hardware used. In all bowl perimeters, the results are comparable to a significant degree, but they are not identical because each perimeter is different from others.
For example, in the Octopus perimeter, a 5 dB attenuation is equal to 316 asb, whereas in the Humphrey perimeter, a 5 dB attenuation is equal to 3160 asb. In Humphrey, 0 dB correspond to 10,000 asb, whereas in Octopus, 0 dB correspond to 1,000 asb stimulus. Such differences make comparisons more difficult between different devices. This justifies the statistical difference between the mean values of the VR glasses perimetry method and the Humphrey perimeter, yet the correlation coefficient (r) between the two methods was statistically extremely significant (r=0.808, P<0.0001; Table 1). For this reason, if we want the results to be comparable, then the same device should be used for consecutive tests.
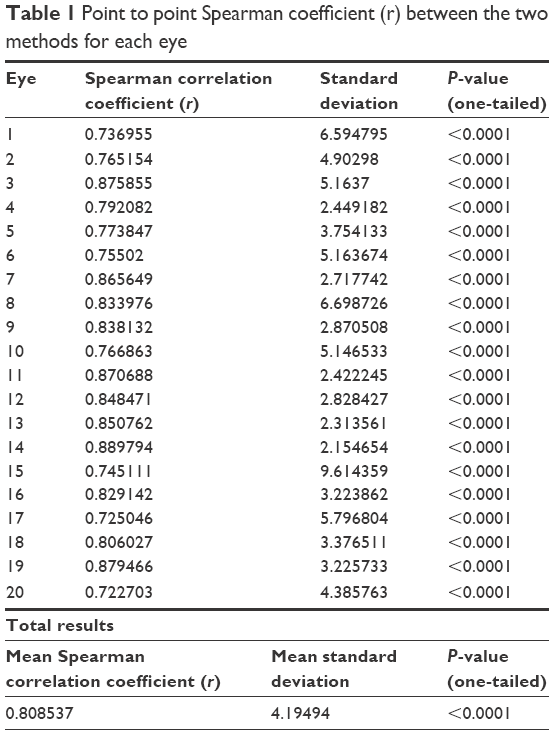 | Table 1 Point to point Spearman coefficient (r) between the two methods for each eye |
Visual field testing is a subjective examination. The variability is significant, and the more visual field damage there is, the greater is the variability of the results.8,9 Testing the same eye/patient twice in the same day using the same machine does not produce identical results. It should be noted that the differences between devices are mainly due to the differences in the hardware used and the luminosity of the devices. As the available luminosity and luminosity steps of one device approaches the other, the results become more comparable, if both perimeters are running the same algorithm. The results between different perimeters are similar but not identical. Other studies have found corresponding results.10–15
The most important advantages of VR glasses method are the ease of use and the comfortable patient position; in fact, it has been found that the patients tolerated the test well and fixation losses occurred rarely.16 The patients moved their heads freely. Furthermore, VR glasses method has low cost, and this makes it suitable for use when cost is an important factor.
High correlation coefficient between VR glasses and the Humphrey perimeter shows that the method is reliable at least when compared to the Humphrey perimeter and probably suitable for clinical use.
An additional application for smartphones is Visual Fields Easy designed to use the iPod screen to perform a fast screening test of the visual fields developed at the University of Iowa (Iowa City, IA, USA).
Virtual Eye perimeter is another device operated through a portable Windows computer (laptop or desktop). A simple, single-screen graphical user interface was designed to emulate the performance of standard instruments such as the Humphrey field analyzer (HFA II), from Carl Zeiss Meditec (Dublin, CA, USA), or Easyfield from Oculus (Wetzlar, Germany). This device requires VR goggles with proprietary interface electronics and a trial lens holder; when the stimulus is detected, the fixation point moves to the position of the detected stimulus.14–16
The Kasha visual field is a system that uses two full color 0.7 inch ×0.7 inch LCD systems. Early trials comparing this head-mounted perimetry device with the Humphrey field analyzer have found comparable results in terms of field classification. The authors stated that further trials were necessary in order to fully evaluate this device relative to the standard perimetry tools such as the Humphrey or Goldmann field analyzers.4
The advantages of our system are that it does not require proprietary hardware; the screen is large enough, which eliminates the requirement of moving the fixation point, and the patient uses his/her own glasses.
The software is freely available to non-profit institutions by contacting the corresponding author or by sending an email at [email protected].
Disclosure
The authors report no conflicts of interest in this work.
References
Brouzas D, Tsapakis S, Nitoda E, Moschos MM. Visual field examination using a video projector: comparison with Humphrey perimeter. Clin Ophthalmol. 2014;8:523–528. | ||
John R, Kasha Jr, inventors; Kasha Jr, John R, assignee. Visual field perimetry using virtual reality glasses. United States patent US5737060A. 1998 Apr 7. | ||
Chan ADC, Eizenman M, Flanagan J, Trope G. Head-mounted perimetry. In: Vision Science and Its Applications; OSA Technical Digest Series, Optical Society of America; February 19, 1999; Washington, DC: USA. Paper MB1. | ||
Hollander DA, Volpe NJ, Moster ML, et al. Use of a portable head mounted perimetry system to assess bedside visual fields. Br J Ophthalmol. 2000;84(10):1185–1190. | ||
Colombo E, Derrington A. Visual calibration of CRT monitors. Displays. 2001;22(3):87–95. | ||
Xiao K, Fu C, Karatzas D, Wuerger S. Visual gamma correction for LCD displays. Displays. 2011;32(1):17–23. | ||
Zalta AH. Lens rim artifact in automated threshold perimetry. Ophthalmology. 1989;96(9):1302–1311. | ||
Wall M, Woodward KR, Doyle CK, Artes PH. Repeatability of automated perimetry: a comparison between standard automated perimetry with stimulus size III and V, matrix, and motion perimetry. Invest Ophthalmol Vis Sci. 2009;50(2):974–979. | ||
Wall M, Wild JM, editors. Perimetry Update 1998/1999: Repeatability of abnormality and progression in glaucomatous standard and SWAP visual fields: Proceedings of the XIIIth International Perimetric Society Meeting;1998 Sep 6–9; Gardone Riveira (BS), Italy. The Netherlands: Kugler Publications; 1999. | ||
Ianchulev T, Pham P, Makarov V, Francis B, Minckler D. Peristat: a computer-based perimetry self-test for cost-effective population screening of glaucoma. Curr Eye Res. 2005;30(1):1–6. | ||
McKendrick AM. Recent developments in perimetry: test stimuli and procedures. Clin Exp Optom. 2005;88(2):73–80. | ||
Wu X, Wormald RPL, Fitzke F, Nagasubramanian S, Hitchings RA. Laptop computer perimetry for glaucoma screening, Invest Opthalmol Vis Sci. 1991;32(Suppl):810. | ||
Bruun-Jensen J. Visual field screening with a laptop computer system. Optometry. 2011;82(9):519–527. | ||
Moosavi R, Verdon-Roe GM, Westcott MC, Crabb DP, Viswanathan AC, Fitzke FW, Garway-Heath DF. Comparison of the effect on Moorfields Motion Test (MDT) thresholds of stimulus scaling for eccentricity and age. Invest Ophthalmol Vis Sci. 2008: ARVO E-Abstract 1083. | ||
Verdon-Roe GM, Moosavi R, Bergin C, Westcott MC, Crabb D, Viswanathan AC, Fitzke FW, Garway-Heath DF. Motion hyperacuity in Glaucoma: comparison of the extent of damage identified with The Moorfields Motion Displacement Test (MDT) with Standard Automated Perimetry. Invest Ophthalmol Vis Sci. 2008: ARVO E-Abstract 1156. | ||
Wroblewski D, Francis BA, Sadun A, Vakili G, Chopra V. Testing of visual field with virtual reality goggles in manual and visual grasp modes. Biomed Res Int. 2014;2014:206082. |
 © 2017 The Author(s). This work is published and licensed by Dove Medical Press Limited. The
full terms of this license are available at https://www.dovepress.com/terms
and incorporate the Creative Commons Attribution
- Non Commercial (unported, 3.0) License.
By accessing the work you hereby accept the Terms. Non-commercial uses of the work are permitted
without any further permission from Dove Medical Press Limited, provided the work is properly
attributed. For permission for commercial use of this work, please see paragraphs 4.2 and 5 of our Terms.
© 2017 The Author(s). This work is published and licensed by Dove Medical Press Limited. The
full terms of this license are available at https://www.dovepress.com/terms
and incorporate the Creative Commons Attribution
- Non Commercial (unported, 3.0) License.
By accessing the work you hereby accept the Terms. Non-commercial uses of the work are permitted
without any further permission from Dove Medical Press Limited, provided the work is properly
attributed. For permission for commercial use of this work, please see paragraphs 4.2 and 5 of our Terms.