Back to Journals » Clinical Ophthalmology » Volume 19
Visual and Refractive Outcomes of a Hydrophobic Trifocal Diffractive Intraocular Lens in Eyes with Different Axial Lengths
Authors Bosc C, Joubert R, Le Maléfan E, Boury P, Bernier M, Barrucand A
Received 19 September 2025
Accepted for publication 9 December 2025
Published 16 December 2025 Volume 2025:19 Pages 4765—4774
DOI https://doi.org/10.2147/OPTH.S562243
Checked for plagiarism Yes
Review by Single anonymous peer review
Peer reviewer comments 2
Editor who approved publication: Dr Bharat Gurnani
Camille Bosc, Romain Joubert, Eloïse Le Maléfan, Pauline Boury, Mélanie Bernier, Anne Barrucand
Research Clinic Department, Institut Ophtalmologique de l’Ouest (IOO) Jules Verne, Nantes, France
Correspondence: Camille Bosc, Research Clinic Department, Institut Ophtalmologique de l’Ouest (IOO) Jules Verne, 2/4 Route de Paris, Nantes, 44300, France, Email [email protected]
Purpose: To analyse the clinical outcomes of a hydrophobic trifocal diffractive intraocular lens (IOLs) implanted in eyes with different axial lengths.
Methods: This prospective study enrolled 116 eyes implanted with the FineVision HP IOL (Beaver-Visitec International, Inc. USA). The eyes were allocated into 3 groups according to their preoperative axial length: Group A (21.00– 22.50 mm, n=17), Group B (> 22.50– 24.00 mm, n=83), and Group C (> 24.00– 28.50 mm, n=16). Post-operative outcomes at 3 months considered manifest refraction, monocular LogMAR uncorrected distance visual acuity (UDVA), corrected distance visual acuity (CDVA), and uncorrected near visual acuity (UNVA) and distance-corrected near visual acuity (DCNVA, at 40 cm).
Results: For Group A, 70.59% and 100% of eyes were within ± 0.50D and ± 1.00D, respectively (mean spherical equivalent [SE]: 0.23± 0.39D); for Group B, these figures were 84.34% and 100%, respectively (mean SE: − 0.12± 0.41D); and for Group C, all eyes were within ± 0.50D (mean SE: 0.16± 0.21D). SE did not differ between groups (p> 0.4). The mean CDVA was – 0.01± 0.07, – 0.02± 0.06, and – 0.05± 0.07 for Groups A, B, and C, respectively (p=0.147), and the mean DCNVA was 0.09± 0.03, 0.08± 0.05 and 0.09± 0.03, respectively (p=0.716). For distance vision, in Group A, 76.47% and 100% of eyes had a cumulative CDVA of ≥ 20/20 and ≥ 20/25, respectively. These percentages changed to 92.77% and 100% for Group B, and 93.75% and 100% for Group C, respectively. For near vision, for Group A, 11.76% and 100% of eyes had a cumulative DCNVA of ≥ 20/20 and ≥ 20/25, respectively. These percentages changed to 18.07% and 100% for Group B, and 12.50% and 100% for Group C, respectively.
Conclusion: The hydrophobic trifocal diffractive FineVision HP IOL provides good visual and refractive outcomes for eyes with different axial length.
Keywords: trifocal, intraocular lens, Barrett Universal II, diffractive, axial length
Introduction
A recent overview of eight systematic reviews analysed the effectiveness of intraocular lenses (IOLs) designed to correct presbyopia (multifocal [bifocal and trifocal], extended-depth-of-focus [EDOF]) and accommodative and monofocal IOLs after cataract surgery focusing on the visual outcomes, spectacle independence, adverse visual effects and their cost-effectiveness.1 For visual acuity outcomes, this study concluded that all the IOLs showed similar uncorrected distance visual acuity (UDVA); EDOF and trifocal lenses showed better intermediate visual acuity; trifocal diffractive, EDOF, accommodative and bifocal IOLs were better than monofocal IOLs for uncorrected near vision (UNVA) and, of these, trifocal and bifocal lenses reported a better UNVA. It should be noted that while multifocal and EDOF lenses present comparable performance for UDVA and intermediate visual acuity, multifocal IOLs perform better for UNVA but at the cost of glare and halos. A meta-analysis on trifocal and EDOF IOLs concludes that patients receiving trifocal models may achieve better near vision and may be less dependent on spectacles for near vision,2 and trifocal IOLs also provide better visual acuity and spectacle independence at near distances.3 Trifocal IOLs therefore offer a good solution, allowing cataract and refractive surgeons to provide their patients with satisfactory visual outcomes at different distances.
The FineVision HP IOL (Beaver-Visitec International, Inc., USA) is a trifocal hydrophobic lens with a double C-loop haptic design creating two additions with a diffractive design (+3.50D and +1.75D). This lens has been used worldwide, and a recent literature review of this model based on 18 clinical publications (1028 eyes) in cataract and refractive lens exchange (RLE) procedures concluded that this lens provides good refractive outcomes and excellent visual performance when implanted.4 The POD platform with double C-loop haptics (symmetrical quadripod design with two-by-two oppositely oriented haptics) has been shown to be rotationally stable when used in different IOL models.5 However, despite these publications, to the best of our knowledge there have been no clinical studies focusing on the outcomes of the FineVision HP IOL model in eyes with different axial lengths. The main purpose of this prospective clinical study is, therefore, to analyse the visual and refractive outcomes of the FineVision HP IOL when implanted in eyes with different axial lengths. It is expected that the findings obtained from this study will provide a reference for cataract and refractive surgeons when using this IOL model.
Materials and Methods
Patients and Surgical Procedure
This was a prospective clinical study that collected data from patients in the Institut Ophtalmologique de l’Ouest (IOO) Jules Verne (Nantes, France) submitted to unilateral or bilateral cataract or RLE surgery involving FineVision HP IOL implantation. Patient data was anonymised, and no additional intervention beyond standard care was performed. Either toric or non-toric models of this lens were used depending on the pre-existing corneal astigmatism. The study was approved by the IOO Review Board (IOO-2025-1) and conducted in accordance with Good Clinical Practices and the principles of the Declaration of Helsinki with patients signing the informed consent form. The inclusion criteria considered all patients who benefited from bilateral cataract phacoemulsification surgery with the insertion of FineVision HP IOLs and exclusion criteria included ocular disease (glaucoma, macular degeneration, corneal or neuro-ophthalmic diseases) and a history of ocular inflammation.6 Standard phacoemulsification cataract surgery was performed using the EVA NEXUS (DORC Dutch Ophthalmic Research Centre (International) B.V., Zuidland, The Netherlands) with a pop- and pre-chop technique in all the interventions, the FineVision HP IOL being inserted into the capsular bag.
Intraocular Lens
The FineVision HP (POD F GF), launched in 2019, is made with glistening-free (GF) hydrophobic acrylic material and with a diffractive trifocal that creates two additions, one for +3.50D and the other for +1.75D. It has a double C-loop haptic design with a spherical power ranging from +10D to +35D (0.50D-steps) and cylindrical powers at the IOL plane of 1/1.50/2.25/3/3.75/4.50/5.25 or 6D. A recent review of this IOL model was published explaining its main characteristics and the clinical outcomes of different authors.4
Pre- and Post-Operative Examinations
All the patients were examined preoperatively, and the eyes were allocated into three groups according to their preoperative axial length measured with the non-contact optical biometer IOLMaster 500/700 (Carl Zeiss Meditec, Jena, Germany): Group A, with axial length values ranging from 21.00 to 22.50 mm, Group B, with axial length values ranging from >22.50 to 24.00 mm, and Group C with axial length values ranging from >24.00 to 28.50 mm. The Barrett Universal II and Barrett toric formulas were used to calculate the specific IOL power for each eye, the target being emmetropia. Measurements from the IOLMaster 500 were entered manually to the ESCRS on-line calculator. Post-operative outcomes at 3 months of follow-up considered the following: manifest refraction (sphere, cylinder and axis), monocular LogMAR UDVA, corrected distance visual acuity (CDVA), and UNVA and distance-corrected near visual acuity (DCNVA) at 40 cm. A double-angle plot tool7 was employed in order to specifically assess the astigmatism outcomes based on the preoperative corneal astigmatism obtained from the optical biometer and the postoperative manifest refraction.
Statistical Analysis
All the variables were included in a database that was evaluated using Microsoft Excel (2019, v. 16.43, Microsoft Corporation, USA), and reported as the mean, standard deviation and ranges for continuous variables, and counts and percentages for categorical variables. Statistical analysis was performed using IBM SPSS Statistics software (v. 28.0.1, IBM Corp., USA) employing different tests to compare the groups both pre- and postoperatively: the Welch one-way ANOVA, Kruskal–Wallis, Games–Howell post-hoc, and Levene’s tests. A p-value of less than 0.05 was considered significant. Standard graphs for reporting refraction and visual acuity outcomes in IOL-based refractive surgery were plotted.8
Results
A total of 116 eyes (68 patients; 41 female) implanted with the FineVision HP IOL were included in this study. In total, 81 eyes were implanted with the spherical IOL model and 35 eyes with the toric IOL model. The demographics and preoperative characteristics of the three groups are described in Table 1 with the mean, standard deviation, and ranges.
 |
Table 1 Demographics and Preoperative Characteristics of the Different Eye Groups Included in This Study, Shown as Means, Standard Deviations, and Ranges |
The mean age was virtually identical across the three groups; although Levene’s test indicated unequal variances (p=0.021), the robust Welch one-way ANOVA showed no between-group differences (p=0.99). The non-parametric Kruskal–Wallis test confirmed this finding (p=0.704). Thus, the three groups were age-matched, and age is unlikely to confound the subsequent analyses. The baseline ocular characteristics differed significantly among groups. CDVA before surgery was slightly poorer in Group C than in Group B (0.13±0.14 vs 0.03±0.09 LogMAR; p<0.001), while Group A showed no significant differences from either cohort. The refractive status presented the largest divergence: the mean spherical equivalent decreased from strong hyperopia in Group A (2.54±1.37D) to mild hyperopia in Group B (1.43±1.08D), and to moderate myopia in Group C (–2.56±2.84D). Welch’s ANOVA confirmed a highly significant effect (p<0.001) (η2=0.51, meaning that 51% of all the variability in the dependent variable was explained by the grouping factor), and the Games–Howell post-hoc tests indicated that each pair of groups differed (all p<0.001). The corneal curvature (K1/K2) flattened progressively from Group A to Group B (both p<0.001). The anterior chamber depth increased accordingly (2.90±0.17 mm for Group A; 3.10±0.31 mm for Group B; and 3.42±0.28 mm for Group C; p<0.001). Lens thickness did not vary across the groups (p=0.356) and the white-to-white (WTW) diameter was modestly greater in Group B (12.35±0.37 mm) than in Groups A and B (p=0.010). IOL calculations reflected these biometric trends. The mean spherical IOL power dropped from 25.3±1.7D in Group A to 22.6±1.5D in Group B and 16.7±2.3D in Group C (p<0.001) (η2=0.67), and the cylindrical power was higher in Group A than in Group B (0.78±0.74 vs 0.28±0.52D; p=0.005); the differences involving Group C were not significant. Overall, apart from lens thickness, all the baseline variables except CDVA exhibited clear, clinically meaningful gradients across the three groups, with effect sizes ranging from moderate to very large.
Levene’s test showed heteroscedasticity for axial length and UNVA (p<0.05), while the variances were homogeneous for the remaining continuous outcomes. Given the marked imbalance in sample size, the following procedures were adopted for axial length and UNVA: one-way ANOVA with Games–Howell post-hoc plus Kruskal–Wallis as a non-parametric corroboration; and all other variables: conventional one-way ANOVA (equal variances).
For axial length, the mean value increased across groups: 22.08±0.32 mm; 23.29±0.44 mm, and 25.61±0.88 mm for Groups A, B, and C, respectively. Welch’s ANOVA confirmed a highly significant difference (p<0.001) and Games–Howell showed each pairwise comparison was significant (all p<0.001). Kruskal–Wallis yielded p<0.001, supporting the finding. The effect was very large (η2=0.79), meaning that 79% of the total variance in the outcome is explained by the group factor.
Refractive Error Outcomes
Figure 1 shows the refractive outcomes at 3 months for the three groups (Figure 1A shows spherical equivalent and Figure 1B refractive cylinder). At this time, for Group A, 70.59% of eyes were within ±0.50D and 100% were within ±1.00D. The average spherical equivalent obtained was 0.23±0.39D (from −0.63D to 0.75D), the mean spherical refraction was 0.32±0.39D (from −0.25D to 1.00D), and the mean cylinder was −0.19±0.20D (from 0D to −0.75D). For Group B, 84.34% of eyes were within ±0.50D and 100% were within ±1.00D. The mean spherical equivalent obtained was −0.12±0.41D (from −1.13D to 1.38D), the average spherical refraction was 0.25±0.40D (from −0.75D to 1.50D), and the average cylinder was −0.27±0.27D (from 0D to −1.00D). For Group C, 100% of eyes were within ±0.50D. The mean spherical equivalent obtained was 0.16±0.21D (from −0.13D to 0.50D), the average spherical refraction was 0.27±0.23D (from 0D to 0.75D), and the average cylinder was −0.22±0.27D (from 0D to −0.75D). The post-surgery statistical analysis revealed that the spherical equivalent did not differ between the groups (ANOVA, p=0.574; Kruskal–Wallis, p=0.463). Specifically, for astigmatism, Figure 1B depicts the distribution of the refractive cylinder for the three groups. It shows that in groups A, B, and C, 88.24%, 90.36% and 87.50% of the eyes were ≤0.50D, respectively, and for all three groups, 100% of the eyes were ≤1.00D. Figure 2 shows the double-angle plots of the preoperative corneal astigmatism and postoperative refractive astigmatism at 3 months post-surgery. The centroid of the refractive astigmatism after the surgery was 0.05±0.34D at 110°, 0.08±0.37D at 19° and 0.03±0.35D at 24° for Groups A, B, and C, respectively. The mean absolute value was reduced from 1.02±0.56D preoperatively to 0.19±0.28D at 3 months after the intervention for Group A, from 0.72±0.40D to 0.27±0.27D for Group B, and from 0.69±0.30D to 0.22±0.26D for Group C.
 |
Figure 1 Distribution of postoperative spherical equivalent refraction (A) and refractive cylinder (B) at 3 months post-surgery for the three groups. |
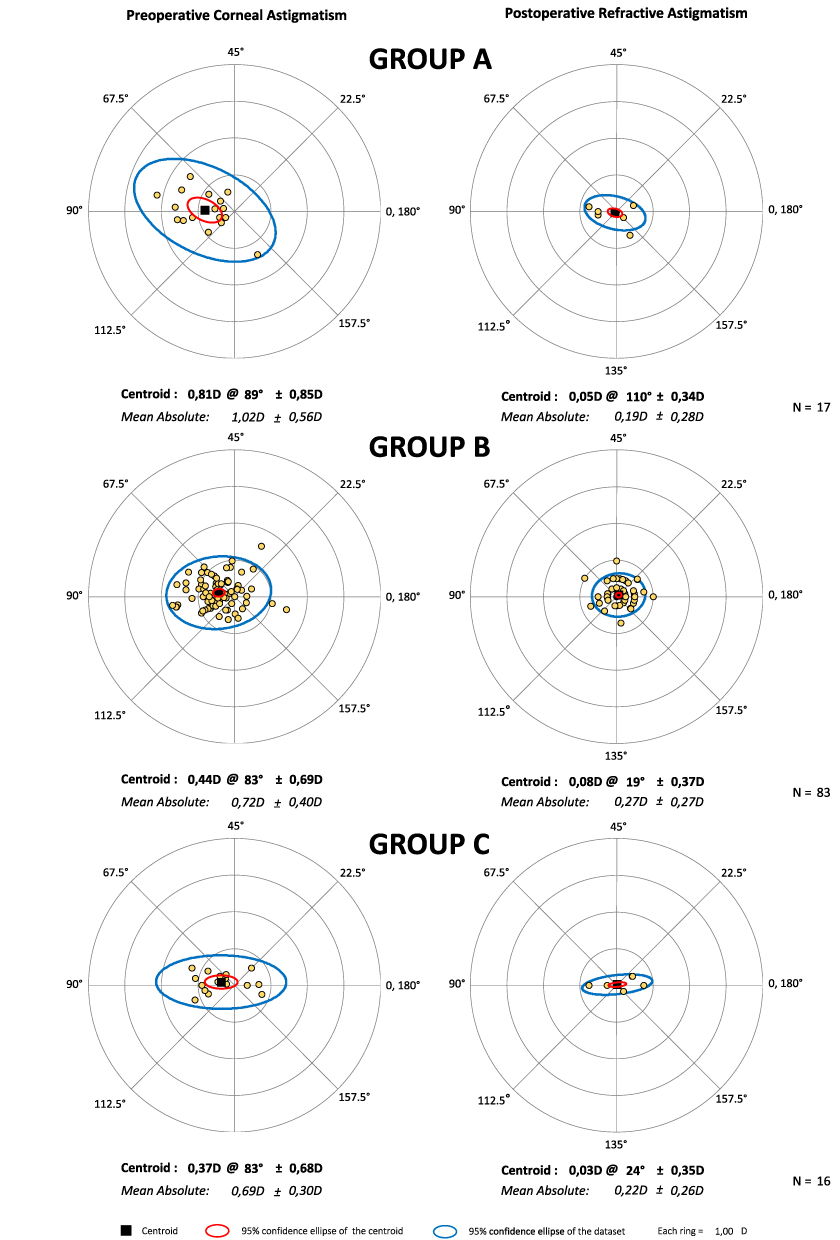 |
Figure 2 Double-angle plots for preoperative corneal astigmatism and postoperative refractive astigmatism at 3 months post-surgery for the three groups. Centroids and mean absolute values with standard deviations are also shown. |
Visual Acuity Outcomes
Table 2 shows the mean, standard deviation and ranges for the visual acuity outcomes for distance and near vision for the three groups. There were no statistically significant differences between the three groups for UDVA, CDVA, UNVA, and CDNVA (p>0.05). Figure 3 plots the cumulative percentage of eyes with a given UDVA and CDVA (top), and UNVA and DCNVA (bottom) at 3 months post-surgery for the three groups. For distance vision, in Group A, 76.47% and 100% of the eyes had a cumulative CDVA of ≥20/20 and ≥20/25, respectively. These percentages changed to 92.77% and 100% for Group B, and 93.75% and 100% for Group C, respectively. For near vision (40 cm), in Group A, 11.76% and 100% of the eyes had a cumulative DCNVA of ≥20/20 and ≥20/25, respectively. These percentages changed to 18.07% and 100% for Group B, and 12.50% and 100% for Group C, respectively.
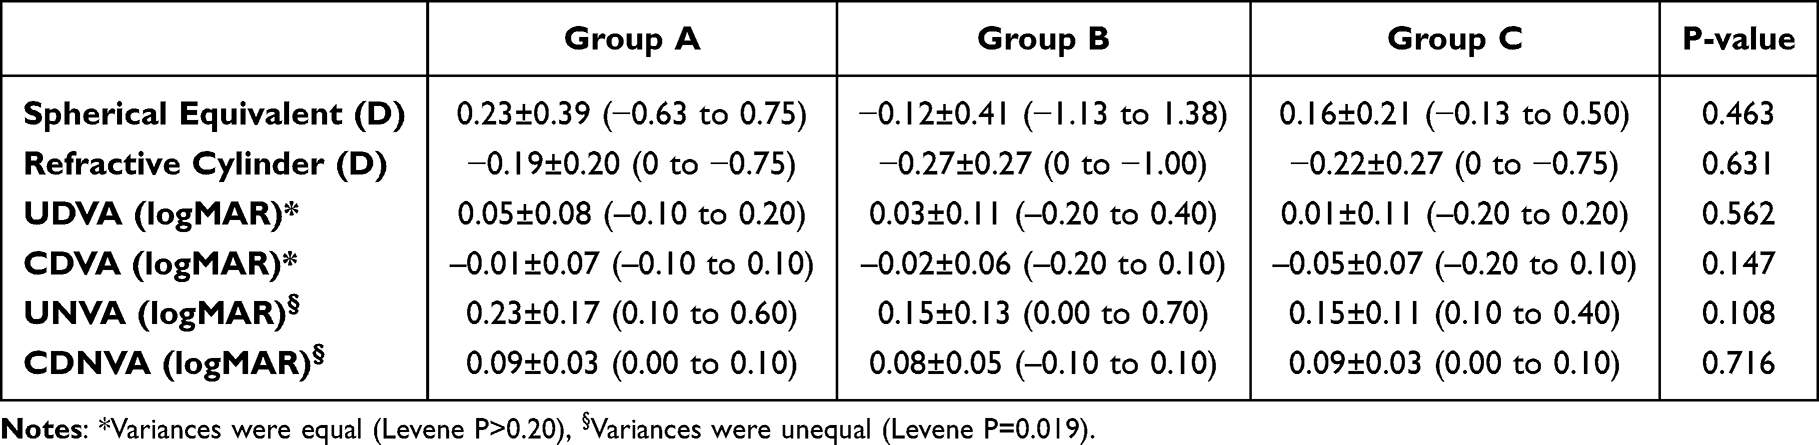 |
Table 2 Refractive and Visual Acuity Outcomes at Distance and Near Vision of the Different Eye Groups Included in This Study, Shown as Means, Standard Deviations, and Ranges |
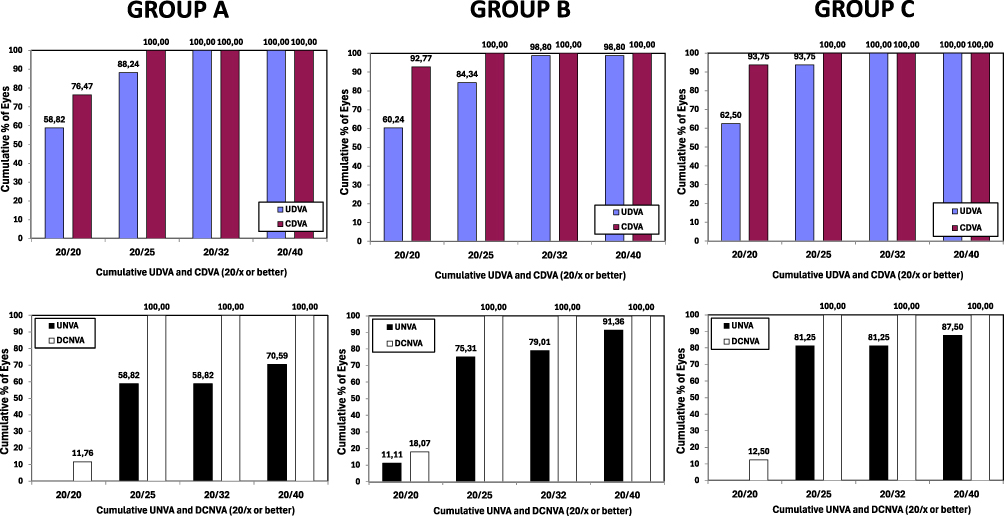 |
Figure 3 Cumulative proportion of eyes at 3 months post-surgery for the three groups with a given postoperative uncorrected distance visual acuity (UDVA) and corrected distance visual acuity (CDVA), and uncorrected near visual acuity (UNVA) and distance-corrected visual acuity (DCNVA) at 40 cm. |
Discussion
A recent review analysing different publications studying the FineVision HP IOL concluded that this IOL model provides good refractive outcomes and excellent visual performance when implanted.4 This model also demonstrates good predictability, safety and effectiveness when implanted after cataract surgery. Unfortunately, there are no publications on this lens that specifically assess the outcomes as a function of the axial length of the eye. That was the main purpose of this clinical study.
Our results revealed that the accuracy of the procedure was very good for all eyes implanted with this IOL model (the mean spherical equivalent values for the three groups were less than a quarter of diopter). It should be noted that there were no statistically significant differences in spherical equivalent between the three groups considered in our cohort (ANOVA, p=0.574; Kruskal–Wallis, p=0.463). All the eyes were within ±1.00D of spherical equivalent, and they all showed a refractive cylinder of ≤1.00D for the three groups (see Figure 1). The role of axial length in trifocal IOLs has been assessed in previous studies by other authors but considering other implanted trifocal lenses. It is therefore interesting to compare our results with those published previously. Table 3 summarises the publications discussing the AT LISA tri 839MP (Carl Zeiss Meditec, Jena, Germany) and the AcrySof PanOptix (Alcon Labs, Fort Worth, USA) IOLs.9–12 The table indicates the names of the authors, year of publication, type of study (prospective/retrospective), IOL model, number of eyes included for different axial lengths, and follow-up.
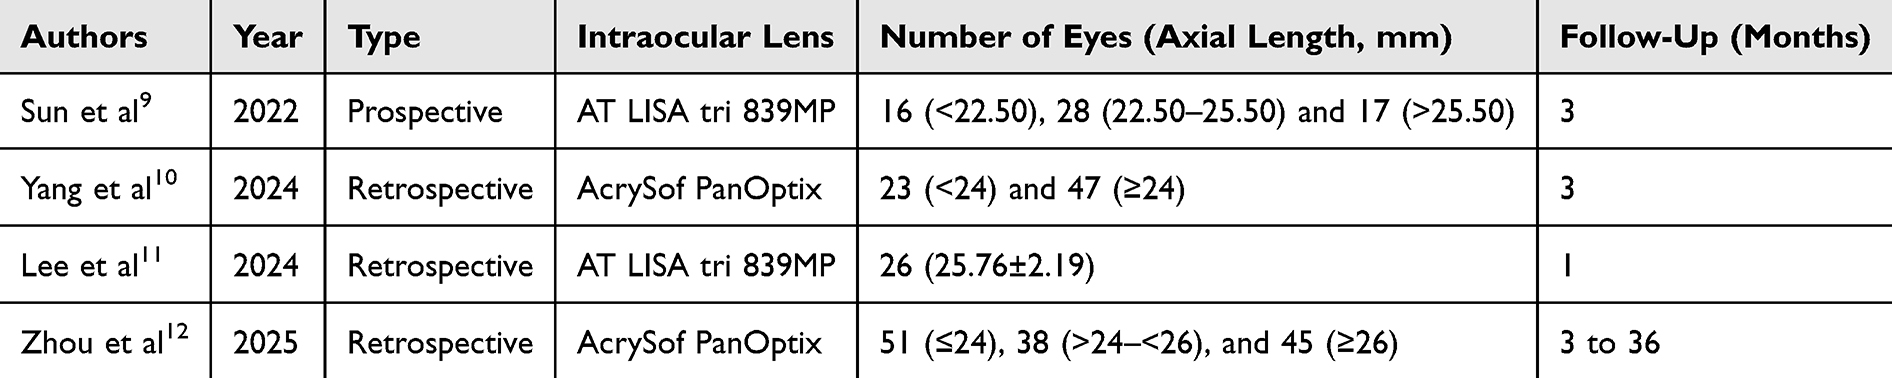 |
Table 3 Peer-Reviewed Publications with Trifocal Intraocular Lenses in Eyes with Different Axial Lengths |
Sun et al9 prospectively assessed 45 eyes implanted with the AT LISA tri 839MP at 3 months post-surgery. These authors divided the eyes into three groups, 16 eyes had axial length values of <22.50 mm, 28 eyes had values ranging from 22.50 to 25.50 mm, and 17 eyes had values of >25.50 mm. They found that both the spherical equivalent and the refractive cylinder were similar among the three groups (p=0.227 and p=0.070, respectively). They analysed the prediction error and found that 31%, 32%, and 47% of eyes had a value from –0.25D to 0.24D in the three groups (p=0.538), but the percentages of eyes with a value from –0.75D to –0.26D were 38%, 54%, and 6% (p=0.005), and the proportions of eyes with a value from 0.25D to 0.74D were 13%, 11%, and 35% (p=0.129). They pointed out that there was no significant difference in the absolute value among the three groups (p=0.349). In contrast, Lee et al11 retrospectively analysed the outcomes of 26 eyes implanted with the same lens at 1-month post-surgery to find a potential correlation between biometric parameters and postoperative outcomes. These authors reported that a large axial length was associated with higher spherical equivalent (p=0.019). Finally, Zhou et al12 retrospectively examined the AcrySof PanOptix IOL in 136 eyes of 86 patients with a minimum follow-up of 3 months up to 3 years. Specifically, they analysed 51 eyes with an axial length of ≤24 mm, 38 eyes ranging from 24 mm to <26 mm, and 45 eyes with a value of ≥26 mm. They reported mean spherical equivalent values of –0.07±0.35D, –0.14±0.31D, and –0.13±0.30D, for these three groups, respectively, showing no statistically significant differences between them (p=0.402). Our results agree with those of Sun et al9 and Zhou et al12 reporting good refractive accuracy outcomes in eyes with different axial lengths implanted with other trifocal IOL models. The paper reviewing the FineVision HP IOL4 reports that the published mean postoperative spherical equivalent values were close to emmetropia and never greater than 0.25D, with almost all the eyes from the different studies being within 1.00D. Our results broadly agree with these findings. Studies, specifically after 3 months of follow-up, showed that 90% of eyes in a Caucasian population,13 and 97.78% and 98.48% of eyes in a Japanese cohort14,15 were ±0.50D, while these percentages were 92%, 100% and 100% for ±1.00D, respectively. For refractive astigmatism, our study obtained values about a quarter of diopter: −0.19±0.20D, −0.27±0.27D, and −0.22±0.27D, for Groups A, B, and C, respectively. The publications indicated previously also revealed good outcomes for astigmatism, with mean values of −0.08±0.23D14 and −0.08±0.23D15 at 3 months, with 91.11%14 and 95.45%15 of eyes having values of ≤0.50D, and 100%14,15 of eyes being ≤1.00D. In the three groups in our study, 88.24% to 90.36% of eyes were ≤0.50D, and 100% of eyes were ≤1.00D (see Figure 1B for detailed values). The refractive outcomes of the FineVision HP IOL are therefore good, agreeing with previous studies on this model, and showing no differences according to the preoperative axial length of the eye.
Focusing now on the visual acuity outcomes, our study revealed that there were also no differences between the three groups for UDVA, CDVA, UNVA and CDNVA (p>0.05). For the three groups, the mean CDVA was better than 20/20 and the mean CDNVA was better than 20/25 (see Table 2 for detailed values). This is in agreement with the study of Poyales et al13 (mean: −0.03±0.03 logMAR), and the figures published by Akahoshi14,15 (mean: −0.07±0.06 logMAR) with the same follow-up period using the FineVision HP IOL. For near vision, these studies reported mean values of DCNVA at 40 cm of 0.13±0.11 logMAR,13 0.03±0.10 logMAR,14 and 0.02±0.08 logMAR,15 in line with our values, with means ranging from 0.08 to 0.09 logMAR. The cumulative percentages of eyes with a CDVA of ≥20/20 and ≥20/25 were 87.5% and 100%, respectively, for Poyales et al13 95.5% and 100% for Akahoshi;14 and 90.9% and 100%, for Akahoshi,15 respectively. Our values, shown in Figure 3 were similar. For near vision (DCNVA), the percentages of eyes changed to 16.7% and 78.8%,13 53.3% and 86.6%,14 and 60.6% and 89.3%,15 respectively. Our values were closer to the percentages reported by Poyales et al13 (Caucasian population) than those found by Akahoshi.14,15 For other trifocal models, Sun et al9 for the AT LISA tri 839MP IOL, found postoperative mean CDVAs of 0.05±0.08 logMAR, 0.02±0.04 logMAR, and 0.02±0.04 logMAR in their groups (short, control and long, respectively), these figures being similar to those in our study (p=0.837). The mean values for DCNVA were 0.12±0.08 logMAR, 0.11±0.08 logMAR and 0.08±0.08 logMAR, respectively (p=0.160). Yang et al10 retrospectively evaluated 140 cataract eyes implanted with the AcrySof PanOptix IOL at 3 months post-surgery, and divided their sample according to axial length, into eyes with values of less than 24 mm (23 eyes) and eyes with values of ≥24 mm (47 eyes). They reported that there was no significant difference in UDVA and UNVA between the two groups (p>0.05). Lee et al11 with the AT LISA tri 839MP IOL, found that high axial length value correlates to lower UDVA (p=0.011) but not UNVA (p>0.05). Zhou et al12 with the AcrySof PanOptix reported mean DCVAs of 0.08±0.08D, 0.08±0.07D, and 0.06±0.06D, for their three groups, respectively, showing no statistically significant differences between them (p=0.468). In general, our results agree with those found by these authors looking at other trifocal IOLs. The outcomes for intermediate vision of the FineVision HP IOL has been found also good providing excellent visual acuity across multiple distances, providing a full range of focus.16
It has been reported that a long eye contributes to a large capsular bag and a higher chance of IOL rotation after cataract surgery,17–19 and eyes with greater axial lengths may present different accuracies depending on the IOL power formula used.20 Lin et al20 retrospectively compared the accuracy of the Barrett Universal II, Emmetropia Verifying Optical, Haigis, Kane, and SRK/T formulas for IOL power calculation in 175 eyes with high axial myopia. They divided the eyes into long axial length, from ≤26 mm to <28 mm, super long axial length, from ≤28 mm to <30 mm, and extremely long axial length, ≥30 mm. They found that the accuracy of the Emmetropia Verifying Optical 2.0 and Haigis formulas was stable, the SRK/T formula showed a negative trend in the long and super long axial length groups, whereas the Barrett Universal II, Kane, and SRK/T formulas showed positive trends in the extremely long axial length group. The axial length of the eyes considered in our study were not as long as these, and the majority fall into the first group of Lin et al20 (up to 28 mm). We cannot, therefore, support their conclusions that if the Barrett formula were used in our sample it would be accurate for high axial length eyes. Note also that it should be noted that axial length and keratometric data were obtained using either the IOLMaster 500 or 700. Although both instruments share similar measurement principles, the IOLMaster 700, based on swept-source OCT, has demonstrated superior accuracy and repeatability, particularly in eyes with high or low axial lengths and dense cataracts.21,22 This difference may introduce a source of variability in our biometry data.
We have to consider certain limitations of our study. Firstly, we analysed only one type of trifocal IOL and in the patients were all treated in a single centre; secondly, the intermediate visual acuity and defocus curves were not measured in our cohort and this information would be interesting for future studies; thirdly, a larger sample of eyes, specifically in the short and long axial length groups, and a longer follow-up would be desirable; and finally, the study considered both the spherical and toric models of the IOL using only one IOL power calculation formula; in the future, it would be desirable to assess two different groups as a function of the IOL model. Future studies should also consider analysing extremely short (<22 mm) and long (>29 mm) axial length eyes in order to determine whether this assumption could also be considered in these eyes.
Conclusions
In conclusion, our study has shown that the hydrophobic trifocal diffractive FineVision HP IOL provides good visual and refractive outcomes for eyes with different axial lengths using the Barrett Universal II formula. This conclusion should be kept in mind for cataract surgery and be used to justify the use of this IOL model, independently of the axial length of the eye.
Disclosure
Dr Camille Bosc reports personal fees from BVI, personal fees from Hoya Surgical, outside the submitted work. The authors report no other conflicts of interest in this work.
References
1. Daka Q, Henein C, Fang CEH. et al. Effectiveness of intraocular lenses designed to correct presbyopia after cataract surgery: an overview of systematic reviews. Br J Ophthalmol. 2025;109(12):1323–1329. doi:10.1136/bjo-2025-327363
2. Tavassoli S, Ziaei H, Yadegarfar ME, et al. Trifocal versus extended depth of focus (EDOF) intraocular lenses after cataract extraction. Cochrane Database Syst Rev. 2024;7(7):CD014891. doi:10.1002/14651858.CD014891.pub2
3. Li J, Sun B, Zhang Y, et al. Comparative efficacy and safety of all kinds of intraocular lenses in presbyopia-correcting cataract surgery: a systematic review and meta-analysis. BMC Ophthalmol. 2024;24(1):172. doi:10.1186/s12886-024-03446-1
4. Ristvedt D, Bosc C, Thompson V. Clinical outcomes of a hydrophobic trifocal diffractive intraocular lens: a literature review. Front Med. 2025;12:1533161. doi:10.3389/fmed.2025.1533161
5. Daya S, Chassain C, Pagnoulle C. Double C-loop haptic lenses are rotationally stable – a systematic review. Clin Ophthalmol. 2025;19:2259–2269. doi:10.2147/OPTH.S536114
6. Bosc C, Le Maléfan E, Boury P, Bernier M, Barrucand A. Visual performance correlation with corneal aberrometric profile and pupil size after implantation of a trifocal hydrophobic IOL. Clin Ophthalmol. 2024;18:4053–4061. doi:10.2147/OPTH.S500386
7. Abulafia A, Koch DD, Holladay JT, Wang L, Hill W. Pursuing perfection in intraocular lens calculations: IV. Rethinking astigmatism analysis for intraocular lens-based surgery: suggested terminology, analysis, and standards for outcome reports. J Cataract Refract Surg. 2018;44(10):1169–1174. doi:10.1016/j.jcrs.2018.07.027
8. Reinstein DZ, Archer TJ, Srinivasan S, et al. Standard for reporting refractive outcomes of intraocular lens-based refractive surgery. J Refract Surg. 2017;33(4):218–222. doi:10.3928/1081597X-20170302-01
9. Sun T, Liu Y, Zhao X, et al. Presbyopia-correcting performance and subjective outcomes of a trifocal intraocular lens in eyes with different axial lengths: a prospective cohort study. Front Med. 2022;9:980110. doi:10.3389/fmed.2022.980110
10. Yang YP, Tan Y, Liao Q. Analysis of visual quality improvement after implantation of PanOptix trifocal intraocular lens in cataract patients with different axial lengths. Am J Transl Res. 2024;16(7):2995–3004. doi:10.62347/FRJZ4885
11. Lee CY, Chen HC, Lian IB, Huang JY, Yang SF, Chang CK. The postoperative visual and refractive outcomes of trifocal and extended depth-of-focus intraocular lenses in patients with different biometric characteristics. Diagnostics. 2024;14(16):1717. doi:10.3390/diagnostics14161717
12. Zhou J, Zhan X, Huo Y, Ye J. Visual effects of trifocal intraocular lens implantation in cataract patients with different refractive states. BMC Ophthalmol. 2025;25(1):125. doi:10.1186/s12886-025-03963-7
13. Poyales F, Pérez R, López-Brea I, Zhou Y, Rico L, Garzón N. Comparison of visual performance and patient satisfaction outcomes with two trifocal IOLs with similar optical design but different materials. Clin Ophthalmol. 2020;14:3237–3247. doi:10.2147/OPTH.S273641
14. Akahoshi T. Refractive and visual outcomes using a trifocal, diffractive, hydrophobic intraocular lens in Japanese eyes. Clin Ophthalmol. 2024;18:1403–1415. doi:10.2147/OPTH.S464432
15. Akahoshi T. Hydrophobic trifocal toric intraocular lens outcomes in Japanese eyes after cataract surgery. Clin Ophthalmol. 2024;18:2021–2031. doi:10.2147/OPTH.S471846
16. Daya S, Espinosa Lagana M. Visual and refractive outcomes of a new hydrophobic trifocal toric intraocular lens. Clin Ophthalmol. 2024;18:997–1007. doi:10.2147/OPTH.S453565
17. Ucar F, Turgut Ozturk B. Effectiveness of toric IOL and capsular tension ring suturing technique for rotational stability in eyes with long axial length. Int Ophthalmol. 2023;43:2917–2924. doi:10.1007/s10792-023-02694-2
18. He S, Chen X, Wu X, Ma Y, Yu X, Xu W. Early-stage clinical outcomes and rotational stability of TECNIS toric intraocular lens implantation in cataract cases with long axial length. BMC Ophthalmol. 2020;20:204. doi:10.1186/s12886-020-01465-2
19. Vass C, Menapace R, Schmetterer K, Findl O, Rainer G, Steineck I. Prediction of pseudophakic capsular bag diameter based on biometric variables. J Cataract Refract Surg. 1999;25:1376–1381. doi:10.1016/S0886-3350(99)00204-7
20. Lin L, Xu M, Mo E, et al. Accuracy of newer generation IOL power calculation formulas in eyeswith high axial myopia. J Refract Surg. 2021;37:754–758. doi:10.3928/1081597X-20210712-08
21. Reitblat O, Assia EI, KleinmannG, Levy, A, Barrett GD, Abulafia A . Accuracy of predicted refraction with multifocal intraocular lenses using two biometry measurement devices and multiple intraocular lens power calculation formulas. Clin Exp Ophthalmol. 2015;43(4):328–334. doi:10.1111/ceo.12478
22. Kunert KS, Peter M, Blum M et al, et al. Repeatability and agreement in optical biometry of a new swept-source optical coherence tomography-based biometer versus partial coherence interferometry and optical low-coherence reflectometry. J Cataract Refract Surg. 2016;42(1):76–83. doi:10.1016/j.jcrs.2015.07.039
 © 2025 The Author(s). This work is published and licensed by Dove Medical Press Limited. The
full terms of this license are available at https://www.dovepress.com/terms
and incorporate the Creative Commons Attribution
- Non Commercial (unported, 4.0) License.
By accessing the work you hereby accept the Terms. Non-commercial uses of the work are permitted
without any further permission from Dove Medical Press Limited, provided the work is properly
attributed. For permission for commercial use of this work, please see paragraphs 4.2 and 5 of our Terms.
© 2025 The Author(s). This work is published and licensed by Dove Medical Press Limited. The
full terms of this license are available at https://www.dovepress.com/terms
and incorporate the Creative Commons Attribution
- Non Commercial (unported, 4.0) License.
By accessing the work you hereby accept the Terms. Non-commercial uses of the work are permitted
without any further permission from Dove Medical Press Limited, provided the work is properly
attributed. For permission for commercial use of this work, please see paragraphs 4.2 and 5 of our Terms.