Back to Journals » Neuropsychiatric Disease and Treatment » Volume 15
Vascular risk modulates the relationship between cerebral amyloid deposition and subjective memory complaints
Authors Kim JW ![]() , Byun MS
, Byun MS ![]() , Yi D
, Yi D ![]() , Lee JH, Ko K
, Lee JH, Ko K ![]() , Jung G
, Jung G ![]() , Lee DY
, Lee DY ![]()
Received 25 October 2018
Accepted for publication 19 December 2018
Published 4 March 2019 Volume 2019:15 Pages 637—645
DOI https://doi.org/10.2147/NDT.S192231
Checked for plagiarism Yes
Review by Single anonymous peer review
Peer reviewer comments 2
Editor who approved publication: Professor Taro Kishi
Jee Wook Kim,1,2 Min Soo Byun,3 Dahyun Yi,3 Jun Ho Lee,4 Kang Ko,4 Gijung Jung,5 Dong Young Lee3,4,6
On behalf of the KBASE Research Group
1Department of Neuropsychiatry, Hallym University Dongtan Sacred Heart Hospital, Hwaseong, Republic of Korea; 2Department of Psychiatry, Hallym University College of Medicine, Chuncheon, Republic of Korea; 3Institute of Human Behavioral Medicine, Medical Research Center, Seoul National University, Seoul, Republic of Korea; 4Department of Neuropsychiatry, Seoul National University Hospital, Seoul, Republic of Korea; 5Department of Nursing, Graduate School, Kyung Hee University, Seoul, Republic of Korea; 6Department of Psychiatry, Seoul National University College of Medicine, Seoul, Republic of Korea
Purpose: We aimed to investigate the relationships of cerebral amyloid beta (Aβ) deposition and neurodegeneration (ND) with subjective memory complaints (SMCs) in cognitively normal (CN) individuals, focusing specially on the modulating effects of vascular risk (VR) on those relationships.
Participants and methods: A total of 230 CN elderly individuals underwent comprehensive clinical assessments including the Subjective Memory Complaints Questionnaire (SMCQ), VR assessment, and multimodal brain imaging including [11C] Pittsburgh compound B positron emission tomography (PET), [18F] fluorodeoxyglucose-PET, and magnetic resonance imaging.
Results: We found a significant overall positive association between cerebral Aβ retention and SMCQ score. In addition, we found a significant cerebral Aβ retention × VR interaction effect on the SMCQ score. Subgroup analyses showed that the Aβ–SMC association was found only in VR-negative, and not in VR-positive, individuals. We found no relationship between ND and SMCQ.
Conclusion: Our findings suggest that SMC in CN elderly individuals reflects early accumulation of Aβ in the brain. Given the modulating effect of VR on the Aβ–SMC relationship, SMC can be used as a meaningful marker of early Aβ deposition in individuals without VR.
Keywords: subjective memory complaints, amyloid beta, vascular risk, Alzheimer’s disease, cognitively normal
Introduction
Recent studies have suggested that subjective memory complaints (SMCs) may be an earlier manifestation of Alzheimer’s disease (AD), prior to objective cognitive impairment.1–6 Because cerebral amyloid beta (Aβ) deposition is one of the earliest key pathologies of AD, beginning ~15 years prior to the onset of the cognitive symptoms associated with AD,7–9 SMC may be the first symptomatic manifestation of brain Aβ deposition in cognitively normal (CN) individuals. Nevertheless, the relationship between brain Aβ deposition and SMC remains controversial. Although some studies have reported a positive association between in vivo cerebral Aβ deposition and SMC in CN individuals,10,11 others have found no such relationship.12,13
Specific regional neurodegeneration (ND), including neuronal injury and dysfunction related to neurofibrillary tangles,8 is another brain change associated with AD.14 Several studies have reported that ND was associated with SMC in CN older individuals.15–17 However, in one recent study that included postmortem pathological investigation, although brain Aβ deposition was associated with SMC, neurofibrillary tangles were not.18 Thus, the relationship between ND and SMC remains unclear.
Cerebrovascular (CV) pathologies are frequently found with AD pathologies.19 Given that CV lesions can decrease metacognition or increase anosognosia,20,21 related vascular risk (VR) factors may alter the relationship between AD pathologies and SMC. High VR burden has been associated with cortical thinning or white matter damage in the prefrontal region,22–24 which is known as a neuroanatomical substrate of metacognition or anosognosia.25–28 To date, however, no studies have examined the modulating effect of VR on the relationship of AD pathologies with SMC.
In this context, we aimed to investigate the relationships of cerebral Aβ deposition and AD-specific ND with SMC in CN middle-aged and older individuals, focusing on the modulating effects of VR factors on that relationship.
Methods
Participants
This study was part of the Korean Brain Aging Study for Early Diagnosis and Prediction of Alzheimer’s Disease (KBASE), an ongoing prospective cohort study, which started in 2014. The study was designed to identify novel biomarkers for AD and to explore various lifetime experiences contributing to AD-related brain changes.29 In total, 230 CN older individuals were included in this study. Inclusion criteria were 1) aged 55–90 years (inclusive); 2) Clinical Dementia Rating score of 030 and no diagnosis of MCI or dementia; and 3) Geriatric Depression Scale (GDS) score of 0–10 (within the normal range).31 The exclusion criteria were 1) any present serious medical, psychiatric, or neurological disorder that could affect mental functioning; 2) any history of loss of consciousness after head trauma; 3) severe communication problems that would make a clinical examination or brain scan difficult; 4) contraindications for a magnetic resonance imaging (MRI) scan; 5) absence of a reliable informant; 6) illiteracy; and 7) participation in another clinical trial and treatment with an investigational product.
The study protocol was approved by the Institutional Review Boards of Seoul National University Hospital and SNU-SMG Boramae Center, Seoul, South Korea. The study was conducted in accordance with the recommendations of the current version of the Declaration of Helsinki. All subjects provided written informed consent.
Clinical assessments
All participants underwent standardized clinical assessments by trained psychiatrists based on the KBASE clinical assessment protocol, which incorporated the Korean version of the Consortium to Establish a Registry for Alzheimer’s Disease assessment packet (CERAD-K).32,33 The KBASE neuropsychological assessment protocol incorporating the CERAD-K neuropsychological battery34 was also administered to all participants by trained neuropsychologists. Among the eight items of the CERAD neuropsychological battery, the Mini-Mental State Examination was used to evaluate global cognition.35 The GDS,31,36 a reliable and valid questionnaire for screening depression, was used to measure the severity of depressive symptoms.
The Subjective Memory Complaints Questionnaire (SMCQ)37 was used to evaluate SMC. The SMCQ is a reliable and valid, brief, self-rated questionnaire comprising 14 items reflecting various aspects of SMC. Four items of the SMCQ assess global memory function, and the other ten items assess everyday memory function. To enhance the feasibility and reliability of each item for elderly individuals, subjects’ responses to each question were restricted to either yes or no. The highest SMCQ score is 14 points, and higher scores indicate more severe SMC.
All participants were also systematically assessed by trained nurses for medical comorbidities including VR factors such as hypertension, diabetes, dyslipidemia, coronary heart disease, transient ischemic attack, and stroke. The VR score was calculated as the number of the VR factors present, ranging from 0 to 6.38 Each participant was classified as VR negative (VR−) if the VR score was 0 or as VR positive (VR+) if the VR score was ≥1.
APOE4 genotyping
Blood samples were obtained via venipuncture. Genomic DNA was extracted from whole blood and apolipoprotein E (APOE) genotyping was performed as described previously.39 APOE ε4 (APOE4) positivity was coded if at least one ε4 allele was present.
Measurement of cerebral Aβ deposition
Participants underwent simultaneous three-dimensional (3D) [11C] Pittsburgh compound B (PiB) positron emission tomography (PET) and 3D T1-weighted MRI using a 3.0T Biograph mMR (PET-MR) scanner (Siemens, Washington, DC, USA) according to the manufacturer’s guidelines. Details of PiB-PET image acquisition and preprocessing are described in the Supplementary material.
The automatic anatomic labeling algorithm and a region-combining method40 were applied to determine regions of interest (ROIs) to characterize the PiB retention level in the frontal, lateral parietal, posterior cingulate-precuneus, and lateral temporal regions. The standardized uptake value ratio (SUVR) for each ROI was calculated by dividing the mean value for all voxels within the ROI by the mean cerebellar uptake value in the same image. Each participant was classified as Aβ positive (Aβ+) if the SUVR value was >1.4 in at least one of the four ROIs or as Aβ negative (Aβ−) if the SUVR values was ≤1.4 for all four ROIs.40,41 A global cortical ROI comprising the four ROIs was also defined, and a global cerebral Aβ retention value was generated by dividing the mean value for all voxels of the global cortical ROI by the mean cerebellar uptake value in the same image.
Measurement of AD-associated ND
Participants also underwent simultaneous [18F] fluorodeoxyglucose (FDG)-PET and MRI using the same PET-MR machine described above. Details of FDG-PET image acquisition and preprocessing are described in the Supplementary material. Voxel-weighted mean SUVRs of the AD-signature FDG ROIs (AD-signature cerebral glucose metabolism [AD-CM]) known to be sensitive to changes associated with AD,42 which include the angular gyri, posterior cingulate cortex, and inferior temporal gyri, were calculated.
Details of MRI acquisition and preprocessing are described in the Supplementary material. AD-signature cortical thickness (AD-CT) was defined as mean cortical thickness values obtained from AD-signature regions, including the entorhinal, inferior temporal, middle temporal, and fusiform gyrus regions, according to a previous study.42
Statistical analyses
To evaluate the differences between the Aβ+ and Aβ− groups, we compared the continuous variables using independent t-tests and the categorical variables using chi-squared or Fisher’s exact tests. To examine the relationships of cerebral Aβ deposition, AD-CM, and AD-CT with SMCQ scores, we performed two-step statistical analyses. Before the analysis, the global cerebral Aβ retention value was natural log transformed to reduce any skewness in the distributions. Then, in the first step, we conducted Pearson correlation analyses to explore the associations of imaging markers, including global cerebral Aβ retention, AD-CM, and AD-CT, with SMCQ scores. Based on the results of these preliminary exploratory analyses, imaging variables with P<0.1 were selected for the second step, ie, multivariate analysis. In the second step, we tested multiple linear regression model(s) with the imaging marker(s) selected from the first step as independent variable and the SMCQ score as the dependent variable, controlling for age, gender, education, APOE4 positivity, GDS score, and VR score. To assess the modulating effects of VR on the relationships between selected imaging marker(s) and SMCQ score, we also tested multiple linear regression model(s) including imaging marker × VR score interaction term as well as imaging maker(s) and VR score as independent variables, with SMCQ score as the dependent variable, controlling for age, gender, education, APOE4 positivity, and GDS score as covariates. For the second-step analyses, we applied a strict threshold by using the Bonferroni correction for multiple testing (P<0.05/number of imaging marker(s) selected from the first exploratory step of analyses). When the model including the interaction term as an independent variable was significant, additional subgroup analyses were performed for the VR− and VR+ groups by using a multiple linear regression model controlling for age, gender, education, APOE4 positivity, and GDS score as covariates. For these subgroup analyses, we also applied the Bonferroni correction for the statistical threshold (ie, P<0.05/2). All statistical analyses were performed using IBM SPSS Statistics 24 (IBM Corporation, Armonk, NY, USA).
Results
Participant characteristics
The demographic and clinical characteristics of the participants are presented in Table 1. Participants included 114 women and 108 men ranging in age from 55 to 87 years. The SMCQ score of the Aβ+ group was significantly higher than that of the Aβ− group.
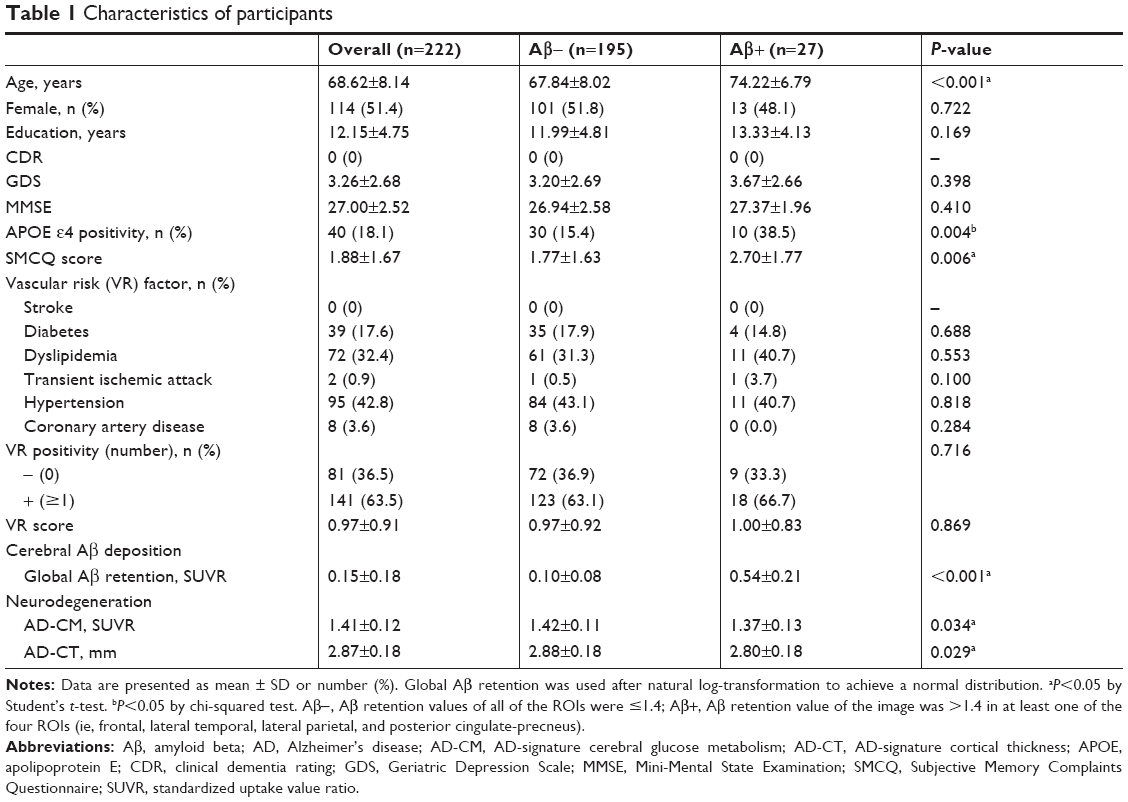 | Table 1 Characteristics of participants |
Exploratory univariate analyses
In the first exploratory step of the analyses using Pearson’s correlation, we found that the association between global Aβ retention and SMCQ score was below the significance threshold (P<0.10). However, we found no such association between AD-CM and SMCQ score or between AD-CT and SMCQ score (Table 2).
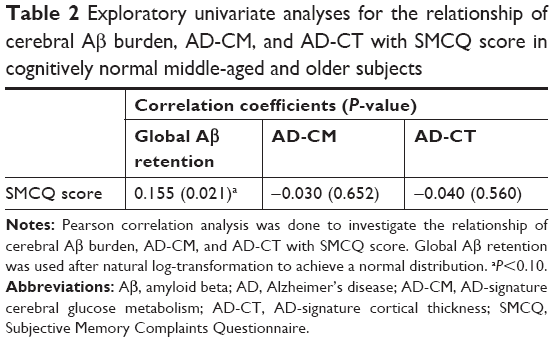 | Table 2 Exploratory univariate analyses for the relationship of cerebral Aβ burden, AD-CM, and AD-CT with SMCQ score in cognitively normal middle-aged and older subjects |
Confirmatory multivariate analysis
Based on the results from first step, we selected global Aβ retention as the candidate imaging marker for further analysis of imaging biomarker–SMC associations. Multiple linear regression analysis revealed that the association of global Aβ retention with SMCQ score was significant even after controlling for the effects of age, gender, education, APOE4 positivity, GDS score, and VR score (Table 3).
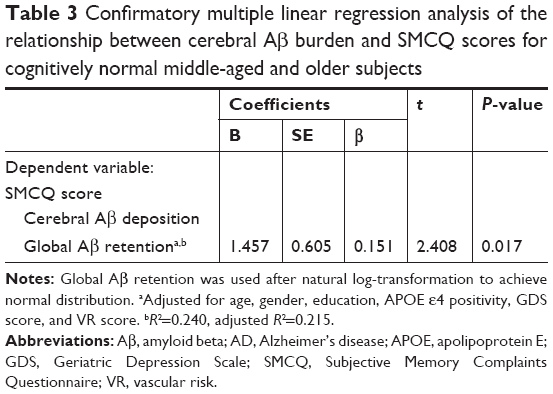 | Table 3 Confirmatory multiple linear regression analysis of the relationship between cerebral Aβ burden and SMCQ scores for cognitively normal middle-aged and older subjects |
Modulating effect of VR
Multiple linear regression analysis including the interaction term revealed that the global Aβ retention V × R score interaction effect on SMCQ score was statistically significant after controlling for age, gender, education, APOE4 positivity, and GDS score (Table 4). Subgroup analyses showed that global Aβ retention exhibited a significant positive association with SMCQ score in the VR− group, but not in the VR+ group, after applying the Bonferroni correction for statistical threshold (P<0.025) (Table 5; Figure 1).
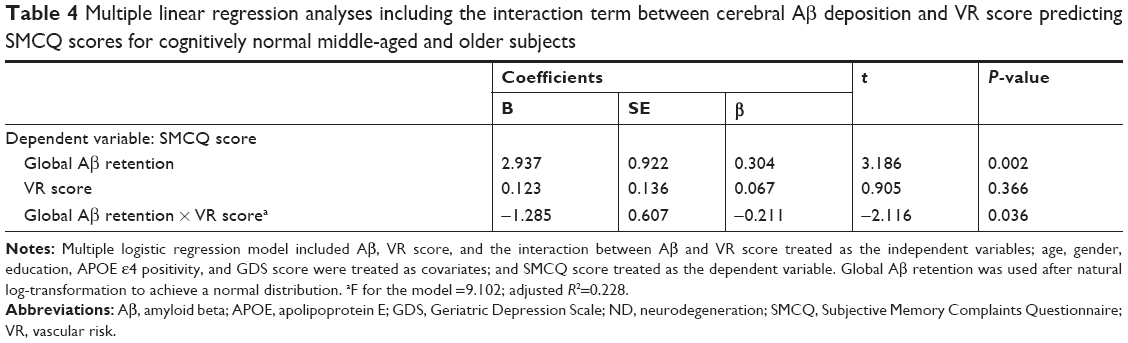 | Table 4 Multiple linear regression analyses including the interaction term between cerebral Aβ deposition and VR score predicting SMCQ scores for cognitively normal middle-aged and older subjects |
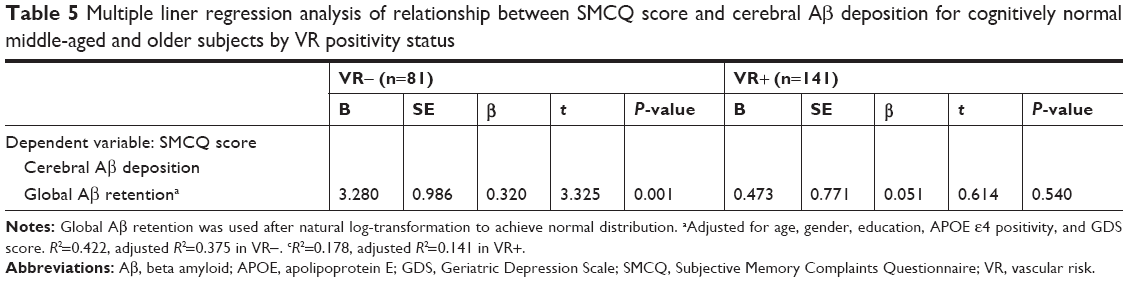 | Table 5 Multiple liner regression analysis of relationship between SMCQ score and cerebral Aβ deposition for cognitively normal middle-aged and older subjects by VR positivity status |
 | Figure 1 Partial regression plots showing the relationship between cerebral Aβ deposition and SMCQ score in cognitively normal middle- and old-aged individuals by VR positivity status. |
Discussion
In this study, we found an overall positive cerebral Aβ–SMC association in CN middle-aged and older individuals. More specifically, VR had a significant modulating effect on the Aβ–SMC association. Furthermore, the Aβ–SMC association was found only in the VR− subgroup, but not in VR+ one. Meanwhile, we found no association between AD-associated ND and SMC.
To the best of our knowledge, this is the first study to reveal the modulating effect of VR on the Aβ–SMC association. This finding may be explained as follows. In the individuals with VR, CV pathology may alter metacognition or related neural substrates, ie, mainly the prefrontal regions,20,21,25–28 resulting in diminished awareness of subtle cognitive changes related to cerebral Aβ accumulation. In contrast, those without VR may easily recognize cerebral Aβ-related early cognitive changes because there is little vascular influence on metacognition.
Although our finding of a positive Aβ–SMC association is in line with several previous studies,10,11,18 some earlier studies did not identify a similar association.12,13 However, although it was not statistically significant, these negative studies reported a trend toward an Aβ–SMC association.12,13 Some methodological differences, such as differences in the definition and assessment of SMC and in subject characteristics, may have contributed to these discrepant findings. Based on our finding regarding the modulating effect of VR on the Aβ–SMC relationship, differences between studied subjects’ vascular burden may also explain the discrepancy. It is possible that the studies including subjects with no or low VR or CV burden tended to show a positive Aβ–SMC association, whereas those including subjects with a high burden did not. However, we cannot confirm this possibility because the information about VR factors or CV burden was limited in most previous studies.
In contrast to the Aβ–SMC association, we did not observe any relationship between AD-associated ND and SMC. Although a recent investigation did not show any association between neurofibrillary tangles on postmortem brain and antemortem SMC,18 which is in line with our findings, some other studies have reported an ND–SMC association in CN individuals.15–17 This discrepancy may be related to the age distribution of subjects. Given the close association between aging and ND,43–45 our subjects, who were middle-aged as well as older individuals, would probably be less vulnerable to, and have milder, ND than would those in other studies who were only elderly subjects.15–17 Therefore, the degree of ND in our CN subjects may have been too small to influence SMC. The discrepancy could also be due to different methods for controlling depression as a covariate. Depression was associated with increased SMC even in study populations that excluded individuals with major depressive disorder (MDD).46,47 In addition, depression is known to be related to regional brain atrophy or dysfunction caused by the ND process.48–50 Therefore, to clarify the ND–SMC relationship, depression should be properly controlled as a potential confounder. Some previous studies that reported a positive ND–SMC association did not control for sub-threshold depression,15,17 whereas we controlled for GDS score as a covariate even after excluding individuals with MDD. In one study, the ND–SMC association was significant before, but not after, adjusting for GDS score.17
The present study has a limitation that should be considered. This was a cross-sectional study, which makes it difficult to determine causal relationships from our findings. To elucidate the nature of the associations between cerebral Aβ, ND, and SMC, further longitudinal follow-up studies will be necessary. Nevertheless, consideration of VR as a key modulator for the AD pathology–SMC relationship, the large study population, and the use of multimodal brain imaging including PiB-PET, FDG-PET, and MRI are strengths of this study.
Conclusion
Our findings suggest that SMC in CN middle-aged and older individuals reflects early accumulation of Aβ in the brain. Given the modulating effect of VR on the Aβ–SMC relationship, SMC can be used as a meaningful marker of early Aβ deposition or preclinical AD in the individuals with no or very low VR.
Acknowledgments
This study was supported by a grant from the Ministry of Science, ICT, and Future Planning (Grant No: NRF-2014M3C7A1046042). The funding sources had no role in the study design, data collection, data analysis, data interpretation, writing of the manuscript, or decision to submit it for publication. The authors thank the coinvestigators of the KBASE Research Group who are listed at http://kbase.kr/eng/about/research.php.
Author contributions
JWK and DYL designed the study and JWK wrote the study protocol. JWK and DYL wrote the draft of the manuscript and undertook the statistical analyses. MSB, DY, JHL, KK, and GJ collected and analyzed the data. All authors contributed toward data analysis, drafting and critically revising the paper, gave final approval of the version to be published, and agreed to be accountable for all aspects of the work.
Disclosure
The authors report no conflicts of interest in this work.
References
Jessen F, Wiese B, Bachmann C, et al. Prediction of dementia by subjective memory impairment: effects of severity and temporal association with cognitive impairment. Arch Gen Psychiatry. 2010;67(4):414–422. | ||
Jessen F, Wolfsgruber S, Wiese B, et al. AD dementia risk in late MCI, in early MCI, and in subjective memory impairment. Alzheimers Dement. 2014;10(1):76–83. | ||
Reid LM, Maclullich AM. Subjective memory complaints and cognitive impairment in older people. Dement Geriatr Cogn Disord. 2006;22(5–6):471–485. | ||
Reisberg B, Prichep L, Mosconi L, et al. The pre-mild cognitive impairment, subjective cognitive impairment stage of Alzheimer’s disease. Alzheimers Dement. 2008;4(1 Suppl 1):S98–S108. | ||
Jessen F, Amariglio RE, van Boxtel M, et al. A conceptual framework for research on subjective cognitive decline in preclinical Alzheimer’s disease. Alzheimers Dement. 2014;10(6):844–852. | ||
Winblad B, Palmer K, Kivipelto M, et al. Mild cognitive impairment – beyond controversies, towards a consensus: report of the International Working Group on Mild Cognitive Impairment. J Intern Med. 2004;256(3):240–246. | ||
Tobiansky R, Blizard R, Livingston G, Mann A. The Gospel Oak Study stage IV: the clinical relevance of subjective memory impairment in older people. Psychol Med. 1995;25(4):779–786. | ||
Braak H, Braak E. Neuropathological staging of Alzheimer-related changes. Acta Neuropathol. 1991;82(4):239–259. | ||
Jack CR, Knopman DS, Jagust WJ, et al. Hypothetical model of dynamic biomarkers of the Alzheimer’s pathological cascade. Lancet Neurol. 2010;9(1):119–128. | ||
Perrotin A, Mormino EC, Madison CM, Hayenga AO, Jagust WJ. Subjective cognition and amyloid deposition imaging: a Pittsburgh compound B positron emission tomography study in normal elderly individuals. Arch Neurol. 2012;69(2):223–229. | ||
Amariglio RE, Becker JA, Carmasin J, et al. Subjective cognitive complaints and amyloid burden in cognitively normal older individuals. Neuropsychologia. 2012;50(12):2880–2886. | ||
Chételat G, Villemagne VL, Bourgeat P, et al. Relationship between atrophy and beta-amyloid deposition in Alzheimer disease. Ann Neurol. 2010;67(3):317–324. | ||
Rodda J, Okello A, Edison P, Dannhauser T, Brooks DJ, Walker Z. (11)C-PIB PET in subjective cognitive impairment. Eur Psychiatry. 2010;25(2):123–125. | ||
Blennow K, de Leon MJ, Zetterberg H. Alzheimer’s disease. Lancet. 2006;368(9533):387–403. | ||
van der Flier WM, van Buchem MA, Weverling-Rijnsburger AW, et al. Memory complaints in patients with normal cognition are associated with smaller hippocampal volumes. J Neurol. 2004;251(6):671–675. | ||
Scheef L, Spottke A, Daerr M, et al. Glucose metabolism, gray matter structure, and memory decline in subjective memory impairment. Neurology. 2012;79(13):1332–1339. | ||
Amariglio RE, Mormino EC, Pietras AC, et al. Subjective cognitive concerns, amyloid-β, and neurodegeneration in clinically normal elderly. Neurology. 2015;85(1):56–62. | ||
Kryscio RJ, Abner EL, Cooper GE, et al. Self-reported memory complaints: implications from a longitudinal cohort with autopsies. Neurology. 2014;83(15):1359–1365. | ||
Attems J, Jellinger KA. The overlap between vascular disease and Alzheimer’s disease – lessons from pathology. BMC Med. 2014;12:206. | ||
Barrett AM. Rose-colored answers: neuropsychological deficits and patient-reported outcomes after stroke. Behav Neurol. 2010;22(1–2):17–23. | ||
Orfei MD, Caltagirone C, Spalletta G. The evaluation of anosognosia in stroke patients. Cerebrovasc Dis. 2009;27(3):280–289. | ||
Gonzalez CE, Pacheco J, Beason-Held LL, Resnick SM. Longitudinal changes in cortical thinning associated with hypertension. J Hypertens. 2015;33(6):1242–1248. | ||
Beauchet O, Celle S, Roche F, et al. Blood pressure levels and brain volume reduction: a systematic review and meta-analysis. J Hypertens. 2013;31(8):1502–1516. | ||
Li X, Ma C, Sun X, et al. Disrupted white matter structure underlies cognitive deficit in hypertensive patients. Eur Radiol. 2016;26(9):2899–2907. | ||
Rosen HJ. Anosognosia in neurodegenerative disease. Neurocase. 2011;17(3):231–241. | ||
Fleming SM, Dolan RJ. The neural basis of metacognitive ability. Philos Trans R Soc Lond B Biol Sci. 2012;367(1594):1338–1349. | ||
Hoerold D, Pender NP, Robertson IH. Metacognitive and online error awareness deficits after prefrontal cortex lesions. Neuropsychologia. 2013;51(3):385–391. | ||
Fleming SM, Huijgen J, Dolan RJ. Prefrontal contributions to metacognition in perceptual decision making. J Neurosci. 2012;32(18):6117–6125. | ||
Byun MS, Yi D, Lee JH, et al. Korean brain aging study for the early diagnosis and prediction of Alzheimer’s disease: methodology and baseline sample characteristics. Psychiatry Investig. 2017;14(6):851–863. | ||
Morris JC. The Clinical Dementia Rating (CDR): current version and scoring rules. Neurology. 1993;43(11):2412–2414. | ||
Yesavage JA, Brink TL, Rose TL, et al. Development and validation of a geriatric depression screening scale: a preliminary report. J Psychiatr Res. 1982;17(1):37–49. | ||
Morris JC, Heyman A, Mohs RC, et al. The Consortium to Establish a Registry for Alzheimer’s Disease (CERAD). Part I. Clinical and neuropsychological assessment of Alzheimer’s disease. Neurology. 1989;39(9):1159–1165. | ||
Lee JH, Lee KU, Lee DY, et al. Development of the Korean version of the Consortium to Establish a Registry for Alzheimer’s Disease Assessment Packet (CERAD-K): clinical and neuropsychological assessment batteries. J Gerontol B Psychol Sci Soc Sci. 2002;57(1):P47–P53. | ||
Lee DY, Lee KU, Lee JH, et al. A normative study of the CERAD neuropsychological assessment battery in the Korean elderly. J Int Neuropsychol Soc. 2004;10(1):72–81. | ||
Lee Dy LK, Lee JH, Kim KW. A normative study of the mini-mental state examination in the Korean elderly. J Korean Neuropsychiatr Assoc. 2002;41(3):508–522. | ||
Kim JY, Park JH, Lee JJ, et al. Standardization of the Korean version of the Geriatric Depression Scale: reliability, validity, and factor structure. Psychiatry Investig. 2008;5(4):232–238. | ||
Youn JC, Kim KW, Lee DY, et al. Development of the subjective memory complaints questionnaire. Dement Geriatr Cogn Disord. 2009;27(4):310–317. | ||
Decarli C, Mungas D, Harvey D, et al. Memory impairment, but not cerebrovascular disease, predicts progression of MCI to dementia. Neurology. 2004;63(2):220–227. | ||
Wenham PR, Price WH, Blandell G. Apolipoprotein E genotyping by one-stage PCR. Lancet. 1991;337(8750):1158–1159. | ||
Reiman EM, Chen K, Liu X, et al. Fibrillar amyloid-beta burden in cognitively normal people at 3 levels of genetic risk for Alzheimer’s disease. Proc Natl Acad Sci U S A. 2009;106(16):6820–6825. | ||
Choe YM, Sohn BK, Choi HJ, et al. Association of homocysteine with hippocampal volume independent of cerebral amyloid and vascular burden. Neurobiol Aging. 2014;35(7):1519–1525. | ||
Jack CR, Wiste HJ, Weigand SD, et al. Age-specific population frequencies of cerebral β-amyloidosis and neurodegeneration among people with normal cognitive function aged 50–89 years: a cross-sectional study. Lancet Neurol. 2014;13(10):997–1005. | ||
Ward RJ, Dexter DT, Crichton RR. Ageing neuroinflammation and neurodegeneration. Front Biosci (Schol Ed). 2015;7(1):189–204. | ||
Wyss-Coray T, Ageing W-CT. Ageing, neurodegeneration and brain rejuvenation. Nature. 2016;539(7628):180–186. | ||
Hung CW, Chen YC, Hsieh WL, Chiou SH, Kao CL. Ageing and neurodegenerative diseases. Ageing Res Rev. 2010;9 Suppl 1(Suppl 1):S36–S46. | ||
Minett TS, Da Silva RV, Ortiz KZ, Bertolucci PH. Subjective memory complaints in an elderly sample: a cross-sectional study. Int J Geriatr Psychiatry. 2008;23(1):49–54. | ||
Comijs HC, Deeg DJ, Dik MG, Twisk JW, Jonker C. Memory complaints; the association with psycho-affective and health problems and the role of personality characteristics. A 6-year follow-up study. J Affect Disord. 2002;72(2):157–165. | ||
Egger K, Schocke M, Weiss E, et al. Pattern of brain atrophy in elderly patients with depression revealed by voxel-based morphometry. Psychiatry Res. 2008;164(3):237–244. | ||
Lee HS, Choo IH, Lee DY, et al. Frontal dysfunction underlies depression in mild cognitive impairment: a FDG-PET study. Psychiatry Investig. 2010;7(3):208–214. | ||
Zhou H, Li R, Ma Z, Rossi S, Zhu X, Li J. Smaller gray matter volume of hippocampus/parahippocampus in elderly people with subthreshold depression: a cross-sectional study. BMC Psychiatry. 2016;16:219. |
Supplementary material
Image acquisition and preprocessing
[11C] Pittsburg compound B (PiB) – positron emission tomography (PET) image acquisition and preprocessing
Participants underwent simultaneous three-dimensional (3D) PiB-PET and 3D T1-weighted magnetic resonance (MR) imaging using a 3.0T Biograph mMR scanner (PET-MR scanner; Siemens, Washington DC, USA) according to the manufacturer’s approved guidelines. After intravenous administration of 555 MBq of [11C] PiB (range, 450–610 MBq), a 30-minute emission scan was obtained 40 minutes after injection. The PiB-PET data collected in list mode were processed for routine corrections such as uniformity, ultrashort echo time-based attenuation, and decay corrections and were reconstructed into a 256×256 image matrix using iterative methods (6 iterations with 21 subsets). The following image preprocessing steps were performed using Statistical Parametric Mapping 8 (SPM8; http://www.fil.ion.ucl.ac.uk/spm) implemented in Matlab 2014a (Mathworks, Natick, MA, USA). Static PiB-PET images were co-registered to individual T1 structural images and transformation parameters for the spatial normalization of individual T1 images to a standard Montreal Neurological Institute (MNI) template were calculated. Using IBASPM software, we used the inverse transformation parameters to transform coordinates from the automatic anatomic labeling (AAL) 116 atlas5 into an individual space for each subject (a resampling voxel size =1×0.98×0.98 mm), and the non-gray matter portions of the atlas were individually masked using the cerebral gray matter segment image from each subject. The mean regional 11C-PiB uptake values from cerebral regions were extracted using the individual AAL116 atlas from T1-coregistered PiB-PET images. Cerebellar gray matter was used as the reference region for quantitative normalization of cerebral PiB uptake values due to its relatively low Aβ deposition.3 To measure PiB uptake in the cerebellar gray matter regions, a probabilistic cerebellar atlas (Institute of Cognitive Neuroscience, UCL; Cognitive Neuroscience Laboratory, Royal Holloway) was transformed into individual space in the same manner as described above. Of the 28 anatomical structural regions in the cerebellar atlas, all cerebellar lobular regions except the vermis were included to extract the mean cerebellar uptake values.
[18F] Fluorodeoxyglucose (FDG)-PET image acquisition and preprocessing
The participants fasted for at least 6 hours and rested in a waiting room for 40 minutes prior to the scans after intravenous administration of 0.1 mCi/kg of [18F] FDG radioligands. The PET data collected in list mode (5 minutes × 4 frames) were processed for routine corrections such as uniformity, ultrashort echo time-based attenuation, and decay corrections. After inspecting the data for any significant head movements, we reconstructed them into a 20-minute summed image using iterative methods (6 iterations with 21 subsets). The following image processing steps were performed using SPM12 implemented in Matlab 2014a (Mathworks). First, static FDG-PET images were co-registered to individual T1 structural images, and transformation parameters for the spatial normalization of individual T1 images to a standard MNI template were calculated and used to spatially normalize the PET images to the MNI template. After smoothing the spatially normalized FDG-PET images with a 12-mm Gaussian filter, intensity normalization was performed using the pons as the reference region.
MR image acquisition and preprocessing
All T1-weighted images were acquired in the sagittal orientation using the abovementioned 3.0T PET-MR machine. MR image acquisition parameters were as follows: repetition time =1,670 ms, echo time =1.89 ms, field of view 250 mm, and 256×256 matrix with 1.0-mm slice thickness. All MR images were automatically segmented using FreeSurfer version 5.3 (http://surfer.nmr.mgh.harvard.edu/) with manual correction of minor segmentation errors. Based on the Desikan–Killiany atlas,1 mean cortical thickness values were obtained from Alzheimer’s disease (AD)-signature regions, including the entorhinal, inferior temporal, middle temporal, and fusiform gyrus according to a previous study.2
Definition of threshold for neurodegeneration biomarkers abnormality
Receiver operating characteristic (ROC) curve analyses of two neurodegeneration biomarkers – cerebral glucose metabolism (CMglu) in the AD-signature FDG region of interest (ROI) and AD-signature cortical thickness – were performed to determine the optimal threshold that can distinguish the AD dementia from the cognitively normal (CN) elderly individuals. For these ROC analyses, data from AD dementia subjects and CN subjects in KBASE cohort were used. Inclusion criteria for the AD dementia group were as follows: 1) aged 55–90 years (inclusive), 2) Clinical Dementia Rating (CDR) score 0.5 or 1, and 3) Probable AD dementia according to the National Institute of Aging and the Alzheimer’s Association (NIA-AA) diagnostic criteria for AD.4 Inclusion criteria for CN and exclusion criteria for both the groups are described in the manuscript.
To set the threshold of the standardized uptake value ratio (SUVR) value in the AD-signature FDG ROI that can distinguish AD dementia from CN, data from 58 AD dementia subjects (mean age: 72.9±8.1 years; female/male: 41/17; global CDR 0.8±0.2) and 260 CN subjects (mean age: 68.7±8.0 years; female/male: 134/126; global CDR 0.0±0.0) were used. Using CN subjects as the reference group, we set the optimal cutoff point of SUVR in the AD-signature FDG ROI based on the Youden index at 1.386 (sensitivity 91.4%). In terms of cutoff point of AD-signature cortical thickness used to distinguish AD dementia from CN, data from 52 subjects with AD dementia (mean age: 72.5±8.2 years; female/male: 36/16; global CDR 0.8±0.2) and 254 CN subjects (mean age: 68.6±8.0 years; female/male: 132/122; global CDR 0.0±0.0) were used for ROC curve analysis. Using CN subjects as the reference group, we set the optimal cutoff point of AD-signature cortical thickness based on the Youden index at 2.666 mm (sensitivity 92.3%).
References
Desikan RS, Segonne F, Fischl B, et al. An automated labeling system for subdividing the human cerebral cortex on MRI scans into gyral based regions of interest. Neuroimage. 2006;31(3):968–980. | ||
Jack CR Jr, Wiste HJ, Weigand SD, et al. Age-specific population frequencies of cerebral beta-amyloidosis and neurodegeneration among people with normal cognitive function aged 50–89 years: a cross-sectional study. Lancet Neurol. 2014;13(10):997–1005. | ||
Lopresti BJ, Klunk WE, Mathis CA, et al. Simplified quantification of Pittsburgh compound B amyloid imaging PET studies: a comparative analysis. J Nucl Med. 2005;46(12):1959–1972. | ||
McKhann GM, Knopman DS, Chertkow H, et al. The diagnosis of dementia due to Alzheimer’s disease: recommendations from the National Institute on Aging-Alzheimer’s Association workgroups on diagnostic guidelines for Alzheimer’s disease. Alzheimers Dement. 2011;7(3):263–269. | ||
Tzourio-Mazoyer N, Landeau B, Papathanassiou D, et al. Automated anatomical labeling of activations in SPM using a macroscopic anatomical parcellation of the MNI MRI single-subject brain. Neuroimage. 2002;15(1):273–289. |
 © 2019 The Author(s). This work is published and licensed by Dove Medical Press Limited. The
full terms of this license are available at https://www.dovepress.com/terms
and incorporate the Creative Commons Attribution
- Non Commercial (unported, 3.0) License.
By accessing the work you hereby accept the Terms. Non-commercial uses of the work are permitted
without any further permission from Dove Medical Press Limited, provided the work is properly
attributed. For permission for commercial use of this work, please see paragraphs 4.2 and 5 of our Terms.
© 2019 The Author(s). This work is published and licensed by Dove Medical Press Limited. The
full terms of this license are available at https://www.dovepress.com/terms
and incorporate the Creative Commons Attribution
- Non Commercial (unported, 3.0) License.
By accessing the work you hereby accept the Terms. Non-commercial uses of the work are permitted
without any further permission from Dove Medical Press Limited, provided the work is properly
attributed. For permission for commercial use of this work, please see paragraphs 4.2 and 5 of our Terms.