Back to Journals » Patient Preference and Adherence » Volume 9
Variation in medication adherence across patient behavioral segments: a multi-country study in hypertension
Received 27 June 2015
Accepted for publication 2 September 2015
Published 29 October 2015 Volume 2015:9 Pages 1539—1548
DOI https://doi.org/10.2147/PPA.S91284
Checked for plagiarism Yes
Review by Single anonymous peer review
Peer reviewer comments 2
Editor who approved publication: Dr Johnny Chen
Robert Sandy, Ulla Connor
CoMac Analytics, Inc, Providence, RI, USA
Objectives: This study determines the following for a hypertensive patient population: 1) the prevalence of patient worldview clusters; 2) differences in medication adherence across these clusters; and 3) the adherence predictive power of the clusters relative to measures of patients’ concerns over their medication’s cost, side effects, and efficacy.
Methods: Members from patient panels in the UK, Germany, Italy, and Spain were invited to participate in an online survey that included the Medication Adherence Report Scale-5 (MARS-5) adherence instrument and a patient segmentation instrument developed by CoMac Analytics, Inc, based on a linguistic analysis of patient talk. Subjects were screened to have a diagnosis of hypertension and treatment with at least one antihypertensive agent.
Results: A total of 353 patients completed the online survey in August/September 2011 and were categorized against three different behavioral domains: 1) control orientation (n=176 respondents [50%] for I, internal; n=177 respondents [50%] for E, external); 2) emotion (n=100 respondents [28%] for P, positive; n=253 respondents [72%] for N, negative); and 3) agency or ability to act on choices (n=227 respondents [64%] for H, high agency; n=126 [36%] for L, low agency). Domains were grouped into eight different clusters with EPH and IPH being the most prevalent (88 respondents [25%] in each cluster). The prevalence of other behavior clusters ranged from 6% (22 respondents, INH) to 12% (41 respondents, IPL). The proportion of patients defined as perfectly adherent (scored 25 on MARS-5) varied sharply across the segments: 51% adherent (45 of 88 respondents) for the IPH vs 8% adherent (2 of 25 respondents) classified as INL. Side effects, being employed, and stopping medicine because the patient got better were all significant determinants of adherence in a probit regression model.
Conclusion: By categorizing patients into worldview clusters, we identified wide differences in adherence that can be used to prioritize interventions and to customize adherence messages. Also, the predictive power of segments was greater than that for variables measuring concerns over cost, side effects, and efficacy.
Keywords: adherence, hypertension, segmentation
Introduction
The low level of adherence to medication regimens is well-known across the spectrum of chronic illnesses.1 For hypertension, the chronic illness examined in the current research, medication adherence rates have ranged from 52% to 74%.2 The impact of these low adherence levels on health care costs3 has led to many efforts to identify the reasons behind the low adherence rates, and has led to the design of interventions to raise the low rates. The Adherence Research Network created by the US National Institutes of Health is evidence of the recognition in the USA of the importance of raising adherence levels.4 To understand adherence, researchers have examined a wide range of variables, including psychological characteristics, health beliefs, and demographics.5,6 Over 200 variables have been examined to determine the predictors of adherence and health behaviors. However, previous approaches have had little predictive power and/or have relied on epidemiologic variables that were not amenable to intervention.
Logically, the set of variables used to predict adherence should guide the interventions to improve adherence. That is why an effective patient-centered intervention begins with understanding patients’ decision making. However, simply identifying the main variables related to adherence is not sufficient, because many of these variables do not point to effective interventions. Immutable characteristics of the patient, such as their age and sex, although clearly related to adherence, provide little guidance on which interventions might alter behavior or clues as to the messages that might move the patient. Indeed, messages aimed at such immutable characteristics could be counterproductive. For example, a patient might resent a message tied to their age and sex, such as, “As a mature women you know the importance of taking your blood pressure pills”. Interventions that address the specific concerns and worldviews of each patient, ie, patient-centered solutions, are more likely to increase long-term adherence than generic interventions.
An example of a patient-centered solution is tailored messaging, defined as:
Any combination of strategies and information intended to reach one specific person, based on characteristics that are unique to that person, related to the outcome of interest, and derived from an individual assessment.7
However, two recent systematic reviews of randomized controlled trials published between 2001 and 2010 shows little impact of patient-centered messages on outcomes of chronic illnesses.8,9 One possible explanation is that the messages in these trials were based on researcher-driven behavioral theories, such as the stages of change model,10 the transtheoretical model,11 and the health belief model.12 These theories may not align with the patient’s own point of view.
In the present study, rather than relying on research models, we examine the use of an innovative linguistic model that is based on patients’ own voices. The survey instrument used in the current research, the CoMac Analytics Descriptor (CAD), identifies psycho-socio linguistic characteristics of patients with hypertension and examines the association of these characteristics with self-reported adherence.
Overview
All adherence interventions, including those that rely heavily on technology, have at least an implicit foundation in a model of patient’s decision making. For example, an intervention that cogently reminds patients to take a medication, such as Vitality GlowCap®,13 relies on memory lapses being an important cause of missed medications. Interventions that give small prizes for self-reported adherence, such as the smart phone application by HealthPrize Incorporated,14 rely on patients’ adherence decisions being sensitive to short-term benefits. In these cases, however, if the behavioral model that underlies an intervention is not accurate, then the interventions will not induce real and sustainable changes. Thus, if absentmindedness is not an important and persistent cause, patients could negate a GlowCap®-type intervention by simply opening and closing their pill bottle. Similarly, even if the games and prizes in an intervention were attractive, a patient with an underlying reason to avoid her medication could refill her prescriptions and claim that she was adherent solely to qualify for a prize.
McHorney15 has developed the Adherence Estimator® for Merck & Co, Inc, a survey instrument that is based on a more nuanced behavioral model than either patients being absentminded or swayed by small, short-term benefits. Their instrument attempts to predict “intentional nonadherence”, specifically medication nonfulfillment and nonpersistence. Logical interventions flow directly from the patients’ views generated from this survey. If a patient believes that the side effects of a medication outweigh its benefits, then the logical interventions are to find a medication with fewer side effects or to convince the patient that their assessment of the net benefits is mistaken. There are similar logical interventions for the two other causes of low adherence in this instrument: 1) patients who believe that the medicine is too costly, or 2) patients who believe that the medication lacks efficacy. The key questions with this instrument are the extent to which beliefs about cost, efficacy, and side effects determine adherence and the extent to which those beliefs can be altered.
Another survey based on a more nuanced behavioral model is the Patient Activation Measure (PAM®) developed by Hibbard and Cunningham16 at the University of Oregon, Eugene, OR, USA. PAM® is a 13-item instrument measuring patients’ knowledge, skill, and confidence in managing their health. The interventions that flow logically from this survey are to increase the patient’s knowledge of their disease and medication, their skill managing their illness, and their confidence that their actions will improve their health. Again, the payoff for these interventions depends on knowledge, skill, and confidence, being the main drivers of adherence, and whether interventions can change those factors.
The CoMac Analytics, Inc survey instrument is aimed at better identifying the behavioral determinants of adherence.17 The components of the behavioral model that are the basis of this instrument are fairly standard in the adherence literature. These are: 1) whether a patient’s control orientation (based on locus of control) is external or internal;18 2) whether a patient’s emotional state is negative or positive;19 and 3) whether a patient’s agency (based on self-efficacy) or willingness to act is high or low.20 What is novel about this approach is that this instrument is based on differences in the language used by patients with different worldviews. For example, while a question may appear to be about the efficacy of a medication, the response a patient chooses can provide insight into their locus of control. Someone who selects the response to a question about their medication’s effectiveness, “I believe my medicine is effective”, is revealing a different worldview than a patient selecting the response, “People say my medicine is effective”, although both responses indicate that the medication is effective. An advantage of relying on linguistic clues is that it is much harder for a patient to adjust their responses so as to appear better or to please the interviewer. A further advance is the use of three constructs (control orientation, emotion, and agency) in one survey. Having a three-construct instrument facilitates the creation of messages targeted to the patient’s specific worldview.
While the Adherence Estimator® and PAM® instruments are “one size fits all” conditions, the CoMac Descriptor™ is specific to the illness, because it relies on patients identifying the language used by other patients who have illness. To be salient to the patient, the questions must reflect their daily lives, eg, for patients with diabetes, the CoMac diabetes instrument has questions about situations in which they must make choices about sugar-laden foods. For patients with hypertension, the instrument has questions about salt-laden foods. This specificity and relevance necessitates a longer instrument. The number of questions in the CoMac Descriptor™ varies according to the illness. The version for hypertension used in the current study has 25 questions.
Because there is a close connection between the questions and the potential messages in an intervention, the CoMac Descriptor™ must go beyond creating binary categorizations over the domains of control orientation, agency, and emotion. For example, in order to fashion the appropriate messages, it is not enough to identify a patient as having negative emotions. To address a patient, the source of their negative emotions, eg, family, care providers, physical limitations caused by their disease, etc, has to be identified. That would be difficult if there were three or fewer questions for each domain. If the goal of the instrument were solely to predict adherence so that interventions could be triaged to the patients who were least likely to adhere and/or most likely to respond to interventions, then a short instrument would be possible. The more the instrument is intended to generate interventions that are aligned with the patient’s worldview, the longer it needs to be. Adaptive web-based versions of the CoMac Descriptor™ therefore have variable numbers of questions that help identify the patient’s greatest concerns.
In common with other instruments developed based on more nuanced behavioral models, the effectiveness of any intervention that flows from the CoMac Descriptor™ depends on the factors in the behavioral model underlying the survey being important determinants of adherence. There is no direct method that reveals how patients’ decisions about taking medications are made. A question of the form, “Why are you not taking your medication?” is likely to elicit a socially acceptable answer, if indeed the patient could verbalize their thinking. The only feasible indirect method for determining how the adherence decision was made is identifying the behavioral variables, as opposed to immutable characteristics of the patients, which best predict adherence.
Objectives and methods
CoMac Analytics, Inc, in collaboration with Quintiles Inc., conducted this research with hypertension patients in support of development of a patient engagement program to be deployed across several European countries. The objectives of the research were: 1) to determine the distribution of patients across the three domains and eight worldview segments; 2) to identify the level of medication adherence associated with each segment; 3) to compare the predictive power of the CoMac Descriptor™ to demographic variables and other questions on efficacy, side effects, and cost barriers; and 4) to better understand patient preferences for communication channel, frequency, and message.
Study sample
Members of Quintiles Patient Community, MediGuard.org, and other patient panels in the UK, Germany, Italy, and Spain were invited via email to participate in an online survey conducted in August/September 2011. Interested individuals clicked on an email link to access a screener for patients to qualify for the survey. Patients were deemed eligible if they self-reported a condition of hypertension and treatment with at least one antihypertensive medication. The respective country sample sizes were based on the number of participants who responded to the email and met the survey criteria.
Questionnaire design
The study, including the survey instrument and the informed consent, were approved by an external board of review. Eligible subjects proceeded to complete the online survey deployed in their local language: UK (English), Germany (German), Italy (Italian), and Spain (Spanish). A drug information pharmacist licensed to practice in each of the study countries translated the US instrument into the local language. Adapting the US version of the instrument to other languages required sensitivity to cultural norms. For example, the language for the response, “It is in God’s hands”, as indicator of external control orientation, is much more acceptable in the USA than UK, where overt expressions of religious faith are less common.
The hypertension questionnaire includes CAD, which identifies three psychosocial domains related to adherence: control orientation, agency, and emotion.21–24 The development of CAD was described in previously published research. The CoMac Descriptor™ for hypertension was originally developed using the language of US patients gathered in interviews.25 The online instrument was linguistically based in two senses. First, it was created from lengthy interviews of patients, and second, the actual language of the patients who had been classified as belonging to different domains was used to craft response options in the questions.
By treating the three domains as dichotomous variables (internal or external control orientation, high or low agency, and positive and negative emotion), the instrument categorizes a patient into one of eight patient segments:
- internal control/positive emotion/high agency (IPH);
- internal control/negative emotion/high agency (INH);
- internal control/positive emotion/low agency (IPL);
- internal control/negative emotion/low agency (INL);
- external control/positive emotion/high agency (EPH);
- external control/negative emotion/high agency (ENH);
- external control/positive emotion/low agency (EPL);
- external control/negative emotion/low agency (ENL).
In addition to the CoMac Descriptor™ for hypertension, subjects also completed the Medication Adherence Report Scale-5 (MARS-5) adherence instrument, questions on potential reasons for nonadherence (eg, cost, side effects, and condition improvement), and demographic questions (eg, employment status and highest level of education). The MARS-5 adherence instrument was developed by Horne and Weinman in 2002.26 In addition to hypertension, it has been used as a quantitative measure of self-reported adherence for many other conditions, eg, diabetes,27 COPD,28 bipolar disorder,29 asthma,30 inflammatory bowel disease,31 hyperlipidemia or anticoagulant therapy,32 and rheumatoid arthritis.33 At least four studies have used the MARS-5 for hypertension.34–37
The MARS-5 asks patients the extent to which they have altered their dose, forgotten to use the medication, stopped taking it for a while, decided to miss out on a dose, and taken less than instructed. The possible responses range from “very often” (coded as a 1) to “never” (coded as a 5). The minimum total score for someone who answers “very often” to all five questions is 5. The maximum possible score for someone who answers all questions with “never” is 25. The studies cited that used the MARS-527–37 either chose a cutoff score to define being adherent and/or studied the correlation between the MARS-5 score and some objective adherence measure, such as medicine possession ratio from pharmacy data. The use of these correlations can be problematic on several levels. One problem is that there may not be a single underlying adherence construct that the five questions measure. For example, patients who take less than their prescribed dosage (splits pills) might be trying to save money and thus might have different motivations than patients who have stopped taking their medication. If that is the case, the Cronbach alpha measure of internal consistency for the instrument could be low, as was found in some of the studies.29,33 A second problem with correlations between the MARS-5 and an objective adherence measure is that the number of missed pills, even if all of the questions are aimed at the same construct, has a tenuous connection to the possible MARS-5 responses. For example, if a patient selects the response “sometimes” to the question about altering the dose, it is not at all clear how many pill equivalents that answer indicates. A third problem, perhaps the most fundamental, is that the health consequences of different percentages of days of missed medication just below perfect adherence are not known. There are many articles that define hypertension medicine adherence as 80%38 or better and that document increased risks below that threshold, but we could not find a single article with higher thresholds. Finally, the variable on the other side of the correlation, typically the medicine possession ratio, may not accurately measure adherence. Except for Italy, in the present study, the hypertension medications were free of charge. When medications are free, there is no immediate financial consequence of skipping doses or throwing medicine away.
Converting the MARS-5 score as a binary, with adherence being defined as answering “never” to all five questions, avoids the problem that there may not be a unidimensional underlying construct to the adherence behaviors, and also negates the problem that even if there is a single underlying adherence construct, the relationship between the count of missed pills and MARS-5 responses is unknown. A binary variable for perfect adherence also avoids the problem of scant evidence on consequences of different percentages of missed days for hypertension medications. It aligns with the goal of having patients take their blood pressure medications daily. A binary variable for perfect/imperfect adherence simply measures whether the respondents admit to any missed pills in an anonymous survey. This binary variable may even be a better predictor of health outcomes than the medicine possession ratio. For example, McAdam-Marx et al27 found that for diabetes patients, there was a statistically significant correlation with this binary for weight loss, while the medicine possession ratio was not significant.
Data analysis
To score the MARS-5, responses to each question were coded from 5 to 1, respectively, for the choices never, rarely, sometimes, often, or very often, and then the codes were added. Assuming that patients have a latent or unobserved propensity to be adherent that follows a normal distribution, we utilized probit regression. Either probit regression or logit regression is appropriate for estimating the effect of a set of continuous and/or binary variables on a dependent binary variable. Although probit and logit estimation usually yield similar answers except at the tails of the distributions, probit is theoretically preferred whenever an underlying continuous behavior is dichotomized into two categories – in this case the behavior of being perfectly adherent and the behavior of not being perfectly adherent. Logit is theoretically preferred if the underlying process generates binary results – such as positive or negative lab results. Logit is more popular because its results can be directly interpreted as the odds ratios. A discussion of probit estimation can be found elsewhere in Sandy.39
We estimated four probit equations: 1) demographic variables alone; 2) demographic variables plus self-reported reasons for nonadherence; 3) demographic variables plus the CoMac behavioral clusters; and 4) the combination of all three sets of variables. This setup allowed us to compare the predictive power of the concerns versus the CoMac behavioral clusters. The dependent variable for the equation was a binary metric of adherence as measured by the MARS-5: whether a patient was perfectly adherent (score of 25) vs nonadherent (score of <25). “Pure guesswork” would, on an expected basis, yield a 50% correct prediction rate. Models with higher predictive power place a higher percentage of the patients in their correct adherence categories.
Results
A total of 353 individuals responded to the survey, including 50 in the UK, 126 in Italy, 51 in Germany, and 126 in Spain. Approximately 30% of the respondents were of age 61 years or older. As with many online research studies, younger patients were overrepresented, primarily due to their greater use of the Internet. The percentages in other age ranges were 5% for ages 18–30 years; 38% for ages 31–50 years; 29% for ages 51–60 years; and 6% for age 70 years or above. Most patients had been diagnosed with hypertension 1–10 years ago (68%). The percentages of other values for years since diagnosis were less than a year, 10%; 1–5 years, 38%; 6–10 years, 30%; 11–15 years, 12%; and >15 years, 11%. There was a broad range of employment status: 54% of respondents were employed, 28% were retired, and 10% were unemployed.
Figure 1 shows the distribution of the responses to the MARS-5 instrument. Just over one-third of respondents (34%) had a MARS-5 total score of 25, ie, they claimed to be perfectly adherent. Figure 1 also shows that this conversion to a binary variable of perfectly adherent (score of 25) vs nonadherent (score of <25) masked substantial differences among the less-than-perfectly adherent patients, eg, some patients admitting to very frequently engaging in all five ways of not adhering, while others responded four times with “never” and once with “rarely”.
 | Figure 1 Respondents by MARS-5 score. |
A test of whether the proportions of the respondents in the four countries differed in their self-reported perfect adherence failed to reject the null hypothesis that they were the same (chi-square, 3.4988; df, 3; P=0.321) (Table 1). This Pearson chi-square test was a simple check on whether the adherence results for the four countries could be combined. There were not enough data to run the regression models separately for each country.
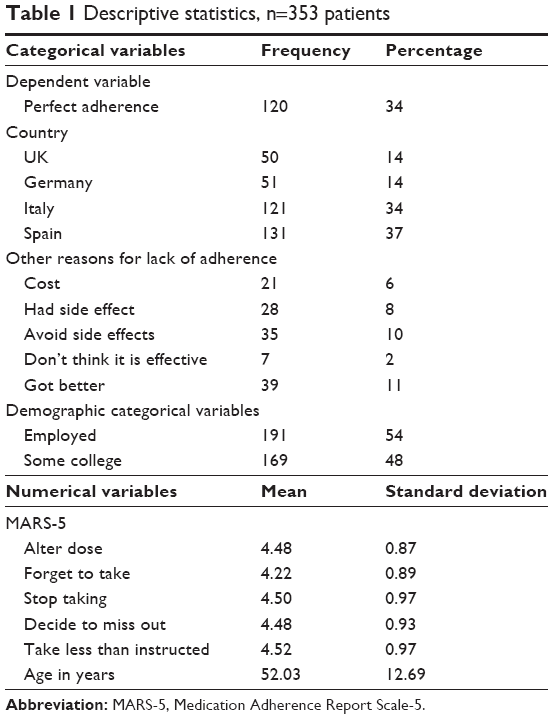 | Table 1 Descriptive statistics, n=353 patients |
Table 2 displays the prevalence of patients against the eight behavioral clusters based on the three underlying domains, as well as the distribution of the constituent domains. Figure 2 displays the percentage of perfectly adherent patients by cluster. As seen in Figure 2, there are significant differences in the rates of perfect adherence across the behavioral clusters. The rate of the most adherent cluster, IPH, is 6.4 times greater than the least adherent cluster, INL.
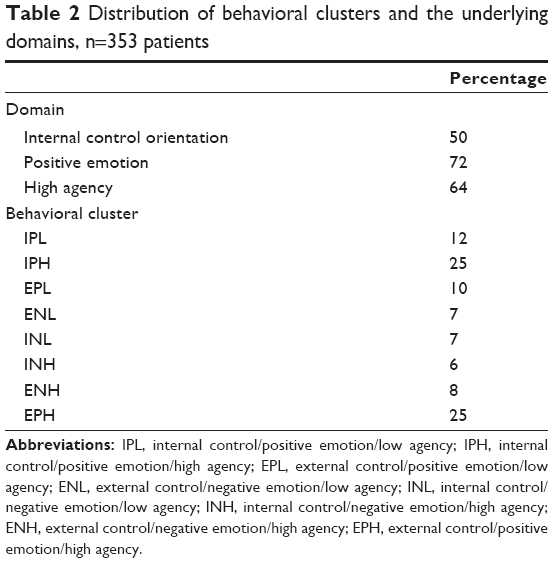 | Table 2 Distribution of behavioral clusters and the underlying domains, n=353 patients |
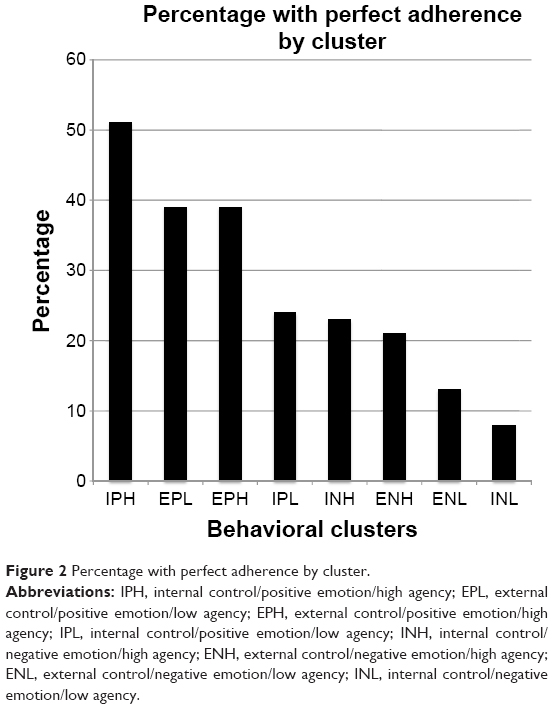 | Figure 2 Percentage with perfect adherence by cluster. |
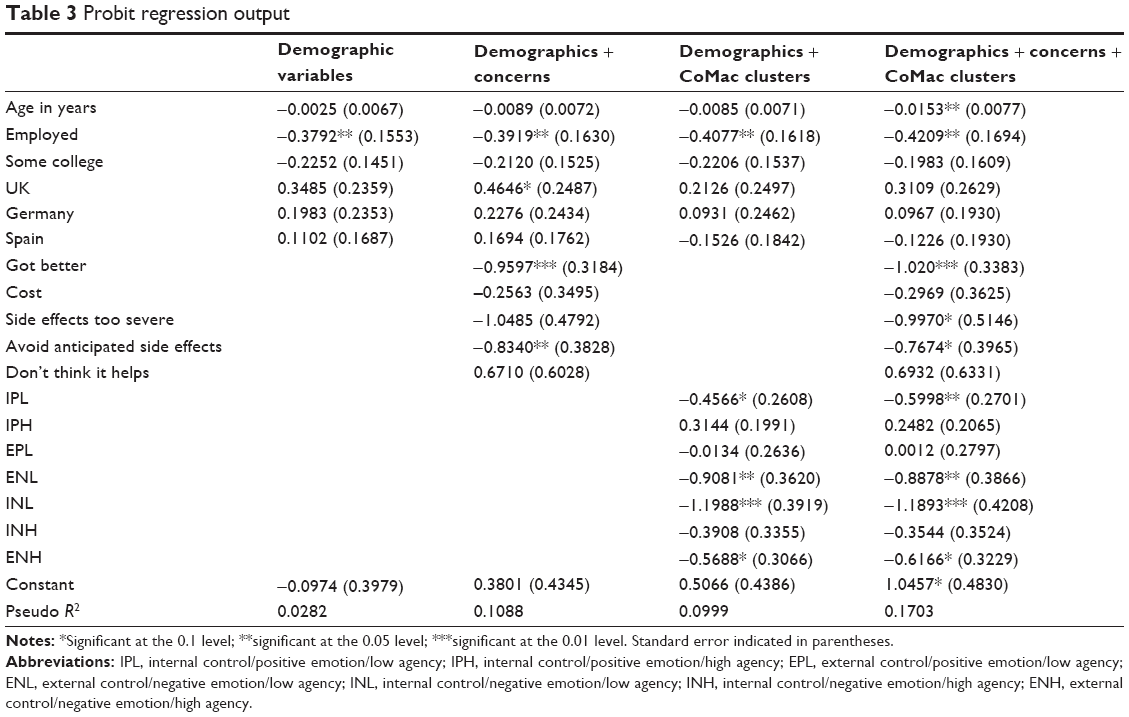
Table 3 presents the probit regression output for the four specifications described in the “Data analysis” section. One, two, and three asterisks indicate statistical significance at the 0.1, 0.05, and 0.01 levels, respectively. The standard errors are in parentheses. As seen in Table 3, while the age variable was always negative (meaning the higher the age, the lower the likelihood of being perfectly adherent), it was only significant in the final specification. Being employed was always negative and significant at the 0.05 level (meaning that employed individuals were less likely to be perfectly adherent). The “some college” variable was never significant. Relative to the omitted country, Italy, there was no evidence that the patients in the other three countries differed in their probability of being adherent.
 | Table 3 Probit regression output |
In regards to the reasons behind nonadherence variables, patients’ out-of-pocket costs were never significant. This result was not surprising given that only 6% of the respondents said that costs were a concern and as medications are free in all European Union (EU) countries included in the current study, except for Italy. The “side-effects-too-severe” variable edged to significance at the 0.1 level in the final specification, but the “avoid-anticipated-side effects” variable was significant at the 0.05 level in the second specification, and at the 0.1 level in the fourth specification. Anticipated side effects may have driven behavior even more than the realized side effects. Finally, the “don’t-think-it-helps” question on efficacy was never significant.
The last set of variables was composed of the CoMac clusters. Here, statistical significance was measured relative to the omitted category of EPH, the largest segment. The IPL segment was significantly less likely to be adherent than the EPH segment in both the third and fourth specifications, in the last at the 0.05 level. The ENL segment was also less likely to be adherent, with significance at the 0.05 level in both specifications. The INL segment was the least likely of the categories to be adherent. The coefficient for that category had the largest absolute value and was significant at the 0.01 level in both specifications. Finally, the ENH segment showed a trend toward significance at the 0.1 level in both specifications, with a negative sign, as compared to the omitted segment, EPH.
The coefficients in probit regressions do not have an intuitive interpretation, such as for ordinary least squares regression – the response of the dependent variable to a unit change in the explanatory variable, while all other variables are constant. The most intuitive way of describing the importance of binary right-hand variables in a probit regression is the marginal effect on the probability of being adherent by changing the right-hand variable from 0 to 1.39 Table 4 shows these marginal effects for the binary variables that were statistically significant in the current study. One question raised was whether the determinants of perfect adherence differed by age and sex. The current dataset does not contain information on sex for all observations, so that variable could not be used. To test whether the coefficients of all of the variables in the third regression in Table 3 varied by age, the sample was split into those above and those below the mean age of 52.03 years. A likelihood ratio Chow test indicated whether the coefficients for all variables in the younger and older samples were different. The results were a likelihood chi-square with 14 df of 11.99 and a P-value of 0.6073. A P-value <0.05 would be needed to reject the null hypothesis of equal coefficient values.
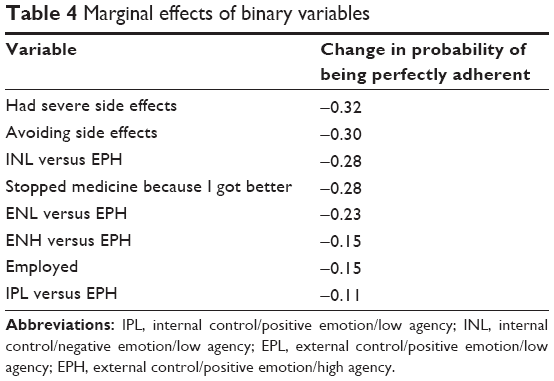 | Table 4 Marginal effects of binary variables |
The interpretation of these marginal effects was the change in the probability of being adherent while holding all other variables at their means. For example, other things being equal, if a patient answered “yes” to the question about having severe side effects, the probability of being perfectly adherent fell by 0.32 relative to someone who answerd “no”. As seen in Table 4, having a severe side effect and avoiding side effects were the two variables with the largest marginal effects on adherence. Four of the seven cluster comparisons also appeared to have >0.10 marginal effect after controlling for the concerns variables and the demographics, which supported the importance of these factors in understanding nonadherence.
The predictive accuracy of the second specification with the demographic variables and the reasons for nonadherence variables was 65.2%. As mentioned in the “Data analysis” section, pure guesswork would have had an expected predictive accuracy of 50%. The gain from the second specification over pure guesswork may therefore seem small. However, it was inherently difficult to accurately predict adherence behavior in the current study, because there was a large component of randomness, ie, patients who were observationally identical and who differed quite often in their adherence behavior. The predictive accuracy of the third specification with the CoMac clusters was 66.9%, slightly above the second specification for this hypertension population, suggesting that the clusters were capturing some drivers of behavior that were not captured by the conventional variables. The greatest predictive accuracy came from the fourth specification that used all of the available variables. It correctly predicted patients’ adherence status in 70.4% of the cases.
Discussion
Our key insight from the current research was that while the prediction of adherence is useful for triaging interventions, it may have little value for the design of interventions, unless the predictions are based on variables tied to the patient’s decision-making process. The gain in predictive power of the CoMac clusters relative to demographic variables and the conventional variables over concerns about cost, efficacy, and side effects suggests that these worldview clusters are related to patient decision making. The main benefit of having worldview clusters that predict behavior is the ability to closely tie adherence interventions to the clusters.
Limitations
Our method of recruitment had two potential biases. The sample of computer-literate subjects was expected to be younger than the population with hypertension. We did not have figures on the age distribution of patients with hypertension in our sampled countries, the UK, Germany, Italy, and Spain, but samples drawn with similar recruitment methods in the USA did show a bias toward younger patients. A second potential bias followed from the patients being younger; they likely had simpler medication regimes than older patients. The third potential bias was that patients who had signed up with a patient community such as MediGuard or a market research panel may have been more educated, engaged, and conscientious about taking their medications, because these patients were making an extra effort to participate in research. The likely overrepresentation of behavioral clusters that were more adherent did not vitiate the research design, however. Our main interest was the differences in behavior across the clusters, which did not depend on their relative sizes.
Another limitation concerns the dependent variable. While our selection of perfect adherence could be justified as the binary dependent variable, because perfect adherence is the goal of most health care providers, it was unclear whether the difference in behavior between the perfectly adherent respondents (those who scored 25 on the MARS-5) and the “nearly perfectly adherent” respondents (eg, the 19% of the sample who scored 24), would result in any therapeutic gains. Most studies of the therapeutic benefits of hypertension medications use 80% of the prescribed dose as a cutoff for being adherent, and the near-perfectly adherent on the MARS-5 in the current study were likely to have been above the point of taking 80% of their prescribed doses.38
Conclusion
The nexus between the instrument used to segment patients and the interventions used to raise adherence is strongest when the instrument is highly predictive of adherence, and the answers to the instrument’s questions point directly to the potential content of messages and other interventions. The next research phase with this instrument will be to test whether sending targeted messages to patients based on the worldview segments will result in changes in self-reported adherence. If the results of this proposed initial pilot study are promising, a follow-up study could be initiated that would allow for the evaluation of long-term adherence gains, as well as comparative tests of the messages designed for different clusters.
Disclosure
An early version of this paper was presented at International Society for Pharmacoeconomics and Outcomes Research, 17th Annual Meeting, June 2–6, 2012, Washington, DC. The authors report no other conflicts of interest in this work.
References
Cutler D, Everett W. Thinking outside the pillbox – medication adherence as a priority for health care reform. N Engl J Med. 2010;362:1553–1555. | ||
Nair KV, Belletti DA, Doyle JJ, et al. Understanding barriers to medication adherence in the hypertensive population by evaluating responses to a telephone survey. Patient Prefer Adherence. 2011;5:195–206. | ||
Sokol M, McGuigan K, Verbrugge R, Epstein RS. Impact of Medication Adherence on Hospitalization Risk and Healthcare Cost. Med Care. 2005;43(6):521–530. | ||
US Department of Health and Human Services [webpage on the Internet]. Adherence research network. Bethesda, MD: US Department of Health and Human Services. Available from: http://obssr.od.nih.gov/scientific_areas/health_behaviour/adherence/adherenceresearchnetwork.aspx. Accessed. | ||
van Dulmen S, Sluijs E, van Dijk L, de Ridder D, Heerdink R, Bensing J; International Expert Forum on Patient Adherence. Furthering patient adherence: a position paper of the international expert forum on patient adherence based on an internet forum discussion. BMC Health Serv Res.2008;8(1):47. | ||
Morris LS, Schulz RM. Patient compliance – an overview. J Clin Pharm Ther. 1992;17(5):283–295. | ||
Kreuter M, Farrell D, Olevitch L, Brennan L. Tailoring Health Messages: Customizing Communication with Computer Technology. Mahwah, NJ: Lawrence Erlbaum Associates; 2000. | ||
Radhakrishnan K. The efficacy of tailored interventions for self-management outcomes of type 2 diabetes, hypertension or heart disease: a systematic review. J Adv Nurs. 2011;68(3):496–510. | ||
Noar SM, Benac CN, Harris MS. Does tailoring matter? Meta-analytic review of tailored print health behavior change interventions. Psychol Bull. 2007;133(4):673–693. | ||
Prochaska JO, Velicer WF, Rossi JS, et al. Stages of change and decisional balance for 12 problem behaviors. Health Psychol. 1994;13:39–46. | ||
Prochaska JO, Reding CA, Evers K. The transtheoretical model and stages of change. In: Glantz K, Rimer BK, Lewis FM, editors. Health Behavior and Health Education: Theory, Research, and Practice. San Francisco: Jossey-Bass; 2002:99–120. | ||
Janz NK, Becker MH. The health belief model: a decade later. Health Educ Q. 1984;11:1–47. | ||
Vitality, Inc [webpage on the Internet]. Changing behavior is challenging, but possible. Los Angeles, CA: Vitality, Inc. Available from: http://www.vitality.net/research.html | ||
HealthPrize Technologies [webpage on the Internet]. Off the chart: patient engagement. Norwalk, CT: HealthPrize Technologies. Available from: https://www.healthprize.com/corporate/ourSolution/overview.do | ||
McHorney C. The adherence estimator: a brief, proximal screener for patient propensity to adhere to prescription medications for chronic disease. Curr Med Res Opin. 2009;25(1):215–238. | ||
Hibbard JH, Cunningham PJ. How engaged are consumers in their health and health care, and why does it matter? Res Brief. 2008;8:9. | ||
Clark CM Jr, Connor U, Lauten K, Mac Neil RS Jr, Sandy R. A linguistic approach to improving self-care and compliance. J Patient Compliance. 2012;2(4):20–22. | ||
Wallston KA, Wallston BS, DeVellis R. Development of the multidimensional health locus of control (MHLC) scales. Health Educ Monogr. 1978;6:160–170. | ||
Martin JR, White PR. The Language of Evaluation: Appraisal in English. New York, NY: Palgrave Macmillan; 2005. | ||
Bandura A. Self-efficacy: The Exercise of Control. New York, NY: WH Freeman; 1997. | ||
Connor U, Anton M, Goering E, et al. Listening to patients’ voices: linguistic indicators related to diabetes self-management. Commun Med. 2012;9(1):1–12. | ||
Connor U, Lauten K. A linguistic analysis of diabetes patients’ adherence to healthy behaviors. In: Hamilton H, Chou s, Editors. Handbook of Language and Health Communication. New York, NY: Routledge; 2014:91–108. | ||
Lauten K, Connor U, Anton M, et al. “You are what you talk” – patient-centered interactions. Paper presented at: Indiana Central Association Diabetes Educators Diabetes Conference; November 5, 2010; Indianapolis, IN. | ||
Lauten K, Connor U, Anton M, et al. Patient-centered adherence improvement. Paper presented at: International Conference on Communication in Healthcare; September 5–8, 2010; Verona, Italy. | ||
Connor UM, Mac Neill RS Jr, Mzumara HR, Sandy R. Development of the CoMac Adherence Descriptor™: a linguistically-based survey for segmenting patients on their worldviews. Patient Prefer Adherence. 2015;9:509–515. | ||
Horne R, Weinman J. Self-regulation and self-management in asthma: exploring the role of illness perceptions and treatment beliefs in explaining non-adherence to preventer medication. Psychol Health. 2002;17(1):17–32. | ||
McAdam-Marx C, Bellows BK, Unni S, et al. Impact of adherence and weight loss on glycemic control in patients with type 2 diabetes: cohort analyses of integrated medical record, pharmacy claims, and patient-reported data. J Manag Care Spec Pharm. 2014;20(7):691–700. | ||
Tommelein E, Mehuys E, Van Tongelen I, Brusselle G, Boussery K. Accuracy of the Medication Adherence Report Scale (MARS-5) as a quantitative measure of adherence to inhalation medication in patients with COPD. Ann Pharmacother. 2014;48(5):589–595. | ||
Bäck A, Sundell KA, Horne R, Landén M, Mårdby A. The Medication Adherence Report Scale (MARS-5) in a Swedish sample with bipolar disorder – a pilot study. Int J Pers Cent Med. 2012;2(2):263–270. | ||
Menckeberg TJ, Bouvy ML, Bracke M, et al. Beliefs about medicines predict refill adherence to inhaled corticosteroids. J Psychosom Res. 2008;l64(1):47–54. | ||
Ediger JP, Walker JR, Graff L, et al. Predictors of medication adherence in inflammatory bowel disease. Am J Gastroenterol. 2007;102:1417–1426. | ||
Gialamas A, Yelland LN, Ryan P, et al. Does point-of-care testing lead to the same or better adherence to medication? A randomised controlled trial: the PoCT in General Practice Trial. Med J Aust. 2009;191(9):487–491. | ||
Salt E, Hall L, Peden AR, Horne R. Psychometric properties of three medication adherence scales in patients with rheumatoid arthritis. J Nurs Meas. 2012;20(1):59–72. | ||
Kamble S, Cascade E, Gemmen E. Factors related to non-adherence and satisfaction for hypertension medications: results from a novel patient registry. Value Health. 2012;15(7):A337–A338. | ||
Kakad P. To Evaluate the Level of Agreement Between Two Self-reported Medication Adherence Scales and Prescription Refill Records in Older Adults [master’s thesis]. Richmond, VA: Virginia Commonwealth University; 2009. Available from: http://scholarscompass.vcu.edu/cgi/viewcontent.cgi?article=2918&context=etd | ||
van de Steeg N, Sielk M, Pentzek M, Bakx C, Altiner A. Drug-adherence questionnaires not valid for patients taking blood-pressure-lowering drugs in a primary health care setting. J Eval Clin Pract. 2009;15(3):468–472. | ||
Matoulkova P, Krulichova IS, Macek K, et al. Chronically iII Czech patients’ beliefs about medicines: the psychometric properties and factor structure of the BMQ-CZ. Ther Innov Regul Sci. 2013;47(3):341–348. | ||
Ho PM, Bryson CL, Rumsfeld JS. Medication adherence: its importance in cardiovascular outcomes. Circulation. 2009;119(23):3028–3035. | ||
Sandy R. Statistics for Business and Economics. New York, NY: McGraw-Hill; 1990. |
 © 2015 The Author(s). This work is published and licensed by Dove Medical Press Limited. The
full terms of this license are available at https://www.dovepress.com/terms
and incorporate the Creative Commons Attribution
- Non Commercial (unported, 3.0) License.
By accessing the work you hereby accept the Terms. Non-commercial uses of the work are permitted
without any further permission from Dove Medical Press Limited, provided the work is properly
attributed. For permission for commercial use of this work, please see paragraphs 4.2 and 5 of our Terms.
© 2015 The Author(s). This work is published and licensed by Dove Medical Press Limited. The
full terms of this license are available at https://www.dovepress.com/terms
and incorporate the Creative Commons Attribution
- Non Commercial (unported, 3.0) License.
By accessing the work you hereby accept the Terms. Non-commercial uses of the work are permitted
without any further permission from Dove Medical Press Limited, provided the work is properly
attributed. For permission for commercial use of this work, please see paragraphs 4.2 and 5 of our Terms.