
Back to Journals » International Journal of Nephrology and Renovascular Disease » Volume 17
Value of Shear Wave Elastography in the Evaluation of Chronic Kidney Disease
Authors Lakshmana SK, Koteshwar P, Kamath T
Received 2 August 2024
Accepted for publication 3 October 2024
Published 6 December 2024 Volume 2024:17 Pages 307—317
DOI https://doi.org/10.2147/IJNRD.S480501
Checked for plagiarism Yes
Review by Single anonymous peer review
Peer reviewer comments 2
Editor who approved publication: Professor Pravin Singhal
Shivarajkumar K Lakshmana, Prakashini Koteshwar, Tanushree Kamath
Department of Radiodiagnosis and Imaging, Kasturba Medical College, Manipal Academy of Higher Education (MAHE), Manipal, Karnataka, India
Correspondence: Prakashini Koteshwar; Tanushree Kamath, Email [email protected]; [email protected]
Purpose and Motivation: Chronic kidney disease (CKD) is a major global public health problem with eventual progression to end-stage renal disease which tends to increase kidney stiffness. Shear wave elastography (SWE) is a recently developed ultrasound based technique which can be used to assess tissue stiffness noninvasively. The aim of this study was to evaluate the potential diagnostic value of SWE to assess renal parenchymal stiffness in CKD and its correlation with estimated glomerular filtration rate (eGFR), which may be used as a marker for detecting and staging CKD.
Materials and Methods: The study protocol was approved by the Institutional ethics Committee at Kasturba medical college, Manipal and written informed consent was obtained from all participants. The study included 93 control subjects and 108 patients with CKD. SWE imaging was performed to assess renal cortical stiffness, as measured by the Young’s modulus (YM). Correlations between SWE and conventional ultrasound parameters with age, serum creatinine, eGFR and serum urea were analysed using Pearson’s correlation coefficient (p ≤ 0.05) and receiver operating characteristic (ROC) curves were derived.
Results: The diagnostic performance of SWE correlated with serum creatinine levels and eGFR. We found a statistically significant difference in kidney stiffness values between healthy individuals and CKD patients. The Spearman correlation coefficient revealed moderate negative linear correlation between the YM measurements and eGFR. We obtained a YM measurement cut-off value of 4.43 kPa, a value less than or equal to this suggested a no diseased kidney. This yielded sensitivity and specificity of 92.6% and 80.6%, respectively, with an AUROC of 0.92.
Conclusion: Our results demonstrated that shear wave elastography may provide a low-cost, non-invasive method for the morphological assessment and progression of the disease status in chronic kidney disease patients with CKD.
Keywords: chronic kidney disease, shear wave elastography, renal parenchymal stiffness
Introduction
The incidence of chronic kidney disease (CKD) has increased considerably in recent decades, with diabetes mellitus (DM) and hypertension being major causes. Its prevalence is estimated to be 8–16% worldwide. This highlights the importance of better screening programs for populations at risk for CKD.1
Although biochemical tests such as urinary protein, serum urea, and creatinine can assess disease progression, they lack sensitivity. Ideal methods for fibrosis assessment are lacking, except for kidney biopsy which is not only an invasive procedure, but also has several contraindications.2 Disorders of coagulopathy, polycystic kidneys, obstruction of the urinary tract, infections of the upper urinary tract are regarded as absolute contraindications. Compromised cardiopulmonary function, severe obesity, inability of the patient to cooperate, solitary kidney, advanced age, severe hypertension (> 160/95 mmHg), and renal failure are considered as relative contraindications.
Conventional ultrasound is one of the most frequently used methods for the evaluation of renal structure and status as well as for the diagnosis and follow-up of CKD. Renal length, parenchymal thickness, and increased cortical echogenicity have been reported to correlate statistically with tubular atrophy and glomerular sclerosis.3 But these parameters are not quantitative and lack sensitivity and specificity for CKD evaluation.4 Progressive histological changes in CKD include glomerulosclerosis, vascular sclerosis, and tubular and interstitial injury, which can result in interstitial fibrosis and tubular atrophy . The deteriorating glomerular filtration rate (GFR) is accompanied by progressive interstitial damage.5 This increases the stiffness of the diseased area.
Ultrasound-based elastography,6 which noninvasively measures tissue stiffness, is a significant advancement in the field of ultrasound imaging. It has been widely used in assessing fibrosis in liver disease and to predict the presence of gastro-esophageal varices in cirrhotic patients.7 Other uses include assessing hardness of lesions in breast, prostate, thyroid and also has various musculoskeletal applications. Static elastography methods which uses direct compression in assessment of superficial organs such as thyroid or breast, have no utility in renal exploration because of the deeply profound location and because of non uniform pattern of fibrosis in CKD or other diffuse pathologies, hence there is no healthy tissue to compare the elastography results.8 Shear wave imaging (SWE) is a technique where a dynamic stress is applied to tissue. Elastography point quantification (ElastPQ) is a type of point shear wave-based elastography technique that was introduced by Philips wherein ultrasonic pressure wave is transmitted to the body by the transducer, which generates shear waves that propagate in the tissues perpendicular to the axis of the original pressure wave. ElastPQ has an additional Doppler function that detects the speed at which these shear waves travel to estimate tissue stiffness. Stiffer tissues had a higher shear-wave velocity. Shear-wave elastography (SWE) is an emerging technique that is inexpensive, convenient and safe, especially in patients with contraindications to biopsy. It can be integrated into a conventional ultrasound machine to measure tissue stiffness in real-time. Combined use of conventional ultrasound imaging and SWE imaging can provide qualitative and quantitative assessments of tissue elasticity.
The aim of this study was to evaluate the potential diagnostic value of SWE in assessing the stiffness of the renal parenchyma, which may be used as a marker for detecting and staging CKD, and to analyse its potential influencing factors.
Materials and Methods
This retrospective study was conducted at the Department of Radiodiagnosis and Imaging, Kasturba Medical College, Manipal between September 2018 and September 2019. Our study complies with the declaration of Helsinki and was approved by the Institutional Ethics Committee of Kasturba Medical College, Manipal. Written informed consent was obtained from all patients and healthy volunteers prior to the procedure.
93 healthy volunteers were selected as controls based on the following inclusion criteria: age >18 years, BMI<35. Exclusion criteria were done in cases of diabetes mellitus, hypertension, or any other systemic disease that might influence renal function and the presence of kidney lesions such as renal cysts/stones/mass/HUN/solitary kidney.
The cases included 108 CKD patients with CKD referred to our department for imaging of the kidneys with the following inclusion criteria: age >18 years, chronic kidney disease secondary to type II diabetes mellitus, hypertension, or both. Kidneys were screened by conventional ultrasound to detect stones, any type or size of cyst, hydronephrosis, or masses and were excluded from the study. Other exclusion criteria were as follows: BMI >35, any condition where renal cortical thickness was <1.5 cm, acute kidney injury, CKD due to causes other than DM/HTN such as glomerulonephritis, tubulointerstitial disease, polycystic kidney disease.
Evaluation of Renal Function
Estimated glomerular filtration rate (eGFR) was calculated using the Modification of Diet in Renal Disease (MDRD) equation using serum creatinine levels, age, sex and race.9
Clinical history and laboratory tests were used to make the primary diagnosis.
The diagnosis of CKD was based on kidney damage or eGFR, and was classified into stages, as shown in Table 1.
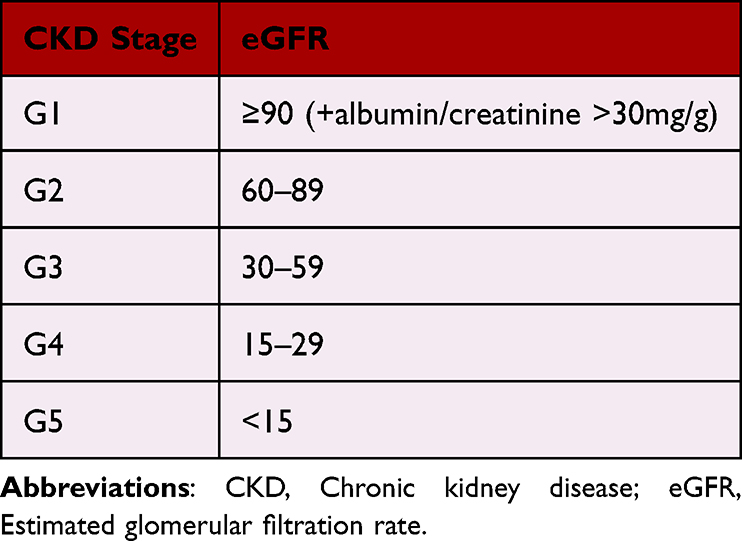 |
Table 1 Staging of CKD Based on eGFR |
Conventional Ultrasound Evaluation
The kidney was displayed on the longitudinal plane to identify intrarenal structures, and the following features were noted: kidney size, cortical thickness, parenchymal changes, and Doppler measurement of the main renal artery (Peak systolic velocity, End diastolic volume, and Resistive index).
Quantification of Kidney Stiffness by Shear Wave Elastography
All US examinations were performed using either a Philips EPIQ5 or Affinity 70 (PHILIPS HEALTHCARE) system equipped with shear wave point quantification (ELASTPQ), using a 5C-1 curvilinear broadband transducer (1–5 MHz).
All patients were placed in the left lateral decubitus position, with the right arm maximally abducted above the head measurements obtained in the right kidney. During acquisition, patients were asked to hold their breaths at the mid-respiration level to minimise breathing motion while avoiding deep inspiration or expiration.10
A fixed small region of interest (ROI) was selected based on available thickness of cortex. The region of interest (ROI) was always placed at a depth of <8 cm. Kidney stiffness measurements were performed in a region of well-represented renal cortical parenchyma devoid of renal pyramids or capsules, at the shortest distance from the skin that corresponded to the middle third of the kidney, with the sample line being radially oriented, as shown in Figures 1–5. This was done to orient the beam parallel to direction of collecting ducts which helps avoid the anisotropic properties of the kidney and improve reproducibility of the measurements.11 The applied transducer compression was minimised as much as possible. The US machine measures the tissue stiffness in kilopascals (kPa), also known as the Young's modulus of elasticity.
 |
Figure 1 B-mode image and report showing the ROI placement (white box) in the cortex of a patient with CKD stage-5 with average YM measurement of 9.16 kPa. |
 |
Figure 2 B-mode image and report showing the ROI placement (white box) in the cortex of a patient with CKD stage-4 with average YM measurement of 7.78 kPa. |
 |
Figure 3 B-mode image and report showing the ROI placement (white box) in the cortex of a patient with CKD stage-3 with average YM measurement of 6.26 kPa. |
 |
Figure 4 B-mode image and report showing the ROI placement (white box) in the cortex of a patient with CKD stage-2 with average YM measurement of 5.39 kPa. |
 |
Figure 5 B-mode image and report showing the ROI placement (white box) in the cortex of a patient with CKD stage-1 with average YM measurement of 4.81 kPa. |
The goal of these techniques is to reduce the impact of renal anisotropy and other technical factors affecting the quality of the measurements, thereby improving the reproducibility of SWE measurements.
Only examinations with at least five validated measurements were considered reliable. Valid measurements were considered to have success rate >60% (SR) and an interquartile range <50%. The mean stiffness values of 5 valid consecutive measurements of the examined kidneys were calculated.
Statistical Analysis
Data were analysed using Statistical Package for the Social Sciences software v.25 (IBM Statistics, Inc. Armonk, New York, USA).
We used the mean of the SWE measurements obtained as the tissue Young’s modulus (YM) for the subsequent analysis.
Correlations between SWE and conventional ultrasound parameters and age, serum creatinine level, eGFR, and serum urea level were analysed using Pearson’s correlation coefficient (p ≤ 0.05).
Receiver operating characteristic (ROC) curve analysis was performed, and the area under the ROC curve (AUC) 95% confidence intervals (CI), optimal cut-off value, sensitivity and specificity were calculated.
One-way analysis of variance (ANOVA) and post hoc Tukey’s significant difference tests were used to analyse the changes in mean YM values according to the CKD stage.
Results
Relationship Between YM Measurements and Other Parameters
YM measurements showed no significant correlation with age among the controls but showed a moderate negative correlation with age in the CKD group (r = −0.340, p < 0.001).
The Spearman correlation coefficient revealed a moderate negative linear correlation between YM measurements and eGFR (r = −0.394, p < 0.001).
Moderate positive linear correlations were observed between the YM measurements and serum creatinine (r = 0.426, p < 0.001) and serum urea (r = 0.368, p < 0.001).
YM measurements showed no significant correlation with BMI in either cases or controls.
In an attempt to determine the relationship between parenchymal stiffness and renal blood flow indices, we found that there was no significant correlation between kidney stiffness and PSV in either cases or controls, and only a weak positive correlation between parenchymal stiffness and RI in patients CKD (r = 0.268, p < 0.05).
Comparison of Mean of YM and RI Between CKD and Control Groups
Comparison of mean YM measurements between the CKD and control groups revealed that YM measurements were significantly higher in the CKD group Table 2, indicating increased stiffness within the CKD group, (p <0.001).
 |
Table 2 Comparison of Means of YM Measurements and RI Among Controls and CKD Group |
The resistive index (RI) values were also significantly higher in the CKD group than the control group (p <0.001) Table 2. Spearman’s rho correlation coefficient showed that RI values had a significant positive correlation with increasing CKD grade.
The mean YM measurements between the control and patient groups were analysed using ROC curves (Figure 6). The area under the receiver operating characteristic (ROC) curve for SWE was 0.92. We obtained a YM measurement cutoff value of 4.43 kPa, of which a value less than or equal to this suggested a non-diseased kidney. This yielded sensitivity and specificity of 92.6% and 80.6%, respectively.
 |
Figure 6 ROC curve of YM in distinguishing between CKD and control groups. |
One-way analysis of variance (ANOVA) and post hoc Tukey’s significant difference tests were used to determine the changes in mean YM values according to CKD stage (Figure 7).
 |
Figure 7 Boxplot showing the correlation between CKD stage and YM measurements. |
The measured mean values of YM were lower in the lower CKD group that had a higher eGFR, with the exception of stage 1 which had a higher YM value than stage 2, as shown in Table 3.
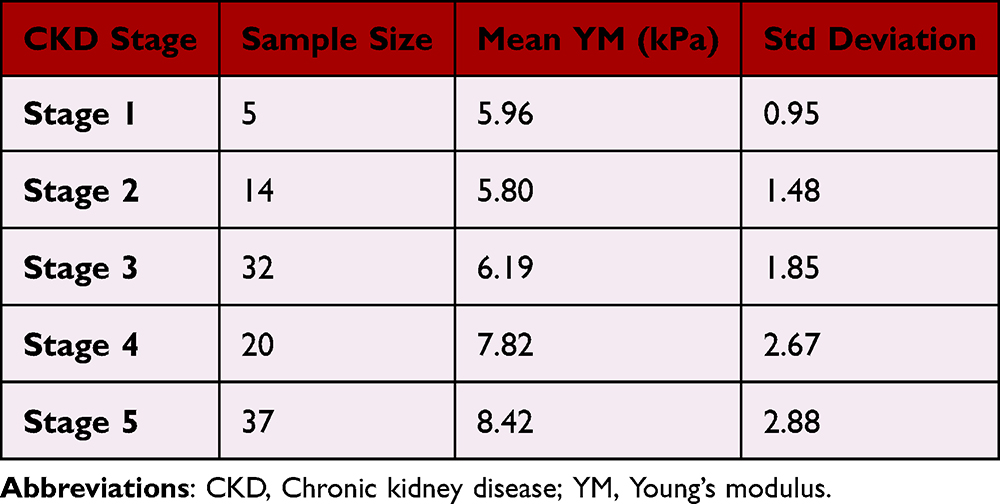 |
Table 3 Mean YM Values of CKD Stages |
Tukey’s post hoc multiple comparison test revealed a statistically significant difference in the means between stages 2 and 5 and stages 3 and 5. However no significant differences were observed among the other CKD stages.
Discussion
The incidence of CKD is very high worldwide. Progressive histological changes occurring in CKD include glomerulosclerosis, vascular sclerosis, tubular and interstitial injury, which results in interstitial fibrosis and tubular atrophy. Histological examination by kidney biopsy is invasive and can result in procedure related complication and carries a risk of sampling error. CKD causes the stiffness of the diseased area to increase, allowing shear waves to propagate quickly through the affected tissue.12 Thus there is decline in GFR with increasing amount of renal fibrosis, which in turn is directly related to the speed of shear wave propagation in the renal parenchyma. In our study, we aimed to ascertain if there was a significant correlation between tissue stiffness measured by Young’s Modulus (YM) measurements and kidney function measured by eGFR.
We found that YM measurements were significantly negatively correlated with eGFR and positively correlated with serum creatinine levels and presence of CKD. With increasing disease severity, the YM values increased, correlating with the fact that increasing fibrosis of tissues increases the shear wave velocity. This finding is supported by previous studies employing the SWE technique conducted by Leong et al,13 Goya et al,14 Radulescu et al,15 Yu et al,16 Samir et al,10 and Hassan et al,17 all of which showed a statistically significant difference in the measured YM/SWV values between healthy controls and the CKD group.
One of the crucial problems we encountered was the lack of a reliable definition of the normal limits of stiffness in the native healthy kidney, as it has already been defined for other organs such as the liver, breast, or thyroid. The measurements taken thus far have shown significant variations between the studies. For example, the elasticity values of renal cortex varies upon different assessments, between 15.4 ± 2.5 kPa6 to 4.40 (3.68, 5.70) kPa7 for Young’s modulus in SSI or SWE, and between 1.75 m/s8 to 2.54 ± 0.83 m/s9 for shear wave velocity in ARFI, highlighting the necessity for extensive trials on healthy kidneys.
In our study, we found that the average YM measurements in healthy controls were 3.47 ± 1.39 kPa.
The ability to differentiate between individual stages was poor. However, early and advanced CKD stages may be differentiated by stiffness values which are significantly different between CKD stages 2 and 5, and 3 vs 5. This information may be valuable for the early initiation of suitable interventions to prevent further deterioration of renal function.18
The methodology of our study was closely aligned with that of Leong et al,10 with a similar elastography technique (ElastPQ) and ultrasound equipment. However, their study did not include patients with CKD stage 1. The average YM values obtained were similar to those of the controls, but among the CKD groups, we found lower YM values (Table 4). The explanation for this difference could be the variation in the proportion of cases among the CKD subgroups; -our study sample size was biased towards higher CKD grades, whereas they included more numbers in the lower CKD grades. We found higher stiffness in CKD stage 1 CKD than those with stage 2 CKD. This could reflect the fact that there is glomerular hyperfiltration occurs in the early stages of renal damage,19 but the relatively small sample size in the CKD 1 subgroup precludes a definite conclusion.
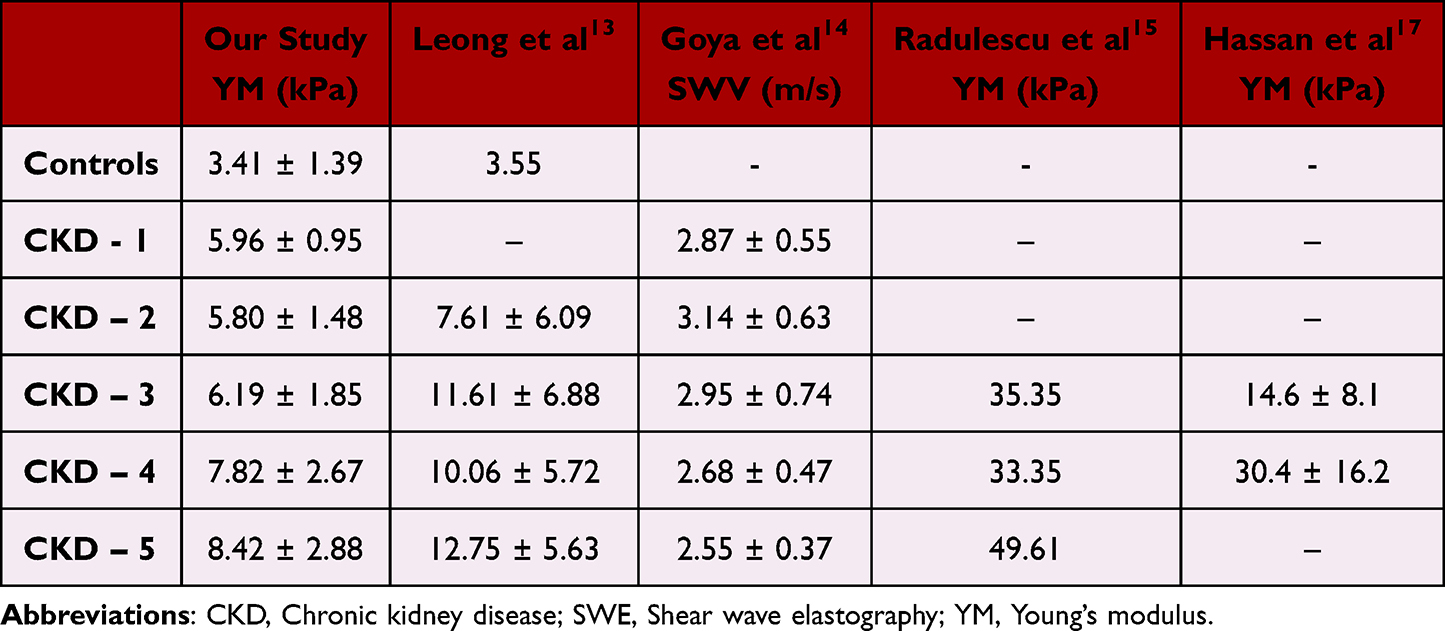 |
Table 4 Comparison with Few Previous Studies Showing Correlation of SWE Measurements with CKD Grades |
Compared to a few prior studies, as summarised in Table 4, our results followed the trend of increasing stiffness values with progressing CKD grades, but the actual values differed slightly to significantly. A possible explanation for this could be the different scanning parameters, type II error due to small sample sizes, operator-dependent variations, different elastography technologies and equipment, different population sizes, and population characteristics such as age, race, and sex proportion.
In contrast to the above results, studies conducted by Asano et al,18 Hu et al,20 and Guo et al,21 found a positive relationship between shear wave velocities and eGFR and an inverse relationship between kidney stiffness and increasing grades of CKD. The exact reason for this discrepancy is not known; however, the proposed mechanisms were the differences in histological changes and mechanical properties between the kidney and liver,22 reduced blood flow in advanced CKD stages that mask renal fibrosis, and lower kidney stiffness.
We obtained a YM measurement cut-off value of 4.43 kPa, of which a value less than or equal to this suggested a non-diseased kidney with a sensitivity and specificity of 92.6% and 80.6%, respectively. The area under the receiver operating characteristic (ROC)curve for SWE was 0.92.
Similar to the average YM values of cases and controls, our cut off value was closest to the cut off reported by Leong et al,13 with the possible reason mentioned earlier. However, we obtained a higher sensitivity and larger AUROC than they did.
Limitations of This Study Include
1. A small number of participants with unequal sample sizes in different CKD subgroups. 2. The fixed size of the ROI box could not be used to sample parenchymal stiffness in patients with thin renal parenchyma, hence a significant number of patients belonging to the higher CKD groups had to be excluded. 3. Lack of histological quantification.
Conclusion
Our study results showed a positive correlation between renal cortical stiffness and increasing CKD grades and we were able to establish a stiffness cut-off value for differentiating between normal and diseased kidney and early and advanced CKD.
Disclosure
The authors report no conflicts of interest in this work.
References
1. Varughese S, Abraham G. Chronic kidney disease in India: a clarion call for change. Clin J Am Soc Nephrol. 2018;13(5):802–804. doi:10.2215/CJN.09180817
2. Eiro M, Katoh T, Watanabe T. Risk factors for bleeding complications in percutaneous renal biopsy. Clin Exp Nephrol. 2005;9:40–45. doi:10.1007/s10157-004-0326-7
3. Sanusi AA, Arogundade FA, Famurewa OC, et al. Relationship of ultrasonographically determined kidney volume with measured GFR, calculated creatinine clearance and other parameters in chronic kidney disease (CKD). Nephrol Dial Transplant. 2009;24(5):1690–1694. doi:10.1093/ndt/gfp055
4. Moccia WA, Kaude JV, Wright PG, Gaffney EF. Evaluation of chronic renal failure by digital gray-scale ultrasound. Urol Radiol. 1981;2:1–7. doi:10.1007/BF02926687
5. Geddes CC, Baxter GM. Renal impairment. Imaging. 2008;20(1):1–9. doi:10.1259/imaging/63493570
6. Shiina T, Nightingale KR, Palmeri ML, et al. WFUMB guidelines and recommendations for clinical use of ultrasound elastography: part 1: basic principles and terminology. Ultrasound Med Biol. 2015;41(5):1126–1147. doi:10.1016/j.ultrasmedbio.2015.03.009
7. Zaki M, Hazem M, Elsamman M. Shear wave elastography in assessment of liver stiffness and prediction of gastro-esophageal varices in patients with liver cirrhosis. Egypt J Radiol Nucl Med. 2019;50:1–9. doi:10.1186/s43055-019-0015-x
8. Grenier N, Gennisson JL, Cornelis F, Le Bras Y, Couzi L. Renal ultrasound elastography. Diagn Interv Imaging. 2013;94(5):545–550. doi:10.1016/j.diii.2013.02.003
9. Levey AS, Coresh J, Balk E, et al. National kidney foundation practice guidelines for chronic kidney disease: evaluation, classification, and stratification. Ann Internal Med. 2003;139(2):137–147. doi:10.7326/0003-4819-139-2-200307150-00013
10. Samir AE, Allegretti AS, Zhu Q, et al. Shear wave elastography in chronic kidney disease: a pilot experience in native kidneys. BMC Nephrol. 2015;16:1–9. doi:10.1186/s12882-015-0120-7
11. Cui G, Yang ZH, Zhang W, et al. Evaluation of acoustic radiation force impulse imaging for the clinicopathological typing of renal fibrosis. Exp Ther Med. 2014;7(1):233–235. doi:10.3892/etm.2013.1377
12. Bob F, Grosu I, Sporea I, et al. Ultrasound-based shear wave elastography in the assessment of patients with diabetic kidney disease. Ultrasound Med Biol. 2017;43(10):2159–2166. doi:10.1016/j.ultrasmedbio.2017.04.019
13. Leong SS, Wong JH, Md Shah MN, Vijayananthan A, Jalalonmuhali M, Ng KH. Shear wave elastography in the evaluation of renal parenchymal stiffness in patients with chronic kidney disease. Brit J Radiol. 2018;91(1089):20180235. doi:10.1259/bjr.20180235
14. Goya C, Kilinc F, Hamidi C, et al. Acoustic radiation force impulse imaging for evaluation of renal parenchyma elasticity in diabetic nephropathy. Am J Roentgenol. 2015;204(2):324–329. doi:10.2214/AJR.14.12493
15. Radulescu D, Peride I, Petcu LC, Niculae A, Checherita IA. Supersonic shear wave ultrasonography for assessing tissue stiffness in native kidney. Ultrasound Med Biol. 2018;44(12):2556–2568. doi:10.1016/j.ultrasmedbio.2018.07.001
16. Yu N, Zhang Y, Xu Y. Value of virtual touch tissue quantification in stages of diabetic kidney disease. J Ultrasound Med. 2014;33(5):787–792. doi:10.7863/ultra.33.5.787
17. Hassan K, Loberant N, Abbas N, Fadi H, Shadia H, Khazim K. Shear wave elastography imaging for assessing the chronic pathologic changes in advanced diabetic kidney disease. Ther Clin Risk Manag. 2016;7:1615–1622. doi:10.2147/TCRM.S118465
18. Asano K, Ogata A, Tanaka K, et al. Acoustic radiation force impulse elastography of the kidneys: is shear wave velocity affected by tissue fibrosis or renal blood flow? J Ultrasound Med. 2014;33(5):793–801. doi:10.7863/ultra.33.5.793
19. Palatini P. Glomerular hyperfiltration: a marker of early renal damage in pre-diabetes and pre-hypertension. Nephrol Dial Transplant. 2012;27(5):1708–1714. doi:10.1093/ndt/gfs037
20. Hu Q, Wang XY, He HG, Wei HM, Kang LK, Qin GC. Acoustic radiation force impulse imaging for non-invasive assessment of renal histopathology in chronic kidney disease. PLoS One. 2014;9(12):e115051. doi:10.1371/journal.pone.0115051
21. Guo LH, Xu HX, Fu HJ, Peng A, Zhang YF, Liu LN. Acoustic radiation force impulse imaging for noninvasive evaluation of renal parenchyma elasticity: preliminary findings. PLoS One. 2013;8(7):e68925. doi:10.1371/journal.pone.0068925
22. Wouters OJ, O’donoghue DJ, Ritchie J, Kanavos PG, Narva AS. Early chronic kidney disease: diagnosis, management and models of care. Nat Rev Nephrol. 2015;11(8):491–502. doi:10.1038/nrneph.2015.85
 © 2024 The Author(s). This work is published and licensed by Dove Medical Press Limited. The
full terms of this license are available at https://www.dovepress.com/terms
and incorporate the Creative Commons Attribution
- Non Commercial (unported, 3.0) License.
By accessing the work you hereby accept the Terms. Non-commercial uses of the work are permitted
without any further permission from Dove Medical Press Limited, provided the work is properly
attributed. For permission for commercial use of this work, please see paragraphs 4.2 and 5 of our Terms.
© 2024 The Author(s). This work is published and licensed by Dove Medical Press Limited. The
full terms of this license are available at https://www.dovepress.com/terms
and incorporate the Creative Commons Attribution
- Non Commercial (unported, 3.0) License.
By accessing the work you hereby accept the Terms. Non-commercial uses of the work are permitted
without any further permission from Dove Medical Press Limited, provided the work is properly
attributed. For permission for commercial use of this work, please see paragraphs 4.2 and 5 of our Terms.