Back to Journals » Journal of Inflammation Research » Volume 13
Value of Platelet Distribution Width and Mean Platelet Volume in Disease Activity Score of Rheumatoid Arthritis
Authors Khaled SAA ![]() , NasrEldin E
, NasrEldin E ![]() , Makarem YS, Mahmoud HFF
, Makarem YS, Mahmoud HFF ![]()
Received 12 June 2020
Accepted for publication 19 August 2020
Published 25 September 2020 Volume 2020:13 Pages 595—606
DOI https://doi.org/10.2147/JIR.S265811
Checked for plagiarism Yes
Review by Single anonymous peer review
Peer reviewer comments 2
Editor who approved publication: Professor Ning Quan
Video abstract presented by Safaa A A Khaled.
Views: 803
Safaa AA Khaled,1 Eman NasrEldin,2 Yasmine S Makarem,3 Hamdy FF Mahmoud4,5
1Department of Internal Medicine, Clinical Hematology Unit, Assiut University Hospital/Unit of Bone Marrow Transplantation, South Egypt Cancer Institute, Faculty of Medicine, Assiut University, Assiut, Egypt; 2Department of Clinical Pathology, Assiut University Hospital, Faculty of Medicine, Assiut University, Assiut, Egypt; 3Department of Rheumatology, Rehabilitation and Physical Medicine, Assiut University Hospital, Faculty of Medicine, Assiut University, Assiut, Egypt; 4Department of Statistics, Virginia Polytechnic Institute and State University, Blacksburg, VA 24061, USA; 5Department of Statistics, Mathematics and Insurance, Faculty of Commerce, Assiut University, Assiut, Egypt
Correspondence: Safaa AA Khaled
Department of Internal Medicine, Clinical Hematology Unit, Assiut University Hospital/Unit of Bone Marrow Transplantation, South Egypt Cancer Institute, Faculty of Medicine, Assiut University, Assiut 71515, Egypt
Email [email protected]
Background and Objective: Disease activity score 28 (DAS28) for rheumatoid arthritis (RA) is the commonly used DAS; it relies on clinical parameters that could be subjective. This work aimed to create a more accurate DAS for RA and assess its validity.
Patients and Methods: The study included 98 RA patients and 53 matched controls; they were interviewed, clinically examined, their visual analogue scales (VAS) were reported, and then blood samples were withdrawn for erythrocyte sedimentation rate (ESR), complete blood count (CBC), and C-reactive protein (CRP). Platelet indices (PIs) were obtained from the CBC including Plt (platelet count), mean platelet volume (MPV), platelet distribution width (PDW) and plateletcrit (PCT). DAS28 was calculated for each patient using RheumaHelper mobile software. Minitab Statistical Package® and SPSS v20 software were used for data analysis.
Results and Conclusions: Results revealed perfect matching between patients and controls as regarding age and gender. ESR, CRP and PDW were significantly higher in patients than controls; also positive correlations were detected among these variables. A new DAS for RA was developed; ESR, CRP, PDW and MPV were the components for this index. Further analyses showed that this new score was significantly higher in patients than controls and correlated with DAS28 of the patients. Furthermore the new score could identify RA patients from healthy subjects (cut off value < − 0.79) and stratified RA patients according to their disease activity into low, intermediate, high, or in remission. Conclusively, we developed a more precise, easily obtained new DAS for RA. This new DAS has both diagnostic/prognostic values in patients with RA.
Keywords: rheumatoid arthritis, platelet indices, disease activity
Introduction
Rheumatoid arthritis (RA) is a chronic inflammatory multi-systemic disease, presented with synovitis affecting peripheral joints and causing joint pain, swelling, stiffness, and functional disability. Moreover a wide range of clinical presentations were described in patients with RA, including general constitutional symptoms such as malaise and fatigue. Extra-articular manifestations (EAMs) were also reported in RA including rheumatoid nodules, pulmonary diseases, cardiovascular manifestations, vasculitis and hematologic disorders, eg, anemia of chronic disease, macrocytic anemia and thrombocytosis. The latter was found to have a significant relationship with disease activity and EAMs of RA. This wide array of disease presentations has led to the emergence of a huge number of clinical and laboratory parameters that were used for assessing disease activity in RA patients.1–5
Measurement of disease activity in patients with RA helps guide treatment decisions and facilitates follow up; numerous disease activity measures have been developed. The DAS28 is the most commonly used one and the backbone for the European League Against Rheumatism (EULAR) response criteria. It combines information from 28 tender and swollen joints (including two shoulders, two elbows, two wrists, ten metacarpi-phalangeal joints, ten proximal inter-phalangeal joints and two knees), inflammatory markers (erythrocyte sedimentation rate (ESR) or C-reactive protein (CRP)) and visual analogue scales (VAS).6–9 It is clear that DAS28 relies mainly on subjective parameters that could vary from one patient and/or physician to another, also it neglects many important joints of the lower limbs. Moreover complex formulas and calculations are needed to estimate the score for each patient. Accordingly the search for more precise, simple and available parameters to develop new DAS in RA is very important; this new score could be used alone or together with DAS28. Since inflammation is the basic pathology in RA, it was logical to assess disease activity in patients with RA by measuring inflammatory markers. ESR and CRP are the most commonly used markers for this purpose, in daily medical practice.10
Platelets play a crucial role in pathophysiology of RA through their contribution in inflammation and immune-modulation. Activated platelets release pro-inflammatory micro-particles, which interact with white blood cells causing joint and systemic inflammation in RA. Thrombocytosis was described in RA patients during active stages of the disease, then counts decrease upon remission.11
PIs are platelet parameters that could be easily obtained by modern automated blood cell analyzers. They include mean platelet volume (MPV), platelet count, platelet distribution width (PDW), plateletcrit (PCT), and platelet large cell ratio (P-LCR). P-LCR and to a lesser extent PCT are not provided by all analyzers. MPV is the index that expresses the average platelet size, PDW measures platelet anisocytosis, PCT reflects the total platelet mass as a percent of occupied volume of blood, and lastly P-LCR measures the percentage of large platelets. Platelet count, MPV and PDW were considered as mirror images of platelet function and rate of platelet production. A relationship was reported between platelet indices (PIs) and disease activity in patients with RA.12–14 This study aimed to answer the question, could PIs be a parameter in DAS of RA, through development of a new DAS (EgyDAS)? Another aim was to assess the value of this new score in RA.
Patients and Methods
Study Design and Subjects
A cross-sectional study was done at Assiut University Hospital (AUH), in the period from May 2018 to October 2019. It was mainly at the Departments of Internal Medicine, Rheumatology, Rehabilitation and Physical Medicine. Laboratory investigations were done at the Department of Clinical Pathology, AUH.
The study included patients with RA (group1) who were admitted at the above-mentioned departments in the study period and who fulfilled the American College of Rheumatology (ACR) criteria for RA provided their age was between 18 and 70 years old (a prerequisite for admission in the study departments).15,16 Another group (group 2) of age- and gender-matched healthy volunteers, was recruited among medical students, health-care workers and physicians and was used as a control group. Patients with cardiovascular disease, hepatic or renal dysfunction, other chronic inflammatory or infectious disease were excluded from the study. Pregnancy and antiplatelet therapy were exclusion criteria as well.
Tools of Data Collection
Medical history and physical examination: Patients were interviewed and a detailed medical history was obtained, then physically examined. We followed other researchers in assessing disease activity, calculating tender and swollen joint counts and measuring VAS.17,18 The control subjects were also interviewed to collect demographic data, ensure absence of any inflammatory disease, and ascertain eligibility.
Laboratory investigations: For each patient and control subject, 8 mL of blood were collected and distributed in three vacutainer® tubes; the first tube, containing EDTA as anticoagulant for CBC including white blood cell count (TLC), hemoglobin (Hb), PLt, PCT, MPV, PDW. All samples were analyzed with CELL-DYN 3700 automated cell counter (Abbott-Germany), within 30 minutes after collection. The normal ranges adopted for platelet indices were platelet count: 145–450 x 109/L; PCT: 0.11–0.29%; MPV: 7.6–9.3 fL; PDW: 9.4–16.0%, for TLC: (4–11 × 103/uL); and for hemoglobin (males 13–17, females 12–16 g/dL).
ESR determination was obtained from blood samples collected in the second tube with sodium citrate as anticoagulant by the Westergren method, ESR was evaluated visually after 60 minutes and the reference value was 0–15 and 0–20 mm/hour for males and females, respectively.
The third tube, without anticoagulant, was centrifuged and the serum used for biochemical determination of CRP (reference value: CRP < 5 mg/L), performed on Modular P auto analyzer (Roche Diagnostics, Mannheim, Germany).
Estimation of DAS28: Evaluator global assessment (EGA) was done, where doctors assessed each patient’s disease activity on a VAS (0 to 100) mm. The scale ranges from 0 (no pain) to 100 (severe pain). Patient global assessment (PGA) was also done where patients were asked to assess their disease progression on a VAS (0 to 100 mm). They marked their assessment of how their RA has affected them, rating how they are managing from 0 (very well) to 100 (very poorly). The latter was used for generation of DAS28 for the study patients.18 Next, DAS28 was estimated for each patient according to the following equation:

To make calculations simpler the RheumaHelper (version 3.3) mobile software program was used.7,8 After calculating DAS28, patient’s disease activity was categorized according to his/her DAS28 score into one of the following:8
- Remission ≤ 2.6
- Low disease activity > 2.6–3.2
- Moderate disease activity > 3.2–5.1
- High disease activity > 5.1
Development of the New DAS (EgyDAS) in Patients with RA
The main study target was to develop a new DAS for RA that would be dependent mainly on laboratory markers of inflammation including ESR, CRP and PIs. Principal component analysis, discriminant analysis and multiple linear regressions were used to create the new score.
Ethical Considerations
The study was done in accordance with the Declaration of Helsinki; ethical approval was obtained by the research ethical committee at the Faculty of Medicine, Assiut University. The study protocol and objectives were discussed with all the study subjects, intentional participation and the right to refuse was also addressed. Absence of risk during the study was clarified and all the procedures and investigations were done as part of the patients’ medical care during hospital admissions. Patients were reassured about the results of the investigations and their disease activity. Data were collected then introduced into a personal laptop substituting patients’ names with codes to ensure confidentiality. Informed consent was obtained from all subjects participating in the study.
Statistical Analyses
Analyses were conducted using Minitab Statistical Package® (Version 18.1, Minitab Inc., developed at Pennsylvania State University, USA), however SPSS v17 software package and GraphPad prism v. 5 were also used. Quantitative variables were presented as mean, median, and standard deviation (SD), while qualitative measures are given as percentages out of the total number. The t-test was used to assess differences between the study groups (control group and patient group) and examine differences between DAS28 and EgyDAS of RA patients. The X2 test was used to compare different levels of disease severity estimated with DAS28 and EgyDAS. Pearson’s correlation co-efficient was used to measure correlation between quantitative variables. Principal component, discriminant analysis, and multiple linear regression techniques were used to obtain the EgyDAS equation. Reciever operating characteristics (ROC) curve analysis was used to obtain the optimum cut off value of EgyDAS. The statistical significance was considered significant when P ˂ 0.05, and highly significant if P ˂ 0.01.
Results
Descriptive Statistics and Manipulating Data
Tables 1 and 2 show demographic and clinical characteristics of the study participants. A total of 98 patients with RA and 53 control subjects were included in the study. Nearly 3/4 of patients were females and the female to male ratio was 2.8:1. Most (76.5%) of the patients resided in Assiut Governorate, mostly in rural areas (80.6%). The age range of RA patients was from 23 to 68 and the median 50-years old. This was nearly similar to the controls where the age range was from 27–66 and the median 49 years.
 |
Table 1 Characteristics of the Study Participants |
 |
Table 2 Extra-Articular Manifestations (EAM) of Rheumatoid Arthritis Patients Included in the Study (n=98) |
To balance the effect of the possible confounding variables, gender and age were controlled in this study. Gender was tested to see whether the two types of gender were well represented in the two groups. It was found that, in the patient group, the proportion of females was 73.47% and for males was 26.53%, and, in the control group, the proportion of females was 73.58% and 26.42% for males. Chi-square test was run to make sure absence of relationship between gender and groups and it was found that they were independent with a P-value < 0.05. This means gender will not affect the results. For age, Table 3 showed that the two groups were not significantly different in terms of mean age (P-value > 0.05).
 |
Table 3 Differences of Age, Hematologic and Inflammatory Parameters Between Rheumatoid Arthritis Patients (N= 98) and the Controls (N= 53), (Independent Sample t-test) |
One of the important assumptions of the follow-up analyses t-test, discriminant analysis and principal component analyses is normality so the Box-Cox method was used to find the transformation that achieved normality for each parameter. The skewness after transformations improved and it was acceptable as illustrated in Supplementary Figure S1 and Table S1.
Differences of Hematologic Parameters and Inflammatory Markers Between Patients and Controls
Independent sample t-test was used to differentiate hematological and inflammatory parameters between the two groups. Normality assumption of the test was met because we used the transformed parameters. Table 3 shows the summary statistics of the parameters and P-values. The two groups were significantly different in terms of all the mean parameters at 1% significance level, except for WBCs, platelet count, and MPV.
Associations Between Hematologic Parameters and Disease Severity (DAS28) in Rheumatoid Arthritis Patients of the Study
Table 4 shows the results of Pearson’s correlation between hematologic parameters and disease activity (DAS28) in the study patients. Significant positive correlations were detected between platelet count and DAS28 on one hand and PDW% in the other. Figure 1 and supplementary Table S2 reveal the correlations among parameters ESR, CRP, platelet count, PDW, MPV, and PCT. The highest correlation was between ESR and CRP (0.713 with a P-value <0.05) and the lowest significant correlation was between platelet count and CRP (0.181 with a P-value <0.05). In addition, PCT had no correlation with any other parameters.
 |
Table 4 Pearson Correlation Between Hematologic Parameters and Disease Activity Score 28 in the Study Patients |
 |
Figure 1 Scatter plots of each pair of hematologic and inflammatory parameters for the two groups – patients group (red) and the control group (blue) – along with coefficient of correlations. |
Creating the New Disease Activity Score (EgyDAS)
Principal component analysis was used first to create the initial EgyDAS. In principal component analysis, the first component was selected which had the highest Eigen value (2.58) and interpreted the highest proportion of variation using the loading coefficients. To find which parameters significantly help in separating the two groups and measuring the disease activity level, discriminant analysis was used. Table 5 shows the discriminant functions with their correct classification proportions along with the functions coefficients. The best discriminant function was function #4 that included ESR, CRP, PDW, and MPV with correct classification proportion 95.1%. However, function 1 had higher correct classification proportion but the two variables (PCT and platelet count) added only 1.6%, which was not a significant contribution.
 |
Table 5 Discriminant Functions and Their Correct Classification Proportions |
Next, to estimate the new disease activity score function, we regressed the possible parameters in each function on the initial EgyDAS to find the significant variables. We included all the parameters first (Equation 1) and we found R2=100% but some of the variables were not significant, such as platelet count. By removing platelet count, R2 did not change much which meant it was not an important parameter in creating the score. Table 6 shows that the best equation was equation 4 the one that had ESR, CRP, PDW and MPV with R2 = 98.5%. In this equation, the transformed parameters were used. In conclusion from these analyses, the new disease activity score (EgyDAS) function was:

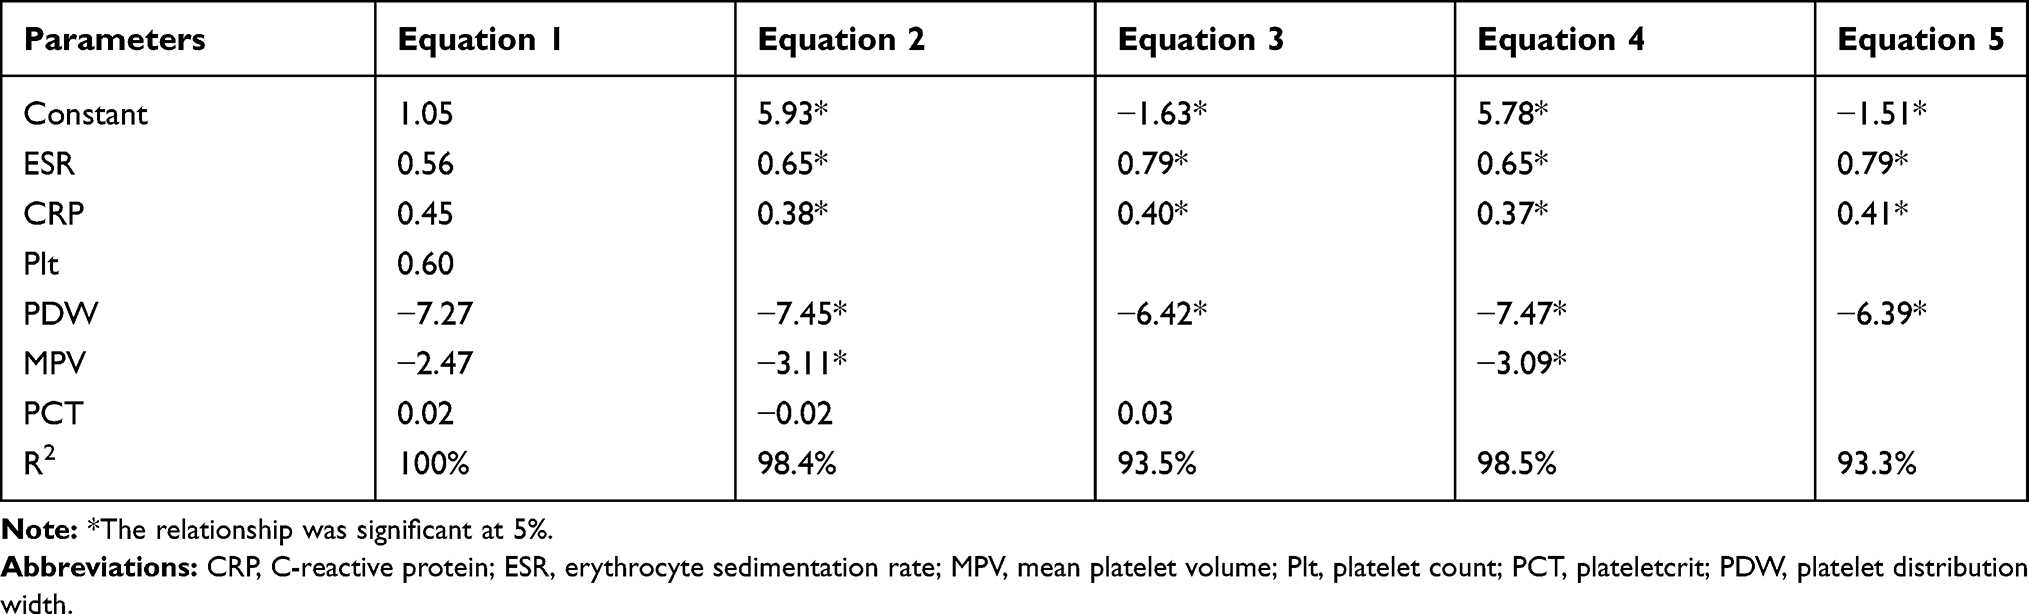 |
Table 6 Equations That Could Be Used to Develop the New Disease Activity Score (EgyDAS) |
Supplementary Table S3 shows the coefficient values of the variables included in the regression equation along with standard errors, t-values, P-values and variance inflation factor (VIF) values. For our equation, the VIF values for ESR and CRP were 3.85 and 3.31, respectively.
Differences of EgyDAS Values Between RA Patients and the Control Group
To evaluate the performance of the new score in diagnosing RA, independent sample t-test was conducted to compare the patient and control groups, as shown in Figures 2 and 3. The two groups were significantly different in terms of the median values of the EgyDAS, P-value < 0.01. The mean scores ±SD were 1.077 ± 1.274 and −1.402 ± 0.579 for patients and controls, respectively.
 |
Figure 2 Histogram of the new disease activity score (or EgyDAS) for rheumatoid arthritis patients, n=98 (blue) and the control group, n=53 (red). |
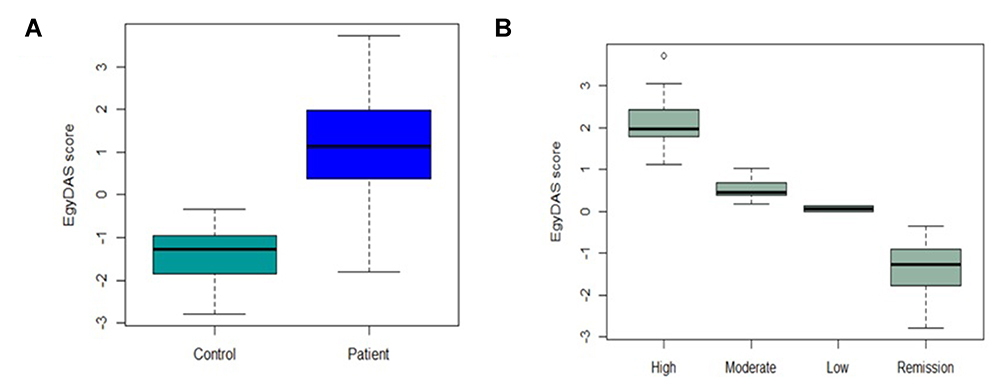 |
Figure 3 Boxplots of the new score (EgyDAS) for the control and patient groups (A), and for the new score values of different levels of disease activity (high, moderate, low, and remission) in the patient group only (B). |
Also Figure 3 showed that the new score values were different with different levels of disease activity in the study patients. The new score correctly classified 14.94% of RA patients and 100% of the control group as in remission.
Associations Between the New Disease Activity Score (EgyDAS) and the DAS28 in RA Patients of the Study
We stratified our patients according to DAS28 to high, intermediate, low and remission according to disease activity. We did this with the new score to assess the relation with DAS28.
To study the relationship between the new score and DAS28, the association was measured in two levels: using the numerical scores and the previously mentioned ordinal levels. Using the numerical scores the Pearson coefficient of correlation showed strong positive association between the two scores (r=0.756) with P-value <0.01. In addition, patients were classified using the two scores separately as high, moderate, low, and remission, and the association between the two ordered variables was measured using Spearman’s rho (0.702) and the concordance was measured using Goodman and Kruskal’s Gamma that showed strong positive association (0.85) with P-value < 0.01, as shown in Figure 4. Then we developed the equation that described the relationship between the two scores as following:

 |
Figure 4 Scatterplots of disease activity score 28 (DAS28) and the new disease activity score (EgyDAS) values for the patient group along with regression equation line and patient classification. |
Using the same criterion of DAS28 to measure the disease activity of a patient, we can set our new disease activity score (EgyDAS) limits as follows:
- Remission ≤ −0.15
- Low disease activity > −0.15–0.15
- Moderate disease activity > 0.15–1.1
- High disease activity > 1.1
Table 7 shows the coefficient of correlation values for the variables included in DAS28 and the variables included in the EgyDAS along with P-values. It reveals that PDW was correlated with DAS28 variables (P-values < 0 0.05) and MPV is not correlated with the variables of DAS28, but it was found that it is a statistically significant variable in the EgyDAS equation (P-value < 0.05), as in shown in supplementary Table S2.
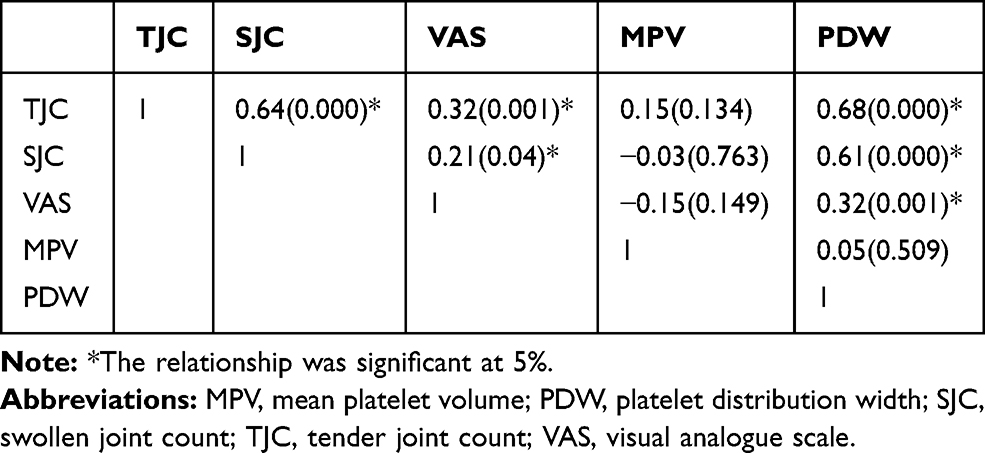 |
Table 7 Coefficient of Correlation Matrix Between Disease Activity Score 28 (DAS28) Variables: Tender Joint Count (TJC), Swollen Joint Count (SJC) and Visual Analogue Scale (VAS), and the New Disease Activity Score (EgyDAS) Variables: MPV and PDW |
Differences Between DAS28 and EgyDAS in the RA Study Patients
Figure 5 shows different disease activity levels of RA patients according to DAS28 and EgyDAS, nearly 15% were in remission according to EgyDAS compared with 11% with DAS28. However the x2 test results showed insignificant differences in categorizing patients according to disease severity between the 2-scales, P< 0.07.
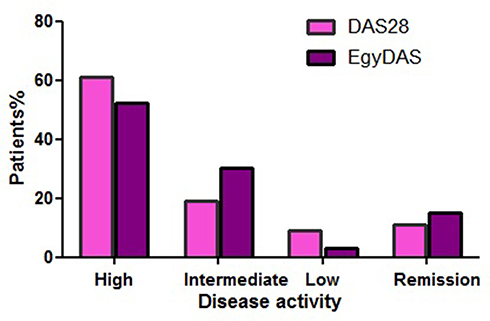 |
Figure 5 Different disease activity levels of rheumatoid arthritis patients according to disease activity score 28 (DAS28) and the new disease activity score (EgyDAS). |
Table 8 shows the one sample t-test result of differences between DAS28 and EgyDAS scores of RA patients where there was a highly significant difference between the two scores, P< 0.000, mean ± SD were 5.3 ±1.87 and 1.2 ± 0.99 for DAS28 and EgyDAS, respectively.
 |
Table 8 One-Sample t-test of Differences Between Disease Activity Score 28 (DAS28) and the New Disease Activity Score (EgyDAS) of Rheumatoid Arthritis Patients Included in the Study |
Figure 6 illustrates the ROC curve analysis of the EgyDAS in patients and controls. The area under the curve (AUC) was 0.944,SE 0.026, P< 0.000, and 95% confidence interval lower bound= 0.902 and upper bound = 0.986. The optimum cutoff value was −0.79, with 91.3% sensitivity and 88.7% specificity. This means that if a person has a low score < −0.79, he/she can be considered to not have RA disease.
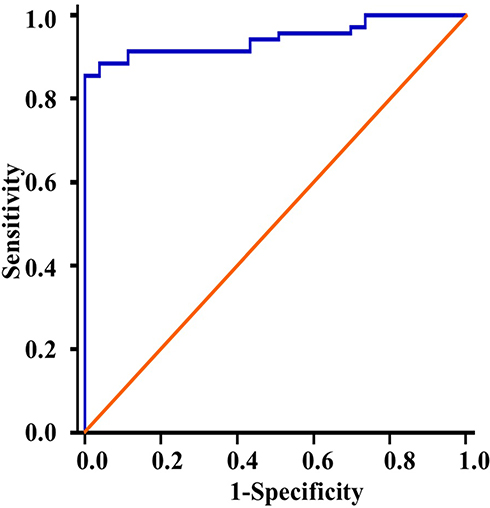 |
Figure 6 Receiver operating characteristic (ROC) curve of EgyDAS score in rheumatoid arthritis patients and the control group. P< 0.000, area under the curve (AUC) 0.944. |
Discussion
Inflammation was found to have a great impact on numbers and composition of blood cells, hence anemia, neutrophilia and thrombocytosis were described in many inflammatory disorders, accordingly the features of these cells could be used for evaluation of disease activity in these disorders.19,20 This study was conducted to assess the possibility of including PIs in disease activity score of RA, to do so 98 RA patients and 53 healthy controls were enrolled in the study. Results of this study revealed perfect matching between patients and controls in respect to age and gender, furthermore demographic and clinical characteristics of the study patients were consistent with other studies.1,21
To create a new disease activity score in RA, firstly we proved the presence or absence of differences in the inflammatory parameters under concern (ESR, CRP, platelet count, MPV, PDW and PCT) between patients and controls. Next we correlated these parameters together. In accordance with other studies we found significant differences of ESR, CRP and PDW between the two groups, and the variables were correlated together, except for PCT.12,14,22,23 On the other hand our results were contradictory to those who found a significant difference in MPV between RA patients and controls.24 However, we included MPV in the upcoming analyses of creating the new disease score because we thought its effect might be different when all the variables were simultaneously used.
In accordance with Talukdar et al23 this study revealed a significant positive correlation between DAS28 scores and platelet count and PDW. Nevertheless, Talukdar found a correlation with MPV too. These differences may be related to differences in analyses where they express disease activity categorically.25 However when we correlated the inflammatory markers under concern, the lowest correlation was between platelet count and CRP. Thus we did not include platelet count in the new disease activity score.
We carried the investigation further and created a new DAS (EgyDAS) in RA that was dependent on ESR, CRP, MPV, and PDW; this new DAS could have a diagnostic/prognostic value. Although the correlation between ESR and CRP was 0.7, we used them together in our regression model. It was found that the correlation or multicollinearity among the variables in a regression equation causes an estimation problem when the correlation values are very close to 1. This means that the information provided by both variables in the model is quite similar. This produces a problem of over-adjustment, which makes the values of approach 100%. This problem was addressed and evaluated by calculating the variance inflation factor (VIF) for the variables included in the regression equation. If any of the VIFs are greater than 5, there will be a multicollinearity problem which affects the estimation of the regression parameters.25,26 For EgyDAS equation, the VIF values for ESR and CRP were 3.85 and 3.31, respectively. So, the coefficient of correlation 0.7 does not create a problem, which means each variable still has some information to be added to the equation. The stepwise regression method was used in estimating the regression equation that was proposed in this paper and stepwise kept both variables in the equation. Our assumption was previously used in DAS28 where the coefficient of correlation between tender Joint count and swollen joint count was 0.64 and it was highly statistically significant (P-value = 0.000) but they were still included in the DAS28 equation.7 In sum, the coefficient of correlation value, 0.7, is not the reason that the value of  is close to 1 and there is no multicollinearity problem among the variables included in the regression equation of EgyDAS.
By studying the relationship between DAS28 and the EgyDAS index, they were strongly correlated together and their variables were correlated too. This meant that EgyDAS could be used to assess disease activity instead of or together with DAS28 in patients with RA, as it has both laboratory and clinical significance. Moreover, this new disease score can be used to classify the person, whether they have RA or not and measure the level of disease activity, as in DAS28. If a subject has a low Egyscore < −0.79, he/she can be considered to not have RA disease.
Now, the question is what are the advantages of using EgyDAS over DAS28 in RA? The answer is unlike DAS28, EgyDAS could provide a more precise, reliable and simple measurement of disease activity in RA, in addition it could accurately assess disease activity in patients with active forefoot arthritis.27,28 Because EgyDAS is dependent mainly on laboratory markers of inflammation, accordingly it will be a mirror image for disease activity in patients with RA. Also we think that EgyDAS will be rapidly and easily obtained as it relies on laboratory markers of inflammation while DAS28 relies on subjective symptoms and signs. Moreover EgyDAS overcomes the inter observer differences that could be present during estimation of DAS28. However the parameters used in EgyDAS are not specific for RA, rather they reflect the inflammatory response, accordingly correlation of index values with the clinical and radiologic presentation of the patient is mandatory.29,30 Another important criterion of EgyDAS compared with DAS28 is that it could identify persons with early disease and distinguish them from healthy individuals.
The main issues regarding the use of PIs in assessing DA in RA is the lack of their standardization for age and gender, and the controversies about their correlation with disease activity.31 We believed that it is time to solve both issues and apply PIs extensively in clinical practice as we did with red blood cell (RBC) indices. Our assumption relied on the marvelous advancement in experimental hematology that yielded the worldwide availability of PIs. Furthermore this assumption was supported with the current efforts and investigations to apply PIs extensively in clinical practice. Many researchers consider PIs novel biomarkers in diagnosis/prognosis of various chronic and acute conditions.32–34
Considering the first issue there are modest differences in normal CBC parameters among different hematology analyzers, however we can rely on these values for PIs as we did with other parameters, eg, WBCs and Hb, . To obtain accurate results more attention has to be paid to the temperature of storage of sample, the time before analysis, and the type of anti-coagulant used.35
Regarding the second issue, the role of platelets in inflammation and RA was extensively studied and results proved the ultimate importance of platelets in inflammatory reaction.36–38 Platelet markers or indices are simply obtained from CBC they reflect platelet function the most important indices are MPV and PDW. Thus MPV and PDW would reflect the severity of inflammation, this assumption was proved by the results of the current study and other previous studies. In the meantime these results were contradictory to others.11,14,31 To what extent this controversy would hinder the inclusion of PIs in disease activity score of RA remains to be seen. This controversy would be similar or lower than the discrepancy between the objective parameter ESR or CRP and the subjective ones, number of swollen and tender joints and VAS in DAS28. Thus PIs could be valid parameters in disease activity score of RA particularly when used in conjunction with other markers of inflammation.
Conclusion and Future Work
In conclusion, in the current study a new disease activity score for RA was developed, this score was based on laboratory markers of inflammation mainly ESR, CRP, MPV and PDW. This score has both diagnostic and prognostic significance. Based on these results we recommended the use of quantitative parameters of inflammation to assess disease activity in RA. Nevertheless, further research is needed to validate the new score with other scores and correlate with the response to treatment and radiological progression of the disease.
Acknowledgments
We would like to express our deep gratitude to all patients and controls who voluntarily participated in the study. We acknowledge VT's OASF support in the publishing of the article.
Author Contributions
All authors made a significant contribution to the work reported, whether that was in the conception, study design, execution, acquisition of data, analysis and interpretation; took part in drafting, revising or critically reviewing the article; gave final approval of the version to be published; have agreed on the journal to which the article has been submitted; and agree to be accountable for all aspects of the work.
Funding
The authors received no funding for the study.
Disclosure
The authors report no conflicts of interest in this work.
References
1. Van Riel P, van de Putte LBA. Clinical assessment and clinical trials in rheumatoid arthritis. Curr Opin Rheumatol. 1994;6(2):132–139. doi:10.1097/00002281-199403000-00003
2. Gibofsky A. Overview of epidemiology, pathophysiology and diagnosis of rheumatoid arthritis. Am J Manag Care. 2012;18(Suppl 13 Suppl):S295–302.
3. Van der Heijde DM, van ‘T Hof M, van Riel PL, et al. Development of a disease activity score based on judgment in clinical practice by rheumatologists. J Rheumatol. 1993;20(3):579–581.
4. Wolfe F, Michaud K, Pincus T. A composite disease activity scale for clinical practice, observational studies, and clinical trials: the patient activity scale (PAS/PAS-II). J Rheumatol. 2005;32(12):2410–2415.
5. Hobbs KF, Cohen MD. Rheumatoid arthritis disease measurement: a new old idea. Rheumatology. 2012;51(6):21–27. doi:10.1093/rheumatology/kes282
6. Smolen JS, Aletaha D, Bijlsma JW, et al. Treating rheumatoid arthritis to target: recommendations of an international task force. Ann Rheum Dis. 2010;69(4):631–637. doi:10.1136/ard.2009.123919
7. Prevoo ML, Van’T Hof MA, Kuper HH, et al. Modified disease activity scores that include twenty-eight-joint counts. Development and validation in a prospective longitudinal study of patients with rheumatoid arthritis. Arthritis Rheum. 1995;38(1):44–48. doi:10.1002/art.1780380107
8. Aletaha D, Nell VP, Stamm T, et al. Acute phase reactants add little to composite disease activity indices for rheumatoid arthritis: validation of a clinical activity score. Arthritis Res Ther. 2005;7(4):R796–R806. doi:10.1186/ar1740
9. Felson DT, Smolen JS, Wells G, et al. American College of Rheumatology/European League Against Rheumatism provisional definition of remission in rheumatoid arthritis for clinical trials. Arthritis Rheum. 2011;63(3):573–586. doi:10.1002/art.30129
10. Wells GA, Becker JC, Tend J, et al. Validation of the disease activity score 28 (DAS28) and EULAR response criteria based on CRP against disease progression in patients with rheumatoid arthritis, and comparison with the DAS28 based on ESR. Ann Rheum Dis. 2009;68(6):954–960. doi:10.1136/ard.2007.084459
11. Harifi G, Sibilia J. Pathogenic role of platelets in rheumatoid arthritis and systemic autoimmune diseases: perspectives and therapeutic aspects. Saudi Med J. 2016;37(4):354–360. doi:10.15537/smj.2016.4.14768
12. Kisacik B, Tufan A, Kalyoncu U, et al. Mean platelet volume (MPV) as an inflammatory marker in ankylosing spondylitis and rheumatoid arthritis. Joint Bone Spine. 2008;75(3):291–294. doi:10.1016/j.jbspin.2007.06.016
13. Muddathir AR, Haj FE. Platelet indices in Sudanese patients with rheumatoid arthritis. Asian J Biomed Pharm Sci. 2013;3(23):1–3.
14. Yildirim A, Karabiber M, Surucu GD, et al. The changes of mean platelet volume and platelet distribution width in patients with rheumatoid arthritis and their correlation with disease activity. Acta Med Mediterr. 2015;31:1105–1111.
15. Aletaha D, Neogi T, Silman AJ, et al. Rheumatoid arthritis classification criteria: an American College of Rheumatology/European League Against Rheumatism collaborative initiative. Arthritis Rheum. 2010;62(9):2569–2581. doi:10.1002/art.27584
16. Radner H, Neogi T, Smolen JS, et al. Performance of the 2010 ACR/EULAR classification criteria for rheumatoid arthritis: a systematic literature review. Ann Rheum Dis. 2014;73(1):114–123. doi:10.1136/annrheumdis-2013-203284
17. Richie DM, Boyle JA, Mclenn JM, et al. Clinical studies with an articular index for the assessment of joint tenderness in patients with rheumatoid arthritis. Q J Med. 1968;37(147):393–406.
18. Duncan GH, Bushnell MC, Lavigne GJ. Comparison of verbal and visual analogue scales for measuring the intensity and unpleasantness of experimental pain. Pain. 1989;37(3):295–303. doi:10.1016/0304-3959(89)90194-2
19. Briggs C. Quality counts: new parameters in blood cell counting. Int J Lab Hematol. 2009;31(3):277–297. doi:10.1111/j.1751-553X.2009.01160.x
20. Gürol G, Harman H, Karakeçe E, et al. Overlooked hematological markers of disease activity in rheumatoid arthritis. Int J Rheum Dis. 2016;19(11):1078–1082. doi:10.1111/1756-185X.12805
21. Silman AJ, Hochberg MC. Rheumatoid arthritis. In: Silman AJ, Hochberg MC, editors. In Epidemiology of the Rheumatic Diseases. Oxford: Oxford University Press; 2001:31–71.
22. Isik M, Sahin H, Huseyin E. New platelet indices as inflammatory parameters for patients with rheumatoid arthritis. Eur J Rheumatol. 2014;1(4):144–146. doi:10.5152/eurjrheumatol.2014.140023
23. Talukdar M, Barui G, Adhikari A, et al. A study on association between common haematological parameters and disease activity in rheumatoid arthritis. J Clin Diagn Res. 2017;11(1):EC01–EC04. doi:10.7860/JCDR/2017/23524.9130
24. Tekeolu I, Gürol G, Karakeçe E, et al. Mean platelet volume: a controversial marker of disease activity in rheumatoid arthritis. Ann Rheum Dis. 2014;873:885.
25. Gujarati DN,Porter DC. Multicollinearity: What Happens if the Regressors are Correlated? In Basic Econometrics.
26. O’Brien RM. A caution regarding rules of thumb for variance inflation factors. Qual Quant. 2007;41(5):673–690. doi:10.1007/s11135-006-9018-6
27. Mäkinen H, Kautiainen H, Hannonen P, Sokka T. Is DAS28 an appropriate tool to assess remission in rheumatoid arthritis? Ann Rheum Dis. 2005;64(10):1410–1413. doi:10.1136/ard.2005.037333
28. Landewé R, van der Heijde D, van der Linden S, et al. Twenty-eight-joint counts invalidate the DAS28 remission definition owing to the omission of the lower extremity joints: a comparison with the original DAS remission. Ann Rheum Dis. 2006;65(5):637–641. doi:10.1136/ard.2005.039859
29. Milovanovic M, Nilsson E, Järemo P. Relationships between platelets and inflammatory markers in rheumatoid arthritis. Clin Chim Acta. 2004;343(1–2):237–240. doi:10.1016/j.cccn.2003.12.030
30. Schipper LG, van Hulst LT, Grol R, et al. Meta-analysis of tight control strategies in rheumatoid arthritis: protocolized treatment has additional value with respect to the clinical outcome. Rheumatology (Oxford). 2010;49(11):2154–2164. doi:10.1093/rheumatology/keq195
31. Kim DA, Kim TY. Controversies over the interpretation of changes of mean platelet volume in rheumatoid arthritis. Platelets. 2011;22(1):79–80. doi:10.3109/09537101003663758
32. Tang J, Gao X, Zhi M, et al. Plateletcrit: a sensitive biomarker for evaluating disease activity in Crohn’s disease with low hs-CRP. J Dig Dis. 2015;16(3):118–124. doi:10.1111/1751-2980.12225
33. Razak M, Akif A, Nakeeb N, et al. The relationship of mean volume and albuminuria in patients with type 2 diabetes mellitus. Diabetes Metab Syndr. 2019;13(4):2633–2639. doi:10.1016/j.dsx.2019.07.021
34. Pogorzelska K, Krętowska A, Krawczuk-Rybak M, et al. Characteristics of platelet indices and their prognostic significance in selected medical condition- a systematic review. Adv Med Sci. 2020;65(2):310–315. doi:10.1016/j.advms.2020.05.002
35. Mathur SC, Schexneider KI, Hutchison RE. Haematopoiesis. In: McPherson RA, Pincus MR, editors. Henry’s Clinical Diagnosis and Management by Laboratory Methods.
36. Boilard E, Nigrovic PA, Larabee K, et al. Platelets amplify in inflammation in arthritis via collagen-dependent microparticle production. Science. 2010;327(5965):580–583. doi:10.1126/science.1181928
37. Gasparyan AY, Stavropoulos-Kalinoglou A, Mikhailidis DP, et al. Platelet function in rheumatoid arthritis: arthritic and cardiovascular implications. Rheumatol Int. 2011;31(2):153–164. doi:10.1007/s00296-010-1446-x
38. Nurden AT. Platelets, inflammation and tissue regeneration. Thromb Haemost. 2011;105(Suppl 1):S13–S33. doi:10.1160/THS10-11-0720
 © 2020 The Author(s). This work is published and licensed by Dove Medical Press Limited. The
full terms of this license are available at https://www.dovepress.com/terms
and incorporate the Creative Commons Attribution
- Non Commercial (unported, 3.0) License.
By accessing the work you hereby accept the Terms. Non-commercial uses of the work are permitted
without any further permission from Dove Medical Press Limited, provided the work is properly
attributed. For permission for commercial use of this work, please see paragraphs 4.2 and 5 of our Terms.
© 2020 The Author(s). This work is published and licensed by Dove Medical Press Limited. The
full terms of this license are available at https://www.dovepress.com/terms
and incorporate the Creative Commons Attribution
- Non Commercial (unported, 3.0) License.
By accessing the work you hereby accept the Terms. Non-commercial uses of the work are permitted
without any further permission from Dove Medical Press Limited, provided the work is properly
attributed. For permission for commercial use of this work, please see paragraphs 4.2 and 5 of our Terms.