Back to Journals » Clinical Ophthalmology » Volume 16
Validation of an Algorithm for the Prediction of Diabetic Retinopathy in Type 1 Diabetic Patients in a Spanish Population
Authors Romero-Aroca P ![]() , Baget-Bernaldiz M, Navarro-Gil R, Feliu A, Maarof N, Moreno A
, Baget-Bernaldiz M, Navarro-Gil R, Feliu A, Maarof N, Moreno A ![]() , Cristiano J
, Cristiano J ![]() , Valls A
, Valls A ![]()
Received 8 December 2021
Accepted for publication 2 March 2022
Published 10 March 2022 Volume 2022:16 Pages 715—722
DOI https://doi.org/10.2147/OPTH.S351790
Checked for plagiarism Yes
Review by Single anonymous peer review
Peer reviewer comments 2
Editor who approved publication: Dr Scott Fraser
Pedro Romero-Aroca,1 Marc Baget-Bernaldiz,1 Raul Navarro-Gil,1 Albert Feliu,2 Najla Maarof,3 Antonio Moreno,3 Julian Cristiano,3 Aida Valls3
1Ophthalmology Department, University Hospital Sant Joan, Institute of Health Research Pere Virgili (IISPV), Universitat Rovira & Virgili, Tarragona, Spain; 2Pediatric Department, University Hospital Sant Joan, Institute of Health Research Pere Virgili (IISPV), Universitat Rovira & Virgili, Tarragona, Spain; 3Department of Computer Engineering and Mathematics, Universitat Rovira & Virgili, ITAKA-Intelligent Technologies for Advanced Knowledge Acquisition, Tarragona, Spain
Correspondence: Pedro Romero-Aroca, Hospital Universitario Sant Joan de Reus, Avda. Dr. Josep Laporte 2, Reus, 43204, Spain, Email [email protected]
Aim: The aim of the present study was to build a clinical decision support system (CDSS) that can predict the presence of diabetic retinopathy (DR) in type 1 diabetes (T1DM) patients.
Material and Method: We built two versions of our CDSS to predict the presence of any-type DR and sight-threatening DR (STDR) in T1DM patients. The first version was trained using 324 T1DM and 826 T2DM patients. The second was trained with only the 324 T1DM patients.
Results: The first version achieved an accuracy (ACC) = 0.795, specificity (SP) = 83%, and sensitivity (S) = 65.7% to predict the presence of any-DR, and an ACC = 0.918, SP = 87.1% and S = 87.8% for STDR. The second model achieved ACC = 0.799, SP = 87.5% and S = 86.3% when predicting any-DR and ACC = 0.937, SP = 90.9% and S = 83.0% for STDR.
Conclusion: The two models better predict STDR than any-DR in T1DM patients. We will need a larger sample to strengthen our results.
Keywords: diabetic retinopathy, type 1 diabetes mellitus, clinical decision support system
Introduction
Diabetes mellitus (DM) is a global disease whose incidence is increasing rapidly. In Europe alone, 59 million people are affected (2019 data) by Type 1 (T1DM) and Type 2 (T2DM) diabetes mellitus, a number that is predicted to rise by 15% to 68 million by 2045.1 These diseases bring their own complications, such as microangiopathy, of which diabetic retinopathy (DR), an ocular manifestation, is the most frequent cause of poor vision and blindness for these patients. Science associations recommend that ophthalmology units, with the support of general practitioners, endocrinologists, and paediatricians, carry out regular screening of the retina at various frequencies depending on the risk of progression to DR.2,3
Screening for DR needs to be carried out annually,2,3,4 and early detection is crucial for establishing the most effective treatments. For patients with DM but without DR, it is very important to monitor each patient according to their level of risk.5–7
To personalize DR screening programmes, we have developed an algorithm named RETIPROGRAM, a diagnostic aid system for T2DM patients.9 The aim of present study was to build a new algorithm that can include T1DM patients.
Methods
Setting
The reference population in our area is 247,174. The total number of DM patients registered with our Health Care Area (University Hospital Saint Joan, Tarragona, Spain) is 17,792, 5% of whom are T1DM patients. Our DR screening programme has been ongoing since 1st January 2007, when we started offering annual retinography to our DM patients, including T1DM patients. The screening programme is described more completely elsewhere.10
Design
The aim of the present study was to build an effective Clinical Decision Support System (CDSS) for predicting diabetic retinopathy in T1DM patients, because the one we created originally (RETIPROGRAM) was not built for T1DM patients. To achieve this, we decided to build two models and evaluate which one worked better. The first model included both T1DM and T2DM patients (324 and 826, respectively) as recommended by our epidemiologist, and the second CDDS included only T1DM patients.
Ethics
The study was approved by the Ethics Committee of Institut d’Investigació Sanitària Pere Virgili.
Model Construction
Our CDSS for diabetic retinopathy (RETIPROGRAM) was built from a sample of patients taken from our own DM population of 17,792 under the care of Hospital Universitari Sant Joan de Reus. Briefly, the algorithm was based on a statistical analysis that uses fuzzy decision trees, with a distribution of different risk variables at the nodes of multiple trees. Our algorithm has 200 trees with three variables at each node used for prediction.11 The variables considered significant were: age, sex, body mass index, duration of DM, treatment of DM, arterial hypertension control, HbA1c in %, microalbuminuria, and glomerular filtration rate determined by the CKD-EPI formula (Figure 1 shows the finished model).12 Figure 2 shows how the system works. First, a patient’s variables are introduced to the algorithm, then the system analyses the data and gives the percentage probability (%) that the patient either has retinopathy or not, the result not being indeterminate rather than clearly defined. Finally, in the output, the system indicates the percentage probability risk of DR to the patient: no risk, or low, moderate or high risk. Based on each of these 4 results, or outputs, the system indicates when the patient should go to the ophthalmologist. In the present study we trained the algorithm in two models. In the first, 195 T1DM patients and 495 T2DM patients were randomly chosen from our screened population and, from those, the testing step was carried out using a sample of 129 T1DM and 331 T2DM, again randomly chosen. In the second model, the algorithm was re-trained with only the T1DM patients and 195 T1DM were randomly chosen for training the model and the remaining 129 T1DM patients for testing.
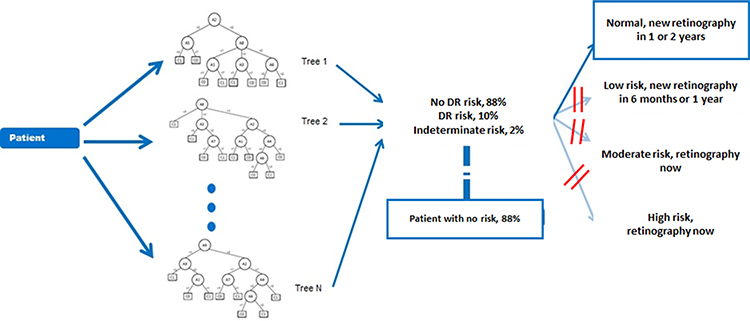 |
Figure 1 An example of the RETIPROGRAM application for a patient at high risk of developing diabetic retinopathy. |
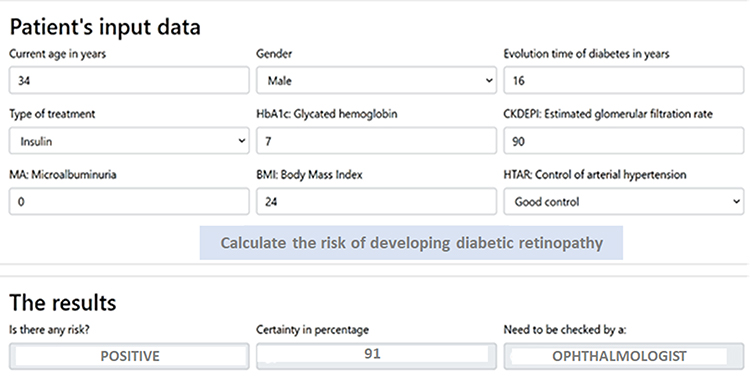 |
Figure 2 An example of a decision tree. We describe the process in four columns. The first column indicates the input of a patient’s data (we introduce the nine variables that we determined), the second column shows the fuzzy decision tree model, the third column indicates the probability in percentage of having retinopathy or not, and if the algorithm if the result is indeterminate it is shown as a percentage. For example in this case patient has an 88% probability of no risk of retinopathy. The last column shows the recommendation for the next visit accordingly. |
Inclusion Criteria
Patients with T1DM or T2DM, as diagnosed and listed at Hospital Universitari Sant Joan de Reus.
Exclusion Criteria
Patients with other types of diabetes.
Diagnosis of Diabetic Retinopathy
Two senior retina ophthalmologists diagnosed the condition based on EURODIAB guidelines,13 using a non-mydriatic fundus camera, which took two 45° field retinal photographs (TOPCON® TRC-NW6S), one centred on the macula and the other on the temporal side of the optic nerve. DR was confirmed by the ophthalmologist after a hospital visit with new retinographs. The diagnosis was confirmed when microaneurysms were present in the retinographs in the absence of other known causes of the changes, and the DR severity was classified according to the International Diabetic Retinopathy Classification.14 For the statistical study we classified DR as follows: any-DR, which included all forms of DR (mild, moderate, severe, and proliferative), and sight-threatening DR (STDR), which in our model included all forms of DR except mild-DR. Different from other studies, we included moderate-DR within STDR because all those patients in our sample had an associated diabetic macular edema.
Statistical Methods
Data evaluation and analysis was carried out using SPSS 22.0 statistical software at a significance of p<0.05. We measured the screening performance of the study using a confusion matrix/contingency. Given a classified data set, there were four basic combinations of actual and assigned: correct positive assignments, or true positives (TP), correct negative assignments, or true negatives (TN), incorrect positive assignments, or false positives (FP), and incorrect negative assignments, or false negatives (FN).
The statistical evaluation of the data set included:
- sensitivity (S),
- specificity (SP),
- positive predictive value or precision (PPV),
- negative predictive value (NPV),
- positive false discovery rate or type 1 error (α) (FP),
- negative false discovery rate or type 2 error (β) (FN), and
- the accuracy or diagnostic effectiveness expressed as a proportion of correctly classified subjects (ACC).
ACC is affected by prevalence with the same S and SP, the diagnostic accuracy of a particular test increasing as the disease prevalence decreases, which was not the case in the present study. We did not use Area under the ROC curve (AUC) because it is a global measure of diagnostic accuracy but tells us nothing about individual parameters, such as S and SP. Where two tests have an identical or similar AUC, one can have significantly higher S and the other significantly higher SP. Furthermore, data on AUC says nothing about predictive values or about the contribution of the test in ruling-in and ruling-out a diagnosis. AUC can be determined when the classification method returns a continuous number between 0 and 1. Depending on a threshold, the answer can mean class 0 or class 1. Our method did not give a continuous value, but returned the class directly; therefore, no graph that depends on any threshold was suitable in this case.
Results
Demographic Study of Sample Size
The initial sample included 324 T1DM patients and 826 T2DM patients. Table 1 describes the demographic analysis of sample size.
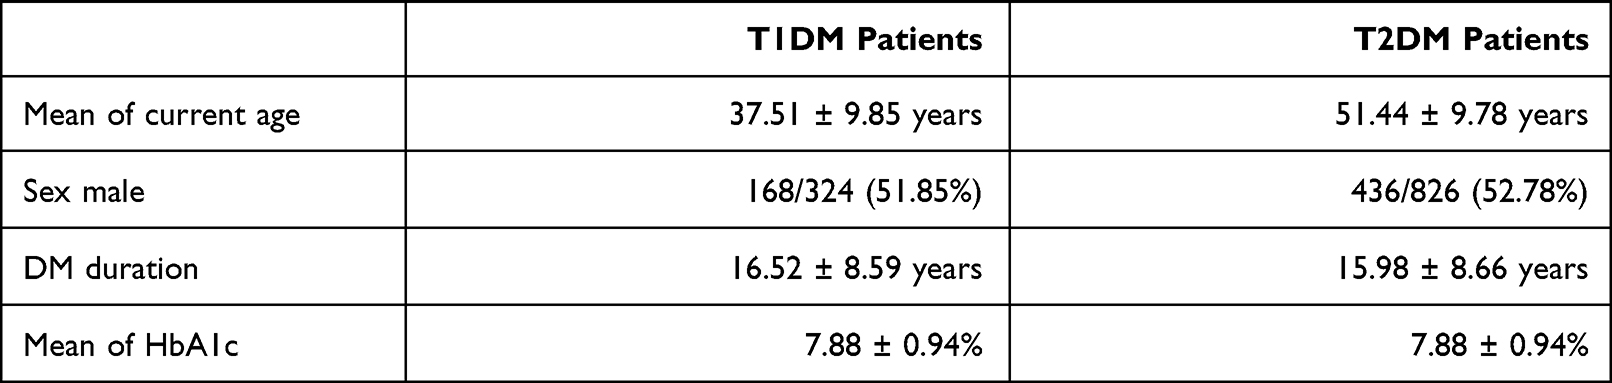 |
Table 1 Demographic Characteristics of Our Sample Size |
The prevalence of DR in the T1DM sample size was 81 (25%) patients who had any form of DR (25% of prevalence). By severity, 32 patients had mild-DR, 23 patients had moderate-DR, 21 patients had severe-DR and 5 patients had proliferative DR. Prevalence of DR sample size was 195 (23.60%) in T2DM patients and, by severity, 89 patients had mild-DR, 66 patients had moderate-DR, 31 patients had severe-DR and 9 patients had proliferative DR.
In the present study, sight-threatening diabetic retinopathy (STDR) was defined as all those who presented moderate-DR or higher. In total, STDR was diagnosed for 46 T1DM patients and 106 T2DM patients.
Trained Model with T1DM + T2DM Patients Applied to T1DM Patients
Table 2 shows the first trained model with T1DM together with T2DM. Results for predicting any-DR have poorer values than for predicting STDR. Predicting any-DR has ACC = 0.795 with S = 65.7%, which is low, and S = 65.7%. All these values are lower than those for predicting STDR with ACC= 0.918, S = 87.1% and a sensitivity of 87.8%. We conclude that this model is more effective for STDR than any-DR detection.
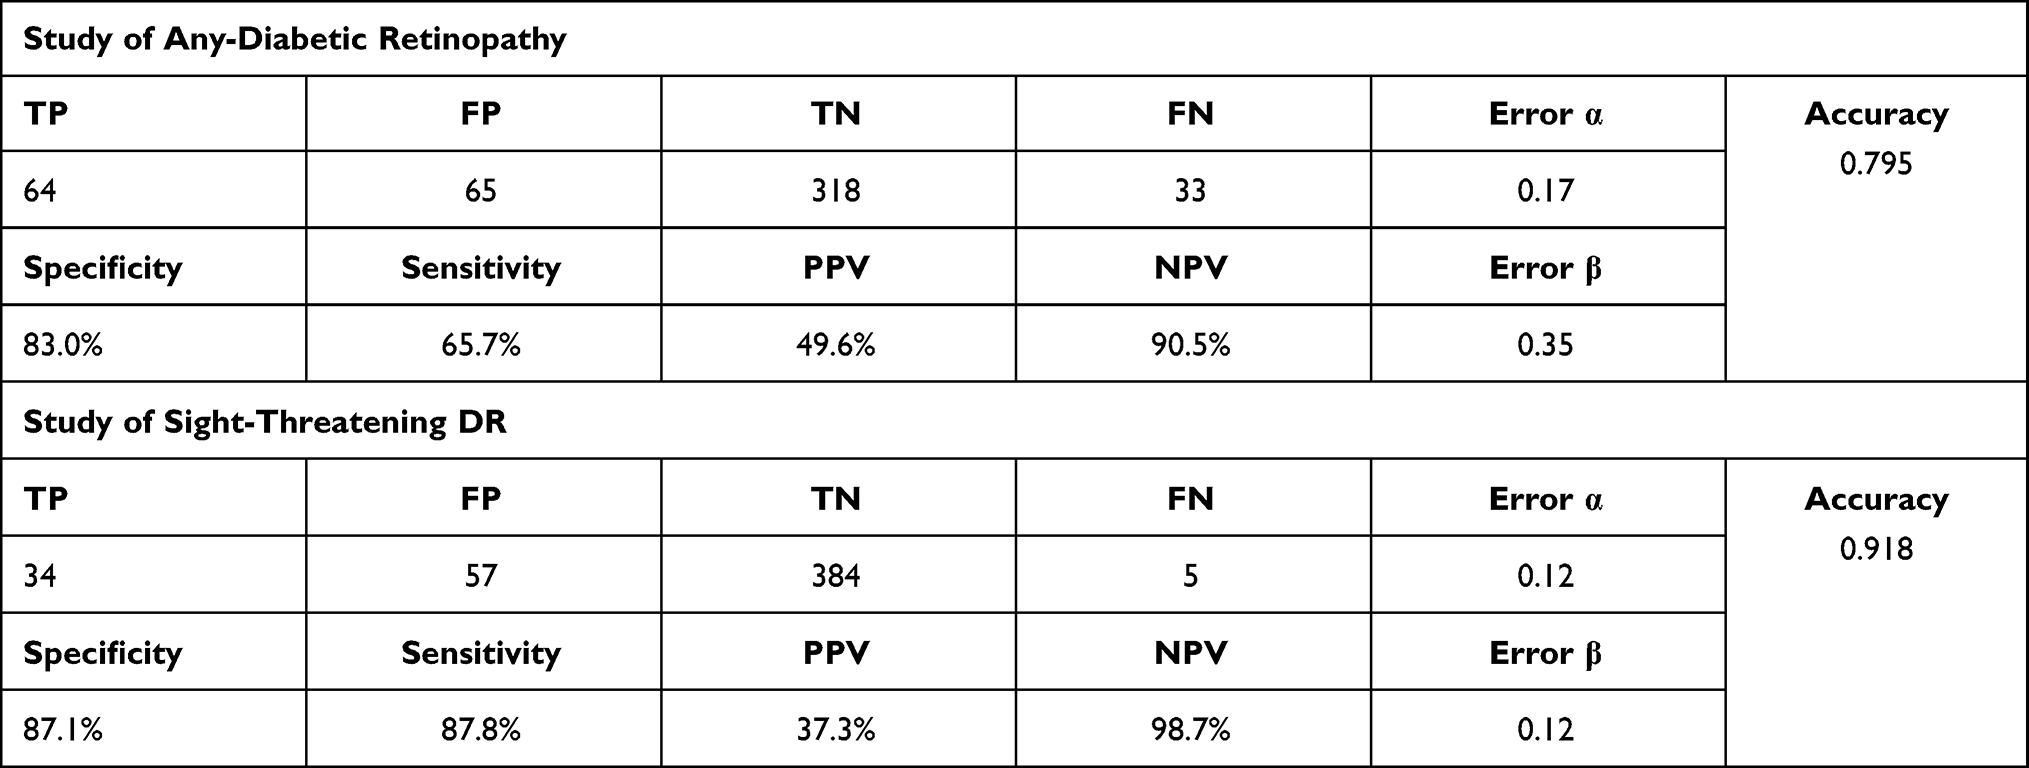 |
Table 2 The first algorithm applied to a sample of T1DM and T2DM patients and tested on a sample of T1DM and T2DM patients. The algorithm better estimated the risk of having more advanced forms of DR. |
Trained Algorithm with Only T1DM Applied to T1DM Patients
Table 3 shows the second trained model with only T1DM patients. The prediction values for any-DR were ACC = 0.799, SP = 87.5%, and S = 86.3%, which were similar to those obtained in the first model but with higher sensitivity. However, this model proved to be highly effective in predicting STDR patients with an ACC = 0.937, SP = 90.9% and S = 83.0%. Comparing the two models, they were poor at predicting any-DR but effective at predicting STDR.Table 3. The second algorithm trained with only T1DM patients and tested on a sample of T1DM patients. It showed better results when predicting the risk of having sight-threatening DR compared to any form of DR.
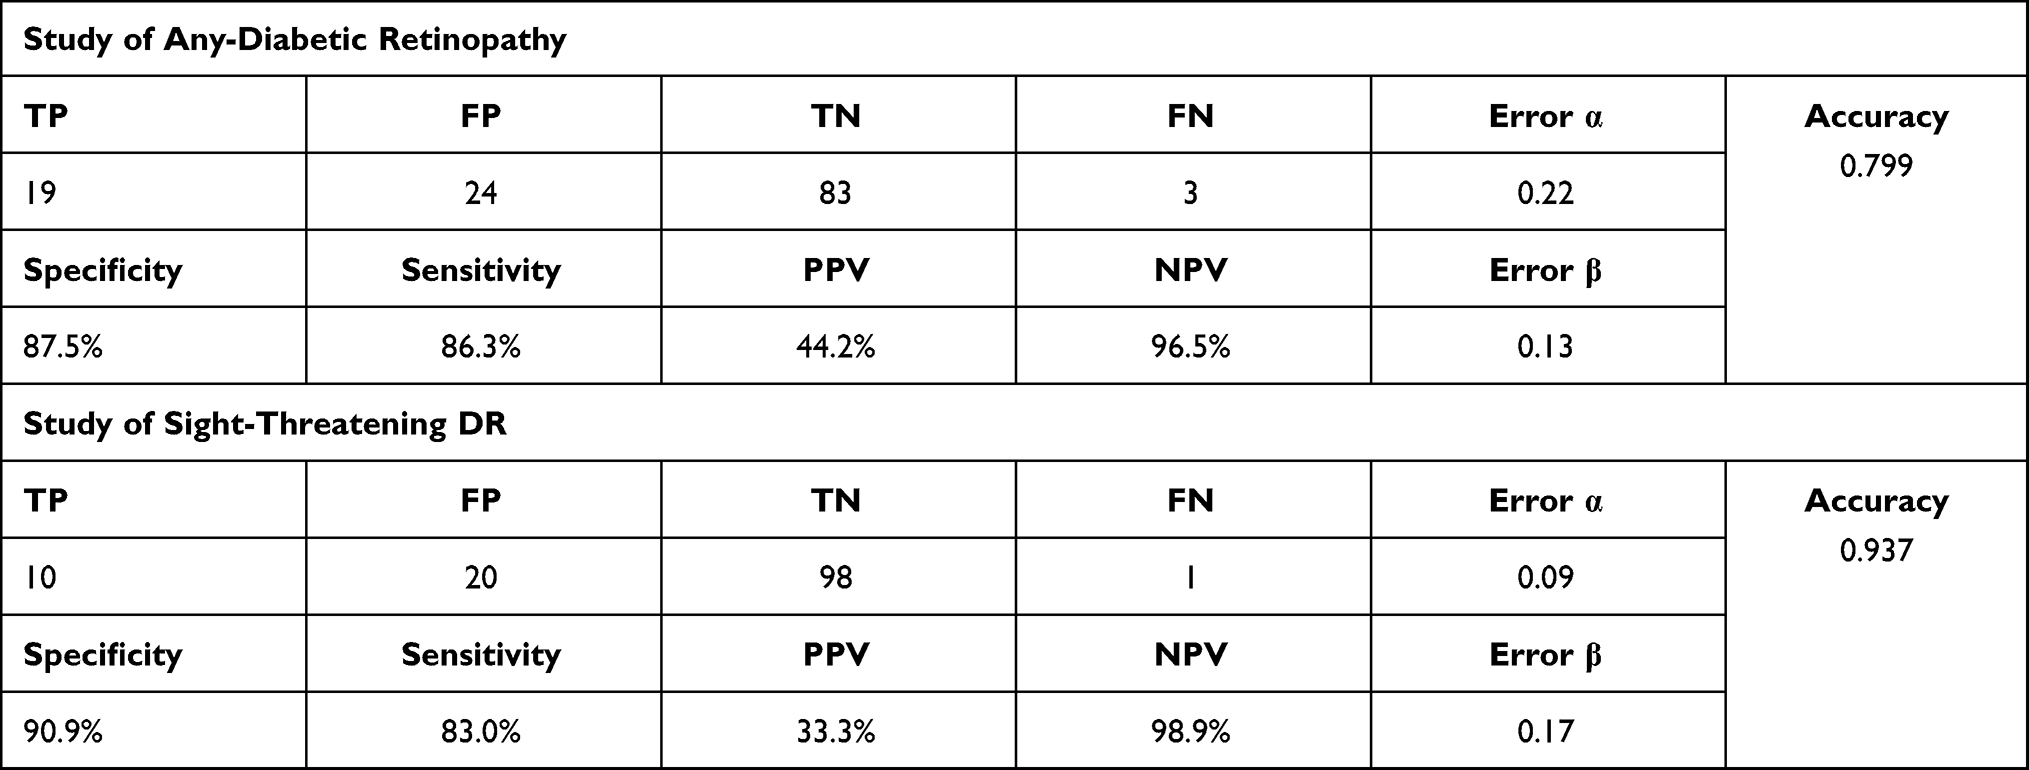 |
Table 3 The second algorithm re-trained with only T1DM patients and tested on a sample of T1DM patients. It showed better results when predicting the risk of having sight-threatening DR compared to any form of DR. |
Discussion
In a previous study, we demonstrated that the nine-year incidence of DR for T1DM patients was different from that found for T2DM patients. We were not able to show what the causes of these differences were based on the studied risk factors.8 In the present study, we wanted to determine whether our DR prediction model, which works well for patients with T2DM, was as effective in a sample of our patients with T1DM. Given that it is a population controlled by the same general practitioners and endocrinologists, we considered that the 9 independent variables used in our algorithm to determine levels of risk of DR might also be effective for patients with T1DM. However, the present study has only demonstrated that for risk of STDR and not for risk of any-DR.
As the developed algorithm was not effective enough, we decided to rework it (re-train) in two different ways, one with a mix of T1DM and T2DM patients then applying it to a similar sample, and another only with T1DM patients then applying that to a similar sample. However, neither of those two new algorithms worked effectively enough. The two models are effective at determining the risk for STDR but not for any-DR.In the first, we achieved high specificity (83%) to predict patients who will not develop DR but low sensitivity when predicting those at risk of developing DR. In the second, we achieved high specificity (86.3%) when predicting those who will not develop DR but a low sensitivity (65.7%) to predict T1DM patients at risk of developing DR when predicting those who will not develop. In addition, accuracy was not significant enough in either algorithm, 0.795 in the first and 0.799 in the second. We can conclude, therefore, that our algorithm is less effective for T1DM patients.
It is difficult to compare the present study to other similar studies since our results are poor. So far, two algorithms have proven useful in predicting DR in patients with T2DM, one developed by Aspelund et al,15 a second developed by Schreur21 and other by Broadbent et al,16,17 although the three studies predict only the risk of developing STDR and not any-DR.
Aspelund15 divided the patients according to diabetes type, T1DM or T2DM, which suggests that they had similar problems to ours for patients with T1DM. Their algorithm was based on the duration of DM, the HbA1c% value and systolic blood pressure values, independent variables that we also included, although their HbA1c values were fixed at 1% increases from 6% to 12%, whereas ours were not. In addition, we included renal function (microalbuminuria and glomerular filtration rate) and body mass index (BMI) values. The algorithm yielded good results for identifying those patients who might develop STDR,18–20 but not those who might develop the early stages of DR.
In a series of 268 patients with T1DM, after a follow-up of 4.6 years, Schreur et al,21 using Aspelund model demonstrated that the annual screening could be reduced by 58% if the condition of the retina initially is included as an independent variable within the algorithm, although, again, it was still only effective for patients at risk of STDR.
In the Broadbent et al model,16 the predictive results for patients with T2DM at risk of developing STDR are excellent. The algorithm is based on the following risk factors: age, sex, DM duration, systolic and diastolic pressure, HbA1c, and total cholesterol. It was applied to 179 patients with T1DM, but their results did not report the cohort by type of DM, so we do not know if they were as effective in the case of patients with T1DM as in the rest of the sample, which included a total of 4538 patients with DM.17,22
In summary, comparing the results of our study with these two models, we can say that the DR risk algorithms predict with some accuracy the risk of STDR in T1DM patients as our study, but not the risk of the early stages of DR (any-DR).
It is important to determine the risk of DR in its initial phase, because with a stricter glycaemic and arterial hypertension control, DR evolution can be delayed or its severity reduced, as evidenced by various studies.23–26 It is therefore important to continue to try to determine more accurately which DR risk factors will differentiate patients with T1DM or T2DM, so that we can predict risk in the initial stages rather than having to wait for STDR to appear.One limitation of the present study is the small sample size of 324 patients, which might not be sufficient to demonstrate our results with confidence. In addition, we limited ourselves to determining the effect of the 9 risk factors upon which our algorithm was built, therefore for T1DM patients insulin treatment might be useful as an additional variable in future studies. In addition, arterial hypertension is rare in patients with T1DM, and higher BMI scores might be more significant in T2DM patients.
Conclusions
The built model is useful for predicting risk of STDR but has limitations for predicting the risk of any-DR. It would be necessary to obtain a larger sample of patients to achieve better results.
Abbreviations
AL, axial length; IOL, intraocular lens; SRK/T, Sanders, Retzlaff, and Kraft/theoretical.
Institutional Review Board Statement
The study was conducted according to the guidelines of the Declaration of Helsinki and approved by the ethics committee (Comite Etico de Investigaciones con medicamentos CEIM/IISPV) (approval no. CEIM 028/2018).
Data Sharing Statement
All data included in this study are available from the corresponding author upon reasonable request.
Ethics Approval and Informed Consent
The study was approved by the Ethics Committee of Institut d’Investigació Sanitària Pere Virgili. The study was carried out with the approval of the local ethics committee (approval no. 13-01-31/proj6) and in accordance with revised guidelines of the Declaration of. We applied an optout arrangement to obtain the informed consent for this observational study, which involved the analysis of medical records. The confidentiality of patient data was maintained.
Acknowledgments
We thank all paediatricians, general practitioners, and endocrinologists in our area who have helped us to implement the new screening system using the non-mydriatic fundus camera, and our camera technicians for their work and interest in the diabetes screening. We thank Up2smart for its image analysis support. We thank all the patients as participants in the present study. We also thank Phil Hoddy for his language assistance and for editing and correcting the English text.
Funding
This research was funded by Instituto de Salud Carlos III SPAIN, grant number: FIS projects PI18/00169 and European Regional Development fund (FEDER) European Union.
Disclosure
The authors declare no conflict of interest.
References
1. International Diabetes Federation. IDF Diabetes Atlas, 9th Edn. Brussels, Belgium:International Diabetes Federation; 2019:5–14.
2. American Diabetes Association. Microvascular complications and foot care: standards of medical care in diabetes—2018. Diabetes Care. 2018;41(Suppl. 1):S105–S118. doi:10.2337/dc18-S010
3. Ghanchi F; Diabetic Retinopathy Guidelines Working Group. The Royal College of Ophthalmologists’ clinical guidelines for diabetic retinopathy: a summary. Eye (Lond). 2013;27(2):285–287. doi:10.1038/eye.2012.287
4. Wong TY, Sun J, Kawasaki R, et al. Guidelines on diabetic eye care: the International Council of Ophthalmology. Ophthalmology. 2018;125(10):1608–1622. doi:10.1016/j.ophtha.2018.04.007
5. Olafsdóttir E, Stefánsson E. Biennial eye screening in patients with diabetes without retinopathy: 10-year experience. Br J Ophthalmol. 2007;91:1599–1601. doi:10.1136/bjo.2007.123810
6. Chalk D, Pitt M, Vaidya B, Stein K. Can the retinal screening interval be safely increased to 2 years for type 2 diabetic patients without retinopathy? Diabetes Care. 2012;35:1663–1668. doi:10.2337/dc11-2282
7. Agardh E, Tababat-Khani P. Adopting 3-year screening intervals for sight- threatening retinal vascular lesions in type 2 diabetic subjects without retinopathy. Diabetes Care. 2011;34:1318–1319. doi:10.2337/dc10-2308
8. Romero-Aroca P, Navarro-Gil R, Valls-Mateu A, Sagarra-Alamo R, Moreno-Ribas A, Soler N. A differences in incidence of diabetic retinopathy between type 1 and 2 diabetes mellitus: a nine-year follow-up study. Br J Ophthalmol. 2017;101:1346–1351. doi:10.1136/bjophthalmol-2016-310063
9. Pedro RA, Aida VM, Antonio MR, et al. A Clinical Decision Support System (CDSS) for diabetic retinopathy screening. Creating a clinical support application. Telemed J E Health. 2019;25:31–40. doi:10.1089/tmj.2017.0282
10. Romero-Aroca P, de la Riva-fernandez S, Valls-Mateu A, Sagarra-Alamo R, Moreno-Ribas A, Soler N. Changes observed in diabetic retinopathy: eight-year follow-up of a Spanish population. Br J Ophthalmol. 2016;100:1366–1371. doi:10.1136/bjophthalmol-2015-307689
11. Saleh E, Błaszczyński J, Moreno A, et al. Learning ensemble classifiers for diabetic retinopathy assessment. Artif Intell Med. 2018;85:50–63. doi:10.1016/j.artmed.2017.09.006
12. Romero-Aroca P, Verges-Pujol R, Santos-Blanco E, et al. Validation of a diagnostic support system for diabetic retinopathy based on clinical parameters. Transl Visual Sci Technol. 2021;10(3):17. doi:10.1167/tvst.10.3.17
13. Aldington SJ, Kohner EM, Meuer S, Klein R, Sjolie AK. Methodology for retinal photography and assessment of diabetic retinopathy, The EURODIAB IDDM complications study. Diabetologia. 1995;38:437–444. doi:10.1007/BF00410281
14. Wilkinson CP, Ferris FL, Klein RE, et al. Proposed international clinical diabetic retinopathy and diabetic macular edema disease severity scales. Ophthalmology. 2003;110:1677–1682. doi:10.1016/S0161-6420(03)00475-5
15. Aspelund T, Thornórisdóttir O, Olafsdottir E, et al. Individual risk assessment and information technology to optimizes diabetic retinopathy. Diabetologia. 2011;54:2525–2532. doi:10.1007/s00125-011-2257-7
16. Broadbent DM, Sampson CJ, Wang A, et al.; ISDR Study Group. Individualised screening for diabetic retinopathy: the ISDR study-rationale, design and methodology for a randomised controlled trial comparing annual and individualised risk-based variable-interval screening. BMJ Open. 2019;9:e025788. doi:10.1136/bmjopen-2018-025788
17. Broadbent DM, Wang A, Cheyne CP, et al.; ISDR Study Group. Safety and cost-effectiveness of individualised screening for diabetic retinopathy: the ISDR open-label, equivalence RCT. Diabetologia. 2021;64:56–69. doi:10.1007/s00125-020-05313-2
18. van der Heijden AA, Walraven I, van ‘t Riet E, et al. Validation of a model to estimate personalized screening frequency to monitor diabetic retinopathy. Diabetologia. 2014;57:1332–1338. doi:10.1007/s00125-014-3246-4
19. Lund SH, Aspelund T, Kirby P, et al. Individualized risk assessment for diabetic retinopathy and optimization of screening intervals: a scientific approach to reducing healthcare costs. Br J Ophthalmol. 2016;100(5):683–687. doi:10.1136/bjophthalmol-2015-307341
20. Estil S, Steinarsson AÞ, Einarsson S, Aspelund T, Stefánsson E. Diabetic eye screening with variable screening intervals based on individual risk factors is safe and effective in ophthalmic practice. Acta Ophthalmologica Scandinavica. 2020;98:343–346. doi:10.1111/aos.14425
21. Schreur V, Ng H, Nijpels G, et al. Validation of a model for the prediction of retinopathy in persons with type 1 diabetes. Br J Ophthalmol. 2021;105:1286–1288. doi:10.1136/bjophthalmol-2018-313539
22. Byrne P, Thetford C, Gabbay M, Clarke P, Doncaster E, Harding SP; ISDR Study Group. Personalising screening of sight-threatening diabetic retinopathy - qualitative evidence to inform effective implementation. BMC Public Health. 2020;20:881. doi:10.1186/s12889-020-08974-1
23. White NH, Sun W, Cleary PA, et al. Prolonged effect of intensive therapy on the risk of retinopathy complications in patients with type 1 diabetes mellitus: 10 years after the Diabetes Control and Complications Trial. Arch Ophthalmol. 2008;126:1707–1715. doi:10.1001/archopht.126.12.1707
24. Aiello LP; DCCT/EDIC Research Group. Diabetic retinopathy and other ocular findings in the diabetes control and complications trial/epidemiology of diabetes interventions and complications study. Diabetes Care. 2014;37:17–23. doi:10.2337/dc13-2251
25. Lachin JM, White NH, Hainsworth DP, Sun W, Cleary PA, Nathan DM; Diabetes Control and Complications Trial (DCCT)/Epidemiology of Diabetes Interventions and Complications (EDIC) Research Group. Effect of intensive diabetes therapy on the progression of diabetic retinopathy in patients with type 1 diabetes: 18 years of follow-up in the DCCT/EDIC. Diabetes. 2015;64:631–642. doi:10.2337/db14-0930
26. Kohner EM. Microvascular disease: what does the UKPDS tell us about diabetic retinopathy? Diabetic Med. 2008;25:20–24. doi:10.1111/j.1464-5491.2008.02505
 © 2022 The Author(s). This work is published and licensed by Dove Medical Press Limited. The
full terms of this license are available at https://www.dovepress.com/terms
and incorporate the Creative Commons Attribution
- Non Commercial (unported, 3.0) License.
By accessing the work you hereby accept the Terms. Non-commercial uses of the work are permitted
without any further permission from Dove Medical Press Limited, provided the work is properly
attributed. For permission for commercial use of this work, please see paragraphs 4.2 and 5 of our Terms.
© 2022 The Author(s). This work is published and licensed by Dove Medical Press Limited. The
full terms of this license are available at https://www.dovepress.com/terms
and incorporate the Creative Commons Attribution
- Non Commercial (unported, 3.0) License.
By accessing the work you hereby accept the Terms. Non-commercial uses of the work are permitted
without any further permission from Dove Medical Press Limited, provided the work is properly
attributed. For permission for commercial use of this work, please see paragraphs 4.2 and 5 of our Terms.