Back to Journals » Neuropsychiatric Disease and Treatment » Volume 14
Validation of abnormal glucose metabolism associated with Parkinson’s disease in Chinese participants based on 18F-fluorodeoxyglucose positron emission tomography imaging
Authors Jin R ![]() , Ge J, Wu P
, Ge J, Wu P ![]() , Lu J
, Lu J ![]() , Zhang H, Wang J
, Zhang H, Wang J ![]() , Wu J, Han X, Zhang W, Zuo C
, Wu J, Han X, Zhang W, Zuo C ![]()
Received 12 March 2018
Accepted for publication 9 May 2018
Published 6 August 2018 Volume 2018:14 Pages 1981—1989
DOI https://doi.org/10.2147/NDT.S167548
Checked for plagiarism Yes
Review by Single anonymous peer review
Peer reviewer comments 2
Editor who approved publication: Professor Wai Kwong Tang
Rongbing Jin,1,* Jingjie Ge,2,* Ping Wu,2 Jiaying Lu,2 Huiwei Zhang,2 Jian Wang,3 Jianjun Wu,3 Xianhua Han,2 Weishan Zhang,2 Chuantao Zuo2,4
1Department of Nuclear Medicine, Daping Hospital, Army Medical University, Chongqing 400042, China; 2PET Center, Huashan Hospital, Fudan University, Shanghai 200235, China; 3Department of Neurology, Huashan Hospital, Fudan University, Shanghai 200040, China; 4Institute of Functional and Molecular Medical Imaging, Fudan University, Shanghai 200433, China
*These authors contributed equally to this work
Purpose: We previously identified disease-related cerebral metabolic characteristics associated with Parkinson’s disease (PD) in the Chinese population using 18F-fluorodeoxyglucose (FDG) positron emission tomography (PET)/computed tomography (CT) imaging. The present study aims to assess data reproducibility and robustness of the metabolic activity characteristics across independent cohorts.
Patients and methods: Forty-eight patients with PD and 48 healthy controls from Chongqing district, in addition to 33 patients with PD and 33 healthy controls from Shanghai district were recruited. Each subject underwent brain 18F-FDG PET/CT imaging in a resting state. Based on the brain images, differences between the groups and PD-related cerebral metabolic activities were graphically and quantitatively evaluated.
Results: Both PD patient cohorts exhibited analogous cerebral patterns characterized by metabolic increase in the putamen, globus pallidus, thalamus, pons, sensorimotor cortex and cerebellum, along with metabolic decrease in parieto-occipital areas. Additionally, the metabolic pattern was highly indicative of the disease, with a significant elevation in PD patients compared with healthy controls (p<0.001) in both the derivation (Shanghai) and validation (Chongqing) cohorts.
Conclusion: This dual-center study demonstrated the high comparability and reproducibility of PD-related cerebral metabolic activity patterns across independent Chinese cohorts and may serve as an objective diagnostic marker for the disease.
Keywords: movement disorders, parkinsonism, disease diagnosis, positron emission tomography, neuroimaging marker, Parkinson’s disease
Introduction
Idiopathic Parkinson’s disease (PD) is the second most common neurodegenerative disorder after Alzheimer’s disease, with a prevalence of 1%–2% in individuals over 65 years of age.1 It has been estimated that ~2 million Chinese presently suffer from the disease, accounting for 50% of all PD cases worldwide.2 Due to the aging Chinese population, this number is likely to grow continuously in the coming decades.
Currently, the clinical diagnosis of PD is established according to the UK Brain Bank criteria, which outline the triad of resting tremor, rigidity and hypokinesia as indicative of the classic underlying nigrostriatal degeneration.3 However, such clinical signs substantially overlap with various subtypes of atypical parkinsonism such as multiple system atrophy, progressive supranuclear palsy, corticobasal degeneration and dementia with Lewy bodies.4 Approximately 20%–30% of patients with PD were reported to have been misdiagnosed earlier in life.5 Although currently there is no effective method to halt the degeneration of central neurons in PD, oral dopamine therapy, in conjunction with a neurosurgical procedure such as deep brain stimulation, has proven to be highly effective in controlling motor symptoms.6,7 Therefore, the correct diagnosis of PD is of great importance for the determination of treatment strategies and greatly improves the patient’s quality of life.
18F-fluorodeoxyglucose (FDG) positron emission tomography (PET) is effective in visualizing cerebral glucose metabolism and its variations that are associated with neuronal dysfunction. This modality has been reported effective in detecting cerebral functional changes in patients with PD.8,9 Furthermore, a combination of voxel-based techniques has detailed the distribution of cerebral metabolic alterations associated with idiopathic PD. To date, this pattern has been reproduced in several independent patient populations by applying different analytical techniques at both regional and network levels.10–12 Metabolic abnormalities in individual patients were quantitatively assessed based on calculated PD-related pattern subject scores and an objective marker for disease diagnosis.13,14
Pertinent studies of the Chinese population have been reported over the past several years.15,16 The PD-related metabolic pattern, apparent in such patients, was first identified in 2013 and was characterized by metabolic increases in the pallidothalamus, pons and cerebellum, along with concurrent decreases in the posterior parietal areas. Pattern scores of individual subjects effectively discriminated PD patients from healthy controls and correlated with the severity of motor symptoms.15,16 As the patients enrolled in these studies were primarily recruited from the same university hospital in Shanghai, China, the reproducibility and robustness of reported diagnostic techniques requires validation prior to widespread implementation in clinical centers.
To explore the feasibility of utilizing the Shanghai-derived PD-associated metabolic pattern as a reference standard for disease diagnosis nationally, here, we sought to (i) characterize cerebral metabolic abnormalities in a prospectively recruited cohort of PD patients and healthy controls from Chongqing district; (ii) evaluate similarities and differences in metabolic topographical features between the Shanghai and Chongqing cohorts; and (iii) validate the ability of the Shanghai-derived PD-related metabolic pattern to prospectively discriminate between PD patients and healthy controls from Chongqing district by calculating the expression in individual subjects.
Materials and methods
Patients
The present study included two discrete cohorts, both consisting of PD patients and healthy subjects. The first cohort consisted of 48 PD patients and 48 healthy subjects who were prospectively recruited at Daping Hospital, Chongqing. Prior to enrollment, all patients had been managed by two senior movement disorder specialists for at least one year and all met the UK Brain Bank criteria for PD.17 No patients were noted to possess preexisting structural brain abnormalities (eg, mass lesions or ischemia) by magnetic resonance imaging (MRI) that could explain clinical findings. All enrolled healthy controls had no history of neurological or psychiatric disorders. Each healthy control underwent a clinical neurological examination by a senior movement disorder specialist prior to enrollment in this study. In addition, no healthy control had any prior exposure to neuroleptic agents or drug use.
This study also included a second independent cohort from Huashan Hospital, Shanghai, which comprising 33 PD patients and 33 healthy subjects. This same cohort was originally used for identification of the aforementioned PD-related cerebral metabolic pattern. We chose to employ this cohort to evaluate the reproducibility of such disease-related cerebral abnormalities across independent Chinese samples and to assess the feasibility of applying this metabolic pattern in the prospective discrimination of PD patients from healthy controls.
Demographic data for patient and healthy control groups are presented in Table 1. These individuals underwent 18F-FDG PET imaging at Chongqing and Shanghai sites, respectively. Permission was obtained from institutional review boards at each hospital and the procedure was carried out in compliance with the Code of Ethics of the World Medical Association (Declaration of Helsinki) and uniform requirements for manuscripts submitted to biomedical journals. Written consent from each subject was obtained at each institution, following a detailed explanation of scanning procedures and the study itself.
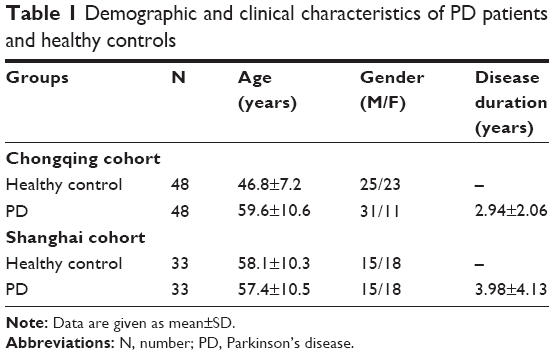 | Table 1 Demographic and clinical characteristics of PD patients and healthy controls |
PET imaging
All subjects were asked to fast for at least 6 hours but had free access to water prior to PET imaging. All subjects underwent 18F-FDG PET at least 12 hours after cessation of oral antiparkinsonian medications (ie, a practically defined “off” condition). Subjects from Daping Hospital (Chongqing) and Huashan Hospital (Shanghai) were scanned using a Siemens Biograph 64 PET/CT machine (Siemens, Munich, Germany) in three-dimensional (3D) mode at each respective site. CT transmission scans were performed for photon attenuation correction, while PET scans were subsequently acquired at 45–55 minutes postinjection and reconstructed using the ordered subset expectation maximization method. All imaging was performed in a quiet and dimly lit room while subjects were in a resting state.
Image processing
PET images were preprocessed using the Statistical Parametric Mapping software (SPM5; Wellcome Department of Imaging Neuroscience, Institute of Neurology, London, UK) implemented in Matlab 7.4.0 (MathWorks Inc., Natick, MA, USA). Scans were spatially normalized into the Montreal Neurological Institute (MNI) brain space with linear and nonlinear 3D transformations, and subsequently smoothed by a 10 mm-wide Gaussian filter over a 3D space to increase the signal-to-noise ratio for statistical analysis.
Data analysis
PET imaging data were analyzed using SPM5 software as described above to localize abnormalities in regional metabolism between PD patients and healthy subjects.18 For each cohort, we first used a two-sample t-test according to the general linear model to characterize metabolic differences between PD patients and healthy controls, respectively. Mean signal differences across the whole brain were removed in each individual subject by analysis of covariance. Contrasts for decreased and increased metabolism were set as [1, −1] and [−1, 1], respectively.
Using SPM5, we also employed a flexible factorial design to characterize overlapping and differential brain regions with metabolic abnormalities in the Chongqing and Shanghai cohorts.19 Site and group were added as the two main effects in this design, while global values were entered as a covariate to eliminate potential confounding. Contrasts for commonality and difference were detected separately using conjunction [1, −1, 1, −1]/[−1, 1, −1, 1] and interaction [1, −1, −1, 1]/[−1, 1, 1, −1] analyses.
To evaluate significant differences, the voxel threshold was set at p<0.05 (family-wise error corrected) across the whole brain with an extent threshold empirically chosen to be greater than two to three times that of the expected voxels per cluster estimated in each SPM run. Significant regions were localized by the Talairach Daemon software (Research Imaging Center, University of Texas Health Science Center, San Antonio, TX, USA) after applying an MNI-to-Talairach conversion. SPM maps of the t-statistic were overlaid on a standard T1-weighted MRI brain template in stereotaxic space. To quantify metabolic changes in specific regions, we constructed a spherical volume of interest, 4 mm in radius within the image space, centered at the peak voxel of clusters significant in each SPM analysis. We subsequently calculated relative cerebral glucose metabolic values (ie, globally normalized) in PD patients and normal controls using ScanVP software.20
Moreover, we prospectively quantitated individual expression in the Chongqing cohort based on the PD-related metabolic pattern originally identified in the Shanghai cohort using a voxel-based topographic profile rating (TPR) algorithm.15,16 This original pattern was generated with 18F-FDG PET data obtained from Shanghai PD patients and healthy subjects by applying a voxel-based spatial covariance mapping algorithm, known as scaled subprofile modeling, based on principal component analysis (PCA)16 In brief, this method executed PCA on a covariance matrix of group-wise image data within a mask of gray matter to identify a disease-related spatial covariance pattern with greater expression in patients than that in control subjects. The pattern was defined by a linear combination of select principal components whose expression could best discriminate PD patients from controls, as determined by the lowest Akaike Information Criterion value in a logistical regression model. For each subject, individual pattern scores could be computed prospectively in any other scans using a TPR algorithm, which entailed the multiplication of each individual image by that of the pattern (ie, the dot product between the two images) and summing the result over the brain mask. In the present study, the resulting pattern expression of each subject was subsequently Z-transformed using individual scores of control subjects from the Shanghai cohort, and was offset by individual scores of control subjects from the Chongqing cohort. Scores of subjects from the Chongqing cohort were then compared with those of PD patients and healthy controls from the Shanghai cohort, and examined for prospective discrimination among groups.
Statistical analysis
Group differences in metabolic quantitation were assessed using two-sample t-tests in each cohort and one-way analysis of variance across the two cohorts. Receiver operating characteristic (ROC) curves were also plotted to evaluate the diagnostic power of the individual expression of the Shanghai-derived PD-related metabolic pattern for discrimination of PD patients from Chongqing cohort control subjects. The area under the curve (AUC) was calculated and the optimum cut-off value was estimated by identifying an inflection point on each ROC curve that gave rise to both high sensitivity and specificity. All analyses were performed using SPSS software (SPSS Inc., Chicago, IL, USA) and p<0.05 was considered statistically significant.
Results
Cerebral metabolic characteristics in PD patients relative to normal subjects in each cohort
The distinguishing features of glucose metabolism in PD patients from the Chongqing cohort were characterized by metabolic increases in the putamen, globus pallidus (GP), thalamus, pons, sensorimotor cortex (SMC) and cerebellum, along with metabolic decreases in parieto-occipital areas (Figure 1A). These findings exhibited a distribution similar to the original pattern apparent in the Shanghai cohort (Figure 1B). However, the extent of the increased metabolism in the pons and cerebellum appeared relatively larger in the Chongqing cohort on visual inspection.
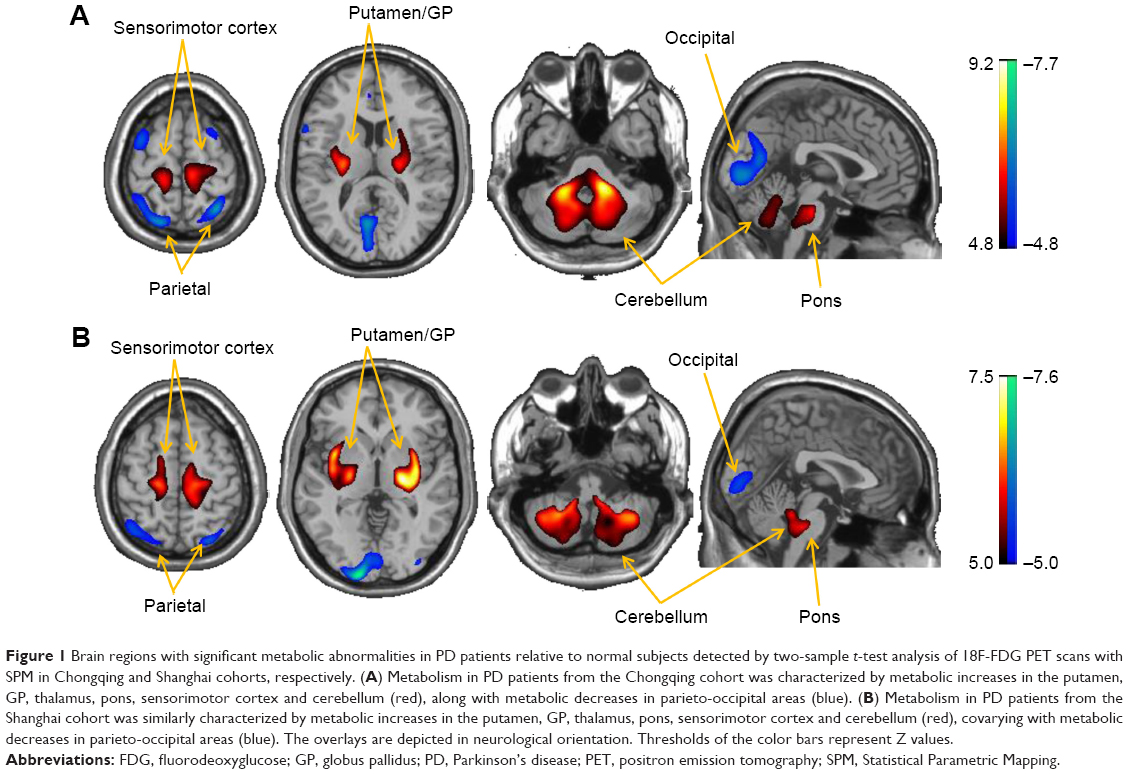 | Figure 1 Brain regions with significant metabolic abnormalities in PD patients relative to normal subjects detected by two-sample t-test analysis of 18F-FDG PET scans with SPM in Chongqing and Shanghai cohorts, respectively. (A) Metabolism in PD patients from the Chongqing cohort was characterized by metabolic increases in the putamen, GP, thalamus, pons, sensorimotor cortex and cerebellum (red), along with metabolic decreases in parieto-occipital areas (blue). (B) Metabolism in PD patients from the Shanghai cohort was similarly characterized by metabolic increases in the putamen, GP, thalamus, pons, sensorimotor cortex and cerebellum (red), covarying with metabolic decreases in parieto-occipital areas (blue). The overlays are depicted in neurological orientation. Thresholds of the color bars represent Z values. |
Comparison of metabolic characteristics across the two cohorts
SPM conjunction analysis directly localized overlapping brain regions between the two independent cohorts from Chongqing and Shanghai. In comparison to healthy controls, PD patients from both cohorts exhibited commonality with respect to increased metabolism in the putamen, GP, thalamus, pons, SMC and cerebellum, but decreased metabolism in parieto-occipital areas (Figure 2A and Table 2). These were the same regions as those shown in the separate cohorts summarized above, which further confirmed the reproducibility of PD-related pattern characteristics using a different but complementary measure. In addition, the relative metabolism calculated post hoc in several primary regions confirmed increased metabolism in the lateral GP, SMC and cerebellum but decreased metabolism in the parietal gyrus of PD patients relative to healthy controls across both cohorts (p<0.001; Figure 2B). No regions were noted to exhibit significant differences between control groups (p>0.05) or patient groups (p>0.05) across the two cohorts.
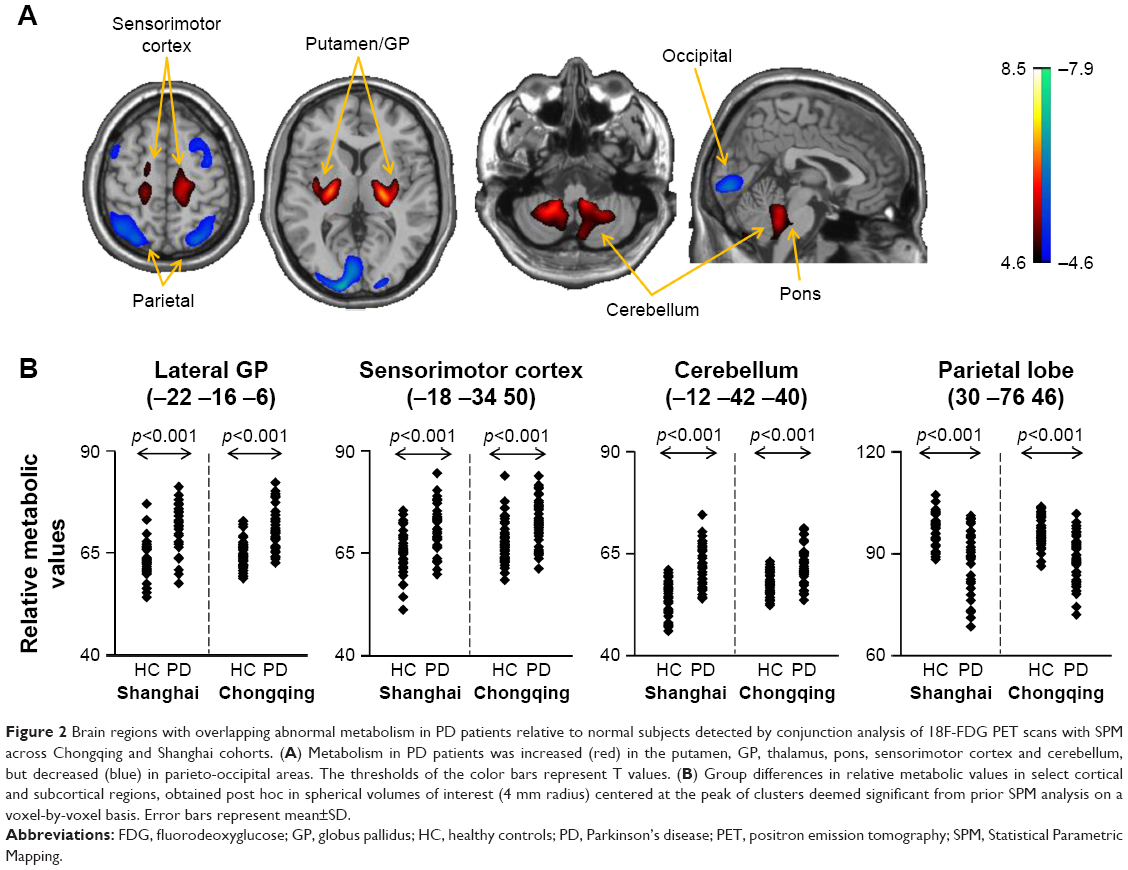 | Figure 2 Brain regions with overlapping abnormal metabolism in PD patients relative to normal subjects detected by conjunction analysis of 18F-FDG PET scans with SPM across Chongqing and Shanghai cohorts. (A) Metabolism in PD patients was increased (red) in the putamen, GP, thalamus, pons, sensorimotor cortex and cerebellum, but decreased (blue) in parieto-occipital areas. The thresholds of the color bars represent T values. (B) Group differences in relative metabolic values in select cortical and subcortical regions, obtained post hoc in spherical volumes of interest (4 mm radius) centered at the peak of clusters deemed significant from prior SPM analysis on a voxel-by-voxel basis. Error bars represent mean±SD. |
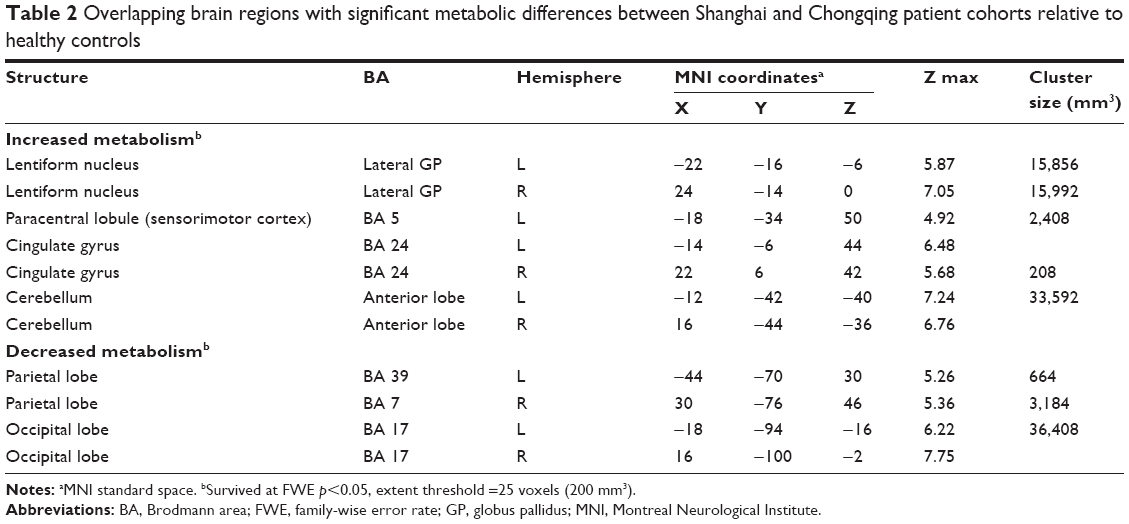 | Table 2 Overlapping brain regions with significant metabolic differences between Shanghai and Chongqing patient cohorts relative to healthy controls |
Importantly, SPM interaction analysis revealed PD patients from the Shanghai cohort to exhibit more pronounced metabolic increases in the right temporal-striatal area, but greater metabolic decreases in the bilateral occipital region as compared to those from the Chongqing cohort (Figure 3 and Table 3). Nonetheless, as presented in Table 3, the cluster size of these regions was relatively small, and the location was secondary with respect to the underlying pathophysiology of PD.
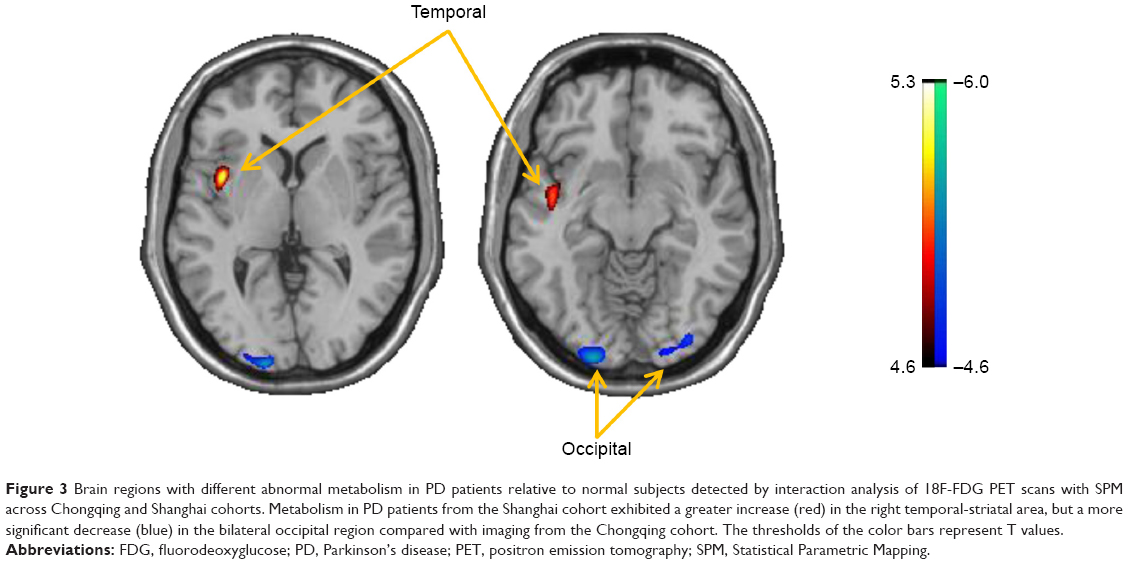 | Figure 3 Brain regions with different abnormal metabolism in PD patients relative to normal subjects detected by interaction analysis of 18F-FDG PET scans with SPM across Chongqing and Shanghai cohorts. Metabolism in PD patients from the Shanghai cohort exhibited a greater increase (red) in the right temporal-striatal area, but a more significant decrease (blue) in the bilateral occipital region compared with imaging from the Chongqing cohort. The thresholds of the color bars represent T values. |
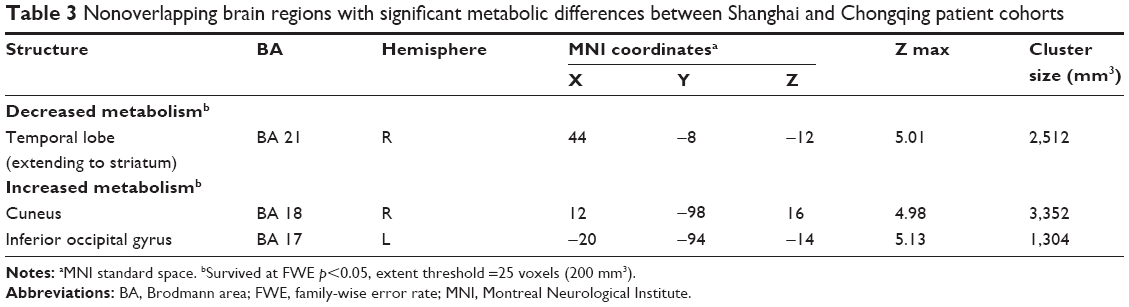 | Table 3 Nonoverlapping brain regions with significant metabolic differences between Shanghai and Chongqing patient cohorts |
Diagnostic power evaluation of pattern expression
Prospectively computed individual scores of the Shanghai-derived metabolic pattern were abnormally elevated (p<0.001) in PD patients from the Chongqing cohort as compared with normal subjects from the same cohort (Figure 4A). Although individual pattern expression was slightly lower in PD patients from the Chongqing cohort relative to those from the Shanghai cohort (Figure 4A), the ROC curve demonstrated that prospectively quantitated expression of the Shanghai-derived pattern could significantly discriminate (p<0.001) PD patients from control subjects (Figure 4B). The AUC values were 0.919 (with 95% Cls of 0.868–0.971) for Chongqing cohort subjects. An optimum cut-off value of 0.6467 (Figure 4B) resulted in a sensitivity of 81.3% and a specificity of 85.4% for the prospective diagnosis of PD in this cohort. Moreover, comparison of individual scores between the two normal groups revealed no significant difference (p>0.05).
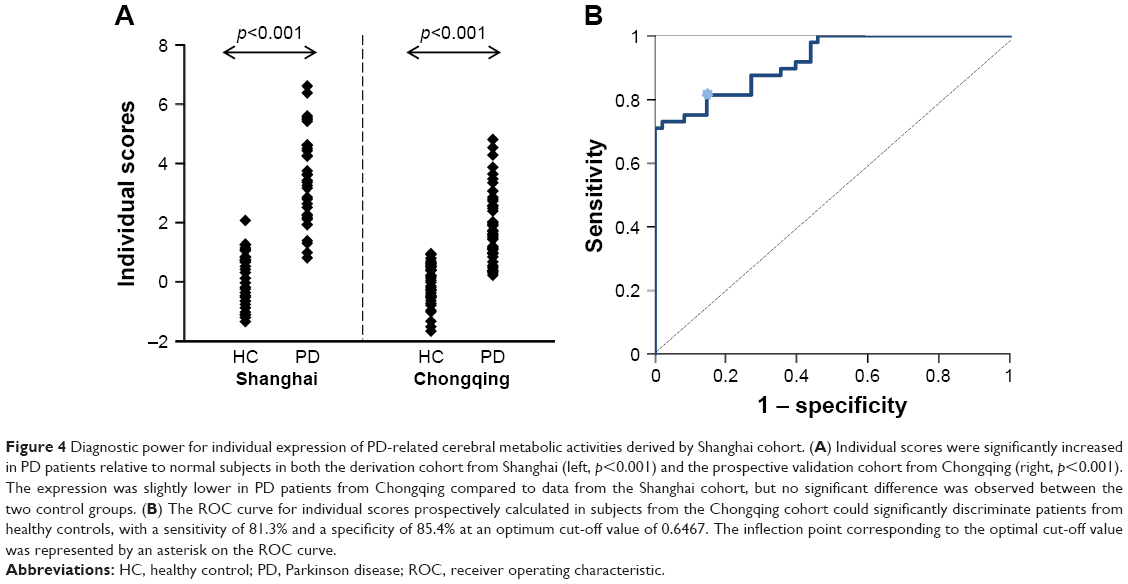 | Figure 4 Diagnostic power for individual expression of PD-related cerebral metabolic activities derived by Shanghai cohort. (A) Individual scores were significantly increased in PD patients relative to normal subjects in both the derivation cohort from Shanghai (left, p<0.001) and the prospective validation cohort from Chongqing (right, p<0.001). The expression was slightly lower in PD patients from Chongqing compared to data from the Shanghai cohort, but no significant difference was observed between the two control groups. (B) The ROC curve for individual scores prospectively calculated in subjects from the Chongqing cohort could significantly discriminate patients from healthy controls, with a sensitivity of 81.3% and a specificity of 85.4% at an optimum cut-off value of 0.6467. The inflection point corresponding to the optimal cut-off value was represented by an asterisk on the ROC curve. |
Discussion
The present study compared brain metabolic activities between two independent cohorts of patients with PD from different districts in China using 18F-FDG PET imaging. We found that the disease-related metabolic characteristics demonstrated good reproducibility across the cohorts with respect to both topography and quantitation, suggesting a potentially high applicability of this pattern as an objective imaging marker to improve the clinical diagnosis of PD in individual patients.
We observed that the distribution of metabolic abnormalities identified using imaging data prospectively obtained from the Chongqing cohort was characterized by increased metabolism in the putamen, GP, thalamus, pons, SMC and cerebellum, covarying with decreased metabolism in the parieto-occipital lobes. These features were not only consistent with the Shanghai-derived pattern as reported in the present study, but also shared a number of similarities with those previously generated in independent populations from America, the Netherlands, India and Slovenia.10,21–23 Analogous metabolic alterations of brain regions have been further confirmed in macaques with 1-methyl-4-phenyl-1,2,3,6-tetrahydropyridine-induced parkinsonism.24 In addition, an abnormal cerebral blood flow pattern, homologous to cerebral metabolic activities, was also detected in PD patients scanned using perfusion single-photon emission computed tomography.25
While the neuro-pathological mechanism underlying this PD-related pattern remains unclear, it is likely to be associated with dysfunction of extrapyramidal pathways. The key nodes of pattern abnormalities noted in the present study were highly accordant with circuits of the cortico-striatopallido-thalamo-cortical (CSPTC) and cerebello-thalamo-cortical (CbTC) loops, the two most important extrapyramidal pathways for motor control in humans.26,27 Indeed, the abnormal hypermetabolism apparent in the SMC, putamen, GP and thalamus was consistent with the CSPTC pathway. In parallel, the hypermetabolic pattern noted in the cerebellum, thalamus and SMC regions was consistent with the CbTC circuit. Compensatory hyperactivities in these brain regions develop as a consequence of nigrostriatal dopaminergic attrition and ensuing functional abnormalities in the CSPTC loop and related neural pathways. Moreover, since the CSPTC circuit dysfunction is considered to be associated with akinetic-rigid manifestations while the CbTC circuit dysfunction accounts for tremor generation in PD patients,27,28 it is reasonable that a significant correlation can be observed between the Unified Parkinson’s Disease Rating Scale motor scaling and individual expression of such a metabolic pattern.16
In spite of the high degree of similarity in pattern distribution between two independent PD cohorts from China, some inherent topographical discrepancies were noted. In particular, metabolic activities in PD patients from the Shanghai cohort revealed more pronounced increases in the right temporal-striatal area but greater decreases in the bilateral occipital region as compared to those from the Chongqing cohort. Inevitable differences across objective scanner designs and imaging protocols may be possible reasons for reading discrepancies. Moreover, differences in subject characteristics, particularly unmatched age and gender, between healthy and patient groups from the Chongqing cohort in the present study likely affected the results. Age-associated changes in relative metabolic activity have been reported in anterior brain areas, especially the anterior cingulate cortex, while overall cerebral glucose metabolism in females was observed to be higher than that in male subjects.29 Nonetheless, the fact that PD-related metabolic characteristics are highly comparable and reproducible in major cerebral regions of PD patients on a whole-brain basis indicated that age and gender do not play significant roles in the formation of such a pattern and suggested that the pattern is a reliable imaging marker in the clinical diagnosis of the disease.
Quantitation of the PD-related pattern in individual patients revealed that the Chongqing cohort possessed relatively lower scores as compared to subjects from the Shanghai cohort. We attribute this result to the differences in disease duration between the two patient cohorts. Considering that the expression of the PD-related pattern positively correlated with the disease duration or severity of motor symptoms in individual patients,16 it is plausible that the lower expression in Chongqing cohort PD patients could be due to the relatively shorter period of time elapsed after disease onset. This is in accordance with the demographic and clinical data of each cohort, as summarized in Table 1.
The current study demonstrated that the Shanghai-derived metabolic pattern possesses a good diagnostic accuracy in the prospective discrimination between PD patients and healthy controls from Chongqing district. Indeed, our ROC analysis illustrated a specificity of 85.4% and a sensitivity of 81.3% with an optimal pattern expression cutoff at 0.6467. This level of discriminatory power is in line with previously reported values in American, Dutch and Slovenian cohorts.10,22,23 Of note, the present work was intended as a national comparison study to validate the reproducibility of a PD-related pattern biomarker and to evaluate its potential use for disease diagnosis in China. Therefore, to exclude inevitable variations across ethnic groups, this study used a Shanghai-derived pattern as a reference standard, rather than imaging data obtained from Western populations.
To further assess the applicability of the PD-related pattern in the early diagnosis of PD, a prospective follow-up study is currently underway in patients with a prodromal stage of parkinsonism, such as those diagnosed with a rapid eye movement sleep behavior disorder, as well as in patients with early PD who are only suffering hemi-extremity manifestations at baseline. Moreover, a prospective study with a large sample size of patients with atypical parkinsonism is also ongoing. The aim of this work is to evaluate the potential use of pattern topography and expression in the discrimination of idiopathic PD from multiple system atrophy, progressive supranuclear palsy, corticobasal degeneration and dementia with Lewy bodies, as well as in the differential diagnosis of these diseases in the Chinese population.
Conclusion
The present study evaluated the reproducibility and robustness of abnormal glucose metabolic activities in Chinese PD patients using 18F-FDG PET imaging data obtained from both healthy subjects and PD patients at multiple-medical centers. We demonstrated the similarity of such a PD-related metabolic pattern across two independent cohorts with respect to both topography and quantitation. Moreover, individual scores of subjects yielded a remarkable clinical applicability for the discrimination of PD patients from healthy controls. The reproducibility of this PD-related pattern biomarker in different cohorts, along with extensive existing literature, validates the utility of such a pattern as a reliable marker of PD diagnosis utilizing PET imaging, as well as advantages in its clinical implementation worldwide.
Acknowledgments
This study was supported by grants (No 81671239, No 81361120393, No 81401135) from the National Science Foundation of China, Shanghai Key Laboratory of Psychotic Disorders (No 13dz2260500) and Shanghai Sailing program (No 18YF1403100). The funders had no role in study design, data collection and analysis, decision to publish or preparation of the manuscript.
Disclosure
The authors report no conflicts of interest in this work.
References
Pringsheim T, Jette N, Frolkis A, Steeves TD. The prevalence of Parkinson’s disease: a systematic review and meta-analysis. Mov Disord. 2014;29(13):1583–1590. | ||
Zhang ZX, Roman GC, Hong Z, et al. Parkinson’s disease in China: prevalence in Beijing, Xian, and Shanghai. Lancet. 2005;365(9459):595–597. | ||
Rajput AH, Rajput ML, Ferguson LW, Rajput A. Baseline motor findings and Parkinson disease prognostic subtypes. Neurology. 2017;89(2):138–143. | ||
Joutsa J, Gardberg M, Roytta M, Kaasinen V. Diagnostic accuracy of parkinsonism syndromes by general neurologists. Parkinsonism Relat Disord. 2014;20(8):840–844. | ||
Hughes AJ, Daniel SE, Ben-Shlomo Y, Lees AJ. The accuracy of diagnosis of parkinsonian syndromes in a specialist movement disorder service. Brain. 2002;125(Pt 4):861–870. | ||
Mansouri A, Taslimi S, Badhiwala JH, et al. Deep brain stimulation for Parkinson’s disease: meta-analysis of results of randomized trials at varying lengths of follow-up. J Neurosurg. 2017;30:1–15. | ||
Rascol O, Perez-Lloret S, Ferreira JJ. New treatments for levodopa-induced motor complications. Mov Disord. 2015;30(11):1451–1460. | ||
Niethammer M, Eidelberg D. Metabolic brain networks in translational neurology: concepts and applications. Ann Neurol. 2012;72(5):635–647. | ||
Poston KL, Eidelberg D. Functional brain networks and abnormal connectivity in the movement disorders. Neuroimage. 2012;62(4):2261–2270. | ||
Tomse P, Jensterle L, Grmek M, et al. Abnormal metabolic brain network associated with Parkinson’s disease: replication on a new European sample. Neuroradiology. 2017;59(5):507–515. | ||
Teune LK, Bartels AL, de Jong BM, et al. Typical cerebral metabolic patterns in neurodegenerative brain diseases. Mov Disord. 2010;25(14):2395–2404. | ||
Eckert T, Barnes A, Dhawan V, et al. FDG PET in the differential diagnosis of parkinsonian disorders. Neuroimage. 2005;26(3):912–921. | ||
Ko JH, Lee CS, Eidelberg D. Metabolic network expression in parkinsonism: clinical and dopaminergic correlations. J Cereb Blood Flow Metab. 2017;37(2):683–693. | ||
Tomše P, Jensterle L, Rep S, et al. The effect of 18F-FDG-PET image reconstruction algorithms on the expression of characteristic metabolic brain network in Parkinson’s disease. Phys Med. 2017;41:129–135. | ||
Wu P, Yu H, Peng S, et al. Consistent abnormalities in metabolic network activity in idiopathic rapid eye movement sleep behaviour disorder. Brain. 2014;137(Pt 12):3122–3128. | ||
Wu P, Wang J, Peng S, et al. Metabolic brain network in the Chinese patients with Parkinson’s disease based on 18F-FDG PET imaging. Parkinsonism Relat Disord. 2013;19(6):622–627. | ||
Gibb WR, Lees AJ. The relevance of the Lewy body to the pathogenesis of idiopathic Parkinson’s disease. J Neurol Neurosurg Psychiatry. 1988;51(6):745–752. | ||
Zuo C, Ma Y, Sun B, et al. Metabolic imaging of bilateral anterior capsulotomy in refractory obsessive compulsive disorder: an FDG PET study. J Cereb Blood Flow Metab. 2013;33(6):880–887. | ||
Asanuma K, Tang C, Ma Y, et al. Network modulation in the treatment of Parkinson’s disease. Brain. 2006;129(Pt 10):2667–2678. | ||
Ge J, Wu P, Peng S, et al. Assessing cerebral glucose metabolism in patients with idiopathic rapid eye movement sleep behavior disorder. J Cereb Blood Flow Metab. 2015;35(12):2062–2069. | ||
Tripathi M, Tang CC, Feigin A, et al. Automated differential diagnosis of early parkinsonism using metabolic brain networks: a validation study. J Nucl Med. 2016;57(1):60–66. | ||
Peng S, Ma Y, Spetsieris PG, et al. Characterization of disease-related covariance topographies with SSMPCA toolbox: effects of spatial normalization and PET scanners. Hum Brain Mapp. 2014;35(5):1801–1814. | ||
Teune LK, Renken RJ, Mudali D, et al. Validation of parkinsonian disease-related metabolic brain patterns. Mov Disord. 2013;28(4):547–551. | ||
Ma Y, Johnston TH, Peng S, et al. Reproducibility of a Parkinsonism-related metabolic brain network in non-human primates: a descriptive pilot study with FDG PET. Mov Disord. 2015;30(9):1283–1288. | ||
Eckert T, Van Laere K, Tang C, et al. Quantification of Parkinson’s disease-related network expression with ECD SPECT. Eur J Nucl Med Mol Imaging. 2007;34(4):496–501. | ||
DeLong MR, Wichmann T. Basal ganglia circuits as targets for neuromodulation in Parkinson disease. JAMA Neurol. 2015;72(11):1354–1360. | ||
DeLong MR, Wichmann T. Circuits and circuit disorders of the basal ganglia. Arch Neurol. 2007;64(1):20–24. | ||
Timmermann L, Gross J, Dirks M, et al. The cerebral oscillatory network of parkinsonian resting tremor. Brain. 2003;126(Pt 1):199–212. | ||
Yoshizawa H, Gazes Y, Stern Y, Miyata Y, Uchiyama S. Characterizing the normative profile of 18F-FDG PET brain imaging: sex difference, aging effect, and cognitive reserve. Psychiatry Res. 2014;221(1):78–85. |
 © 2018 The Author(s). This work is published and licensed by Dove Medical Press Limited. The
full terms of this license are available at https://www.dovepress.com/terms
and incorporate the Creative Commons Attribution
- Non Commercial (unported, 3.0) License.
By accessing the work you hereby accept the Terms. Non-commercial uses of the work are permitted
without any further permission from Dove Medical Press Limited, provided the work is properly
attributed. For permission for commercial use of this work, please see paragraphs 4.2 and 5 of our Terms.
© 2018 The Author(s). This work is published and licensed by Dove Medical Press Limited. The
full terms of this license are available at https://www.dovepress.com/terms
and incorporate the Creative Commons Attribution
- Non Commercial (unported, 3.0) License.
By accessing the work you hereby accept the Terms. Non-commercial uses of the work are permitted
without any further permission from Dove Medical Press Limited, provided the work is properly
attributed. For permission for commercial use of this work, please see paragraphs 4.2 and 5 of our Terms.