Back to Journals » Patient Preference and Adherence » Volume 13
Using the Medication Adherence Reasons Scale (MAR-Scale) to identify the reasons for non-adherence across multiple disease conditions
Authors Unni EJ ![]() , Sternbach N
, Sternbach N ![]() , Goren A
, Goren A ![]()
Received 14 February 2019
Accepted for publication 2 May 2019
Published 28 June 2019 Volume 2019:13 Pages 993—1004
DOI https://doi.org/10.2147/PPA.S205359
Checked for plagiarism Yes
Review by Single anonymous peer review
Peer reviewer comments 3
Editor who approved publication: Dr Johnny Chen
Elizabeth J Unni,1 Nikoletta Sternbach,2 Amir Goren2
1College of Pharmacy, Roseman University of Health Sciences, South Jordan, UT, USA; 2Kantar Health, New York, NY, USA
Purpose: With more than 50% of the individuals on chronic conditions not taking medicines as prescribed, it is essential for health care providers to understand the reasons, so that adherence-related conversations can be initiated and focused appropriately. Measuring medication non-adherence is complex, because patients are often on multiple medications and take them via various modes of administration such as orally, by injection, or topically, and at various frequencies such as daily or weekly. The Medication Adherence Reasons Scale (MAR-Scale) is a twenty-item, self-reported, comprehensive scale developed to measure two aspects of medication non-adherence: the extent or frequency of non-adherence and reasons for non-adherence. The objective of this study was to identify the top reasons, in 17 distinct chronic disease conditions, reported by patients for being non-adherent across various modes and frequencies of the corresponding medications. Internal reliability of the MAR-Scale was also assessed in each condition.
Patients and methods: Results were derived from Kantar Health’s US 2017 National Health and Wellness Survey (NHWS), a self-administered, annual, Internet-based cross-sectional survey of 75,000 adults (≥18 years). The survey sample was drawn from an Internet panel and was stratified according to age, gender, and ethnicity in order to represent the US adult population based on the US Census Bureau. Respondents to the 2017 NHWS who self-reported taking prescription medication(s) to treat one of the 17 conditions were invited to complete the MAR-Scale in a follow-up online survey, reporting on reasons for non-adherence in the past 7 days (daily medications) or four weeks (weekly), with non-adherence defined as any reported non-adherence in the corresponding timeframe for medicines taken orally, by injection, and topically.
Results: MAR-Scale data were obtained from 15,672 respondents in one or more conditions, modes, and frequencies. MAR-Scale reliability ranged from Cronbach’s alpha of 0.861 in multiple sclerosis to 0.973 in psoriasis. For daily orals, non-adherence ranged from 25.2% in diabetes to 63.7% in eczema. The most common reasons across conditions were “simply missed it,” “side effects,” and “concern about long-term effects.”
Conclusion: The MAR-Scale demonstrates acceptable reliability in multiple chronic disease conditions and across modes and frequencies of administration.
Keywords: self-report, barriers, non-adherence, measure, mode of administration, frequency
Introduction
Medication adherence, the “degree to which a person’s behavior corresponds with the agreed recommendations from a health care provider,” is a vital aspect of treatment, especially for chronic illness.1 However, individuals often do not take medicines as prescribed. According to the World Health Organization, in developed countries, among patients with chronic diseases, approximately 50% do not take medicines as prescribed, and the adherence rate is even lower in developing countries.1 The rate of non-adherence varies across diseases and populations and is reported as anywhere between 10% and 92%.2 The cost of medication non-adherence is estimated at $289 billion per year.3 Medication non-adherence, beyond its leading to failure to realize optimal clinical benefits and to increased health care costs, can result in discordance between health care providers and patients vis-à-vis expectations and outcomes. Thus, it is essential for health care providers to understand the reasons why patients are not taking medicines as prescribed, so that they can initiate informed conversations about non-adherence with their patients and provide tailored interventions focused on overcoming the specific reasons for non-adherence identified.
There are several direct and indirect methods to measure medication adherence.4 Approximately 25% of adherence studies use self-reported measures of non-adherence.5 These self-reported measures have limitations and do not always provide an accurate measure of when and how patients take their medications, but they do provide a “relative understanding of the patient on the adherence dimension,” according to Horne and Weinman, and they are comparatively inexpensive.6,7 The ability to understand the underlying dimensions of patient non-adherence and patient barriers and beliefs about medication, in particular, is a major strength of self-reported measures, especially when intervention strategies are to be developed.8
The Medication Adherence Reasons Scale (MAR-Scale) is a 20-item comprehensive scale that was developed to measure medication adherence.9,10 The scale has 1 item that assesses the overall extent or frequency of non-adherence and 19 items frequently cited by patients as common reasons for medication non-adherence. The scale was developed with the intention to develop tailored interventions based on the items in the scale. For example, the interventions needed for a patient who is non-adherent due to “concerns about the possible side effects from the medicine” are entirely different in focus and content than those needed for patients who are non-adherent because they “have problems forgetting things in daily life.” While the first patient needs intervention based on lessening her concern beliefs in medications, such as educating her about the medicine, the other patients need cue-based reminders such as pillboxes. Thus, understanding the reasons underlying non-adherence will help in aligning adherence measurement with adherence interventions. Additionally, the reasons for medication non-adherence vary across different disease conditions.9 Thus, knowing the top cited reasons for non-adherence in various disease conditions will enable clinicians, especially primary care clinicians, to communicate more effectively with the patients. Moreover, knowing the often-reported reasons for non-adherence in various disease conditions can be used by population health management systems such as health insurance companies or pharmacy benefit managers in designing population-based adherence interventions.
The MAR-Scale was validated in patients taking cholesterol-lowering and asthma-maintenance oral medications and demonstrated comparable reliability and validity.10 The reliability coefficient of the MAR-Scale is 0.950 for cholesterol-lowering medications and 0.935 for asthma maintenance medications. Additionally, an exploratory factor analysis revealed that the scale has four domains, reflecting non-adherence due to logistics, beliefs, forgetfulness, and long-term concerns. However, the reliability of the scale needs to be examined in other disease conditions, as well as with medications that are not taken orally or daily. The primary objective of this study was to determine the top-rated reasons for non-adherence across multiple disease conditions. The secondary objective was to determine the reliability of the MAR-Scale in these disease conditions across various modes and frequencies of administration. The 17 disease conditions selected were: arthritis (rheumatoid arthritis/psoriatic arthritis/osteoarthritis/ankylosing spondylitis), dermatitis/eczema/atopic dermatitis, inflammatory bowel disease (IBD: Crohn’s disease/ulcerative colitis), diabetes (type 1/type 2/latent autoimmune diabetes (LADA)), gastroesophageal reflux disease (GERD)/heartburn, osteoporosis/osteopenia, sleep conditions (sleep difficulties/insomnia/narcolepsy/sleep apnea), chronic constipation, depression, epilepsy, irritable bowel syndrome (IBS), lupus, migraine, multiple sclerosis, pain, psoriasis, and overactive bladder (wet/dry/stress urinary incontinence (SUI)).
Materials and methods
Study design and setting
The study used a cross-sectional survey design. The US 2017 National Health and Wellness Survey (NHWS), part of PaCeR (Patient-Centered Research) platform, was a self-administered, annual, Internet-based survey of 75,004 adults (≥18 years old), selected from an Internet panel maintained by Lightspeed Research and its partners. The sample was stratified according to age, gender, and ethnicity in order to represent the US adult population based on the US Census Bureau. The survey collects data on various characteristics such as health conditions, medical history, health care utilization, and demographic characteristics. All data is based on self-reporting by the respondents. Though the participants' answers were not validated, for example, self-reported medical history against their medical records, several quality control measures were used to ensure the accuracy of the self-reporting. For example, treatments are prompted only for the reported corresponding conditions, thus minimizing reporting of irrelevant treatments. Furthermore, since the survey is conducted online, it is initially fielded to approximately 15,000 complete respondents ("a soft launch") to ensure data accuracy before fielding to the remainder. The data from this soft launch was quality checked to ensure the script is working accurately. If issues are found, those are rectified and further tested before the survey is launched. Each survey respondent is given a unique ID and cookie settings are set to ensure that each respondent can only answer the survey once. Additionally, several studies published using NHWS data have demonstrated that the prevalence of disease conditions by NHWS is similar to the prevalence of these conditions in the US provided by other resources.11–18
Respondents from the 2017 NHWS who self-reported taking prescription medication(s) to treat one of the 17 conditions mentioned above were invited to complete the MAR-Scale in a follow-up online survey. The main NHWS survey asked patients to self-report their various disease conditions. If the patients self-reported any of the 17 disease conditions, they were asked whether they currently take prescription medication(s) for those conditions. If they answered affirmatively, they were asked to select their prescription medication(s) from a prompted list. In the follow-up, respondents were asked their mode of taking the medicines (orally, by injection, or topically) and frequency (daily or weekly). Depending on their responses, respondents were administered up to six separate versions of the MAR-Scale to report their reasons for non-adherence in the past 7 days (for daily medications) and in the past four weeks (for weekly medications) across oral, injection, and topical medications. For example, a patient taking three daily oral medicines only for depression had to answer only one version of MAR-Scale. However, a patient taking one daily oral for diabetes and one daily injection for diabetes had to answer two MAR-scale versions to determine their rate and reason for non-adherence with the two different modes. Similarly, if the medicines were taken topically or weekly, separate MAR-scales were administered. All versions of the MAR-scale had the same non-adherence frequency item and 19 reason-specific items. Two items were modified based on the disease condition. The item, “I had difficulty swallowing the medicine” for oral medicines was changed to, “I had difficulty applying the medicine” for topical medicines and, “I had difficulty injecting the medicine” for injectable medicines. Similarly, the item, “I had difficulty opening the container” was modified to, “I had difficulty getting the injection ready to use” for injectable medicines. All other items remained the same across versions. Measures were taken to ensure that the respondent was able to participate only once in the survey (see the description above regarding the quality of data collected by NHWS). All participants provided their informed consent. The respondents were given compensation for participating in the NHWS survey with points that can be accumulated and exchanged for a monetary gift or other prizes. The US NHWS in 2017 was reviewed and found exempt by Pearl IRB.
Outcome measures and analysis
The extent or frequency of medication non-adherence is measured by one non-adherence frequency item in the MAR-Scale that asks, “Thinking about your [SPECIFIC] medicine or medicines for [DISEASE CONDITION], over the last 7 days, how many days were you able to take your medicine(s) exactly as prescribed?” The response scale ranges from 0 days to 7 days, 0 days indicating complete non-adherence and 7 days indicating perfect medication adherence. This item is used to measure the extent or frequency of medication non-adherence as perceived by the respondents. The remaining 19 items on the scale are specific reasons for medication non-adherence. These items encompass domains of logistics (such as “lack of transportation or difficulty swallowing the medicines”), beliefs (such as “skip to see if still needed”), forgetfulness (such as “simply missed it”), and long-term concerns (such as “concern about potential side effects”). These items are measured on an 8-point scale ranging from 0 days to 7 days, and the anchor question is, “When you were not able to take your medicine or medicines for a specific condition as prescribed, how many days did it happen for each of the following reason?” Thus, for these items, 0 days represent perfect adherence, any days from 1 to 6 represent non-adherence, and 7 days represent complete non-adherence due to that reason. The same approach and considerations were used for weekly administration, ranging from 0 weeks to 4 weeks (ie, the question asks about non-adherence in the ‘last 4 weeks’). For the 19 items, the scores are summed, and the total score can range from 0 to 133 (or 0–76 for weekly administration). The non-adherence frequency item is not included in this total score. The higher the number, the more complex is the non-adherence behavior. Descriptive statistics (means, percentages and counts) were used to calculate adherence rates, mean scale scores, and top reasons for non-adherence. In conditions in which medicines with modes and frequencies of administration other than daily orals (eg, weekly injections) were reported, the non-adherence rates and the scale mean scores for those other modes/frequencies were analyzed only if the sample sizes were either greater than 30 or were reported for at least 10% as many patients as were taking the daily oral administration for that condition. For example, if there were only 100 patients taking oral medicines in a specific disease condition, there had to be at least 10 patients in other modes of administration to be included in the analysis. This minimum sample size decision was taken due to two concerns: 1) not wanting to draw conclusions due to low precisions with the small sample sizes, and 2) cases potentially being an indication of false reporting of nonexistent modes/frequencies of medicines. This is not intended to disregard the fact that there are legitimate modes of medicines which are rarely used and do not meet the minimum sample size criteria and is therefore a potential limitation for this study. The reliability of the scale was measured using Cronbach’s alpha and the Guttman split half coefficient for disease conditions where there were at least 100 responses.19 A reliability statistic higher than 0.7 was considered as acceptable reliability.
Results
MAR-Scale data were obtained from 15,672 respondents in one or more conditions, modes, and frequencies. Of the 32,236 panel members to whom the survey link was sent, 11,441 never clicked the link. Of the 20,795 who clicked the link, 4,492 either did not complete the screening questions or did not qualify for the survey based on the screening questions. Of the 16,303 who answered the survey, 661 responses were excluded due to incomplete responses. The survey requires responses to each item; hence, there are no missing responses to any item in the MAR-Scale. The study utilized 17 different disease conditions for daily orals, four for daily injections, four for daily topicals, thirteen for weekly orals, four for weekly topicals, and eight for weekly injectables. The number of respondents varied widely across conditions, modes, and frequencies. For example, while there were only 89 respondents who reported oral prescribed medicines for multiple sclerosis, there were 4,442 respondents with oral prescribed medicines for GERD/heartburn. 47.6% of the respondents answered only one version of the MAR-Scale, indicating they answered the scale for only one condition. 25.1% answered two versions, 13.2% answered three versions, and approximately 15.0% answered more than three versions. The mean age of these respondents was 51.2% and 57.3% were females. The average time taken to complete the MAR-Scale was 10.4 mins (standard deviation of 129.6 mins) and median time taken was 4.7 mins. Table 1 describes the demographic characteristics of these respondents.
 |
Table 1 Respondent demographics |
The study results show a wide variation in the rates of non-adherence across the various medicines, modes, and frequencies. For daily orals, the rate of non-adherence varied from 25.2% in diabetes to 63.7% in eczema. The rate of non-adherence with daily injections for diabetes was low, at 20.8%, and the most commonly cited reason was “simply missed”. Other common reasons included forgetting due to busy schedule, side effects, and cost. For weekly injections, while the rate of non-adherence was 96.9% for eczema, it was 33.3% for multiple sclerosis. Non-adherence was at 62.3% for weekly topicals for arthritis and pain, and it was at 50.2% for eczema. For weekly orals, non-adherence was lowest for osteoporosis, at 27.3%, and it was the highest for eczema and depression, at 76.5% and 76.1%. When examining weekly medicines, “skip to see if still needed” was the most common reason for non-adherence in weekly orals and topicals, and “side effects” was the most common reason for non-adherence in weekly injectables. Table 2 reports the overall rate of medication non-adherence with the various medicines in all the 17 disease conditions. Table 3 demonstrates the mean MAR-scale scores. Table 4 summarizes the top three reasons for medication non-adherence for all the medicines taken orally daily across all disease conditions. The most common reason for non-adherence across conditions was “simply missed it,” followed by “side effects” and “concern about long-term effects.”
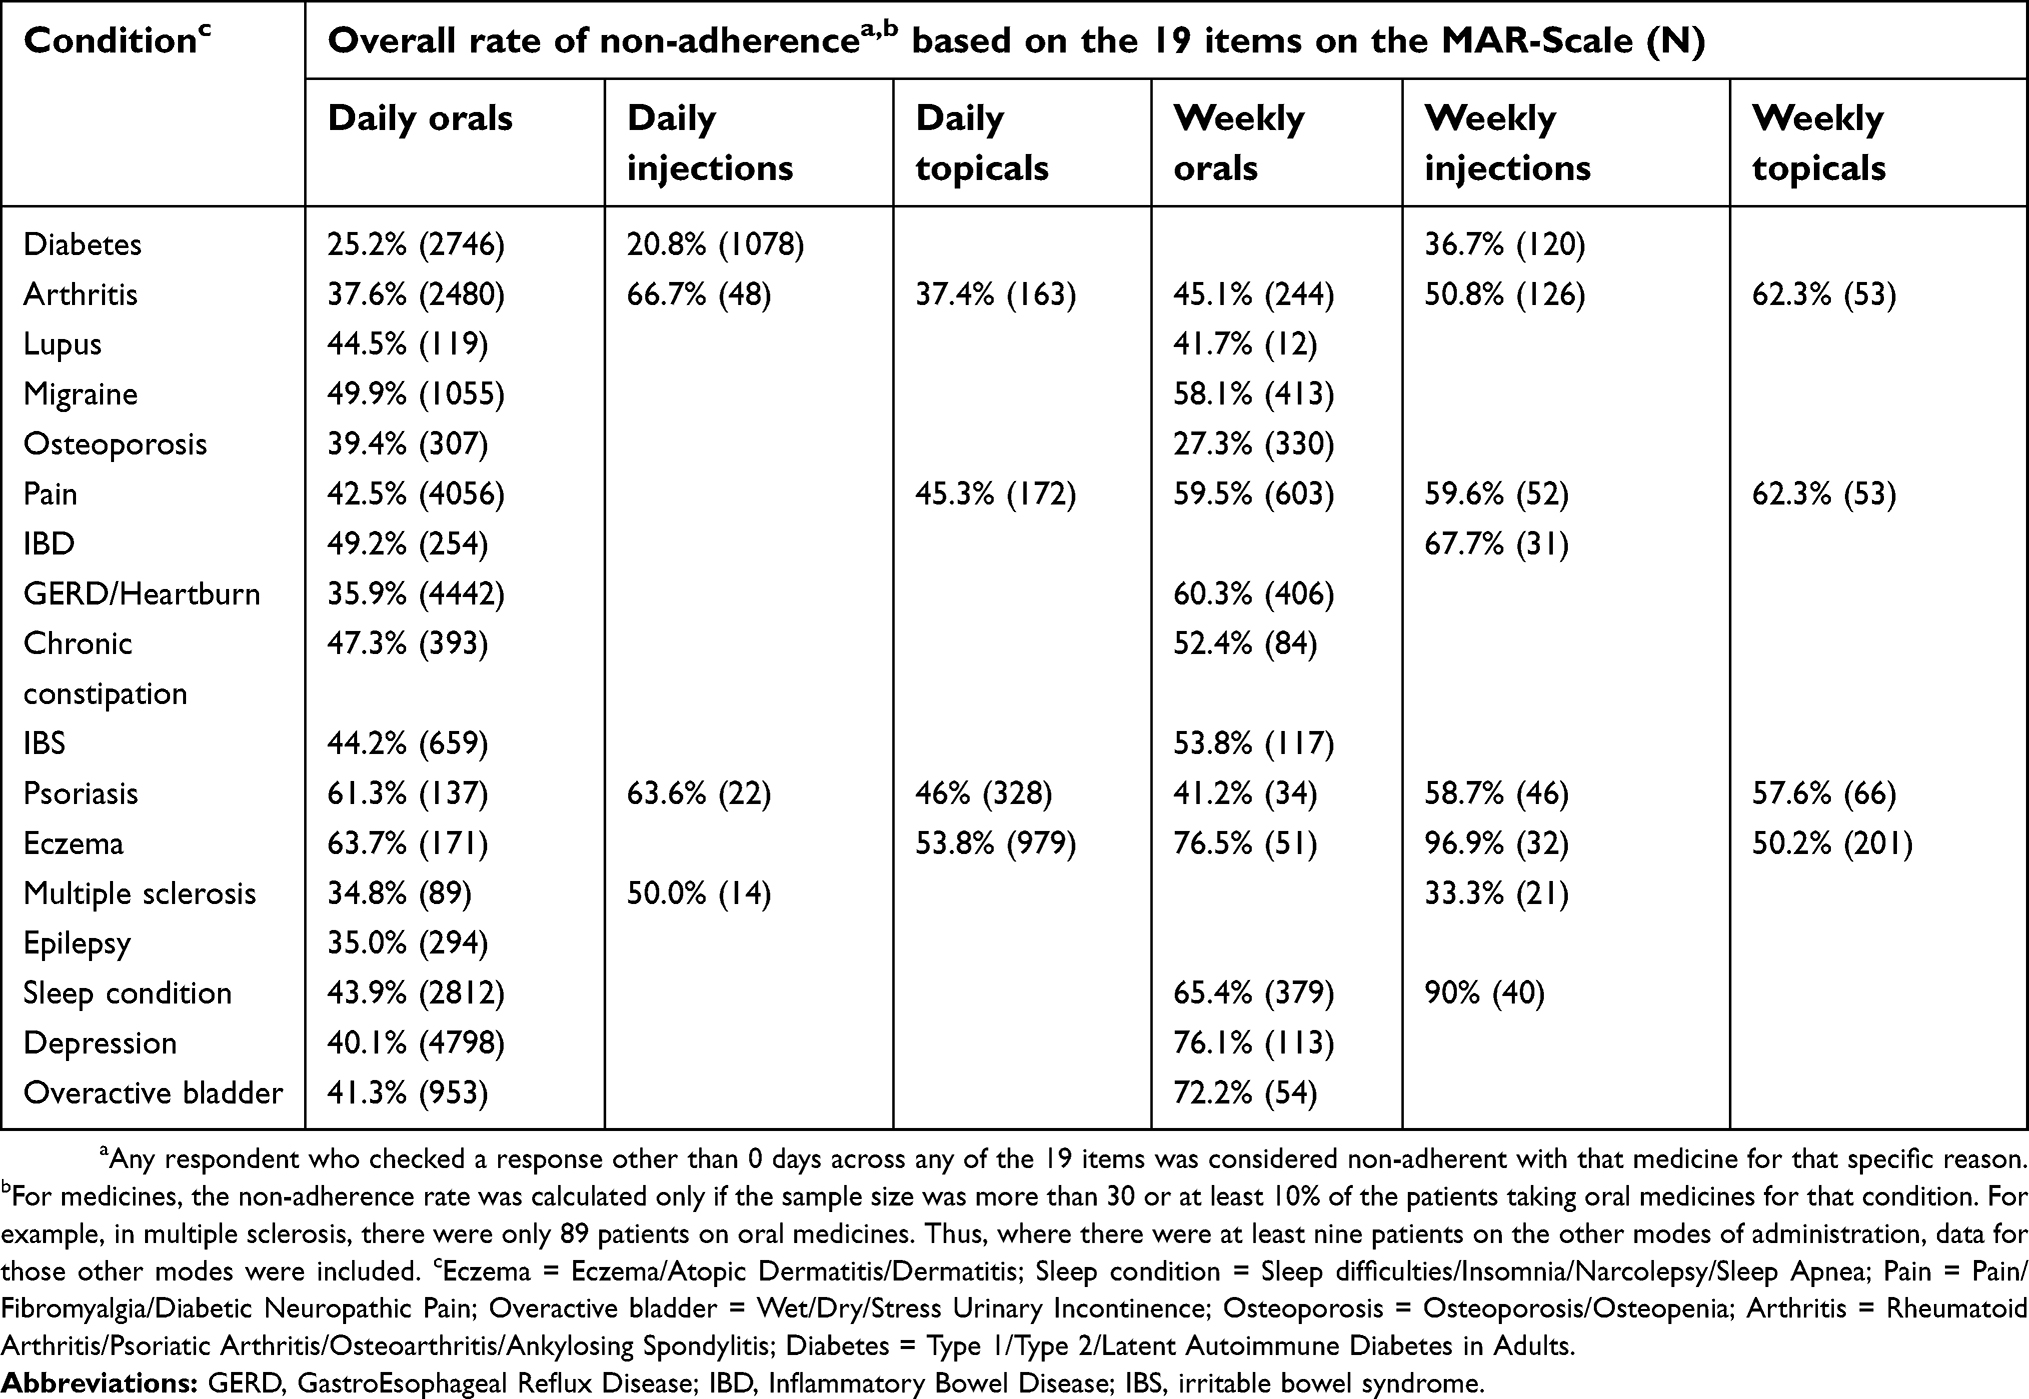 |
Table 2 Proportion non-adherent to medications |
 |
Table 3 Mean non-adherence scores |
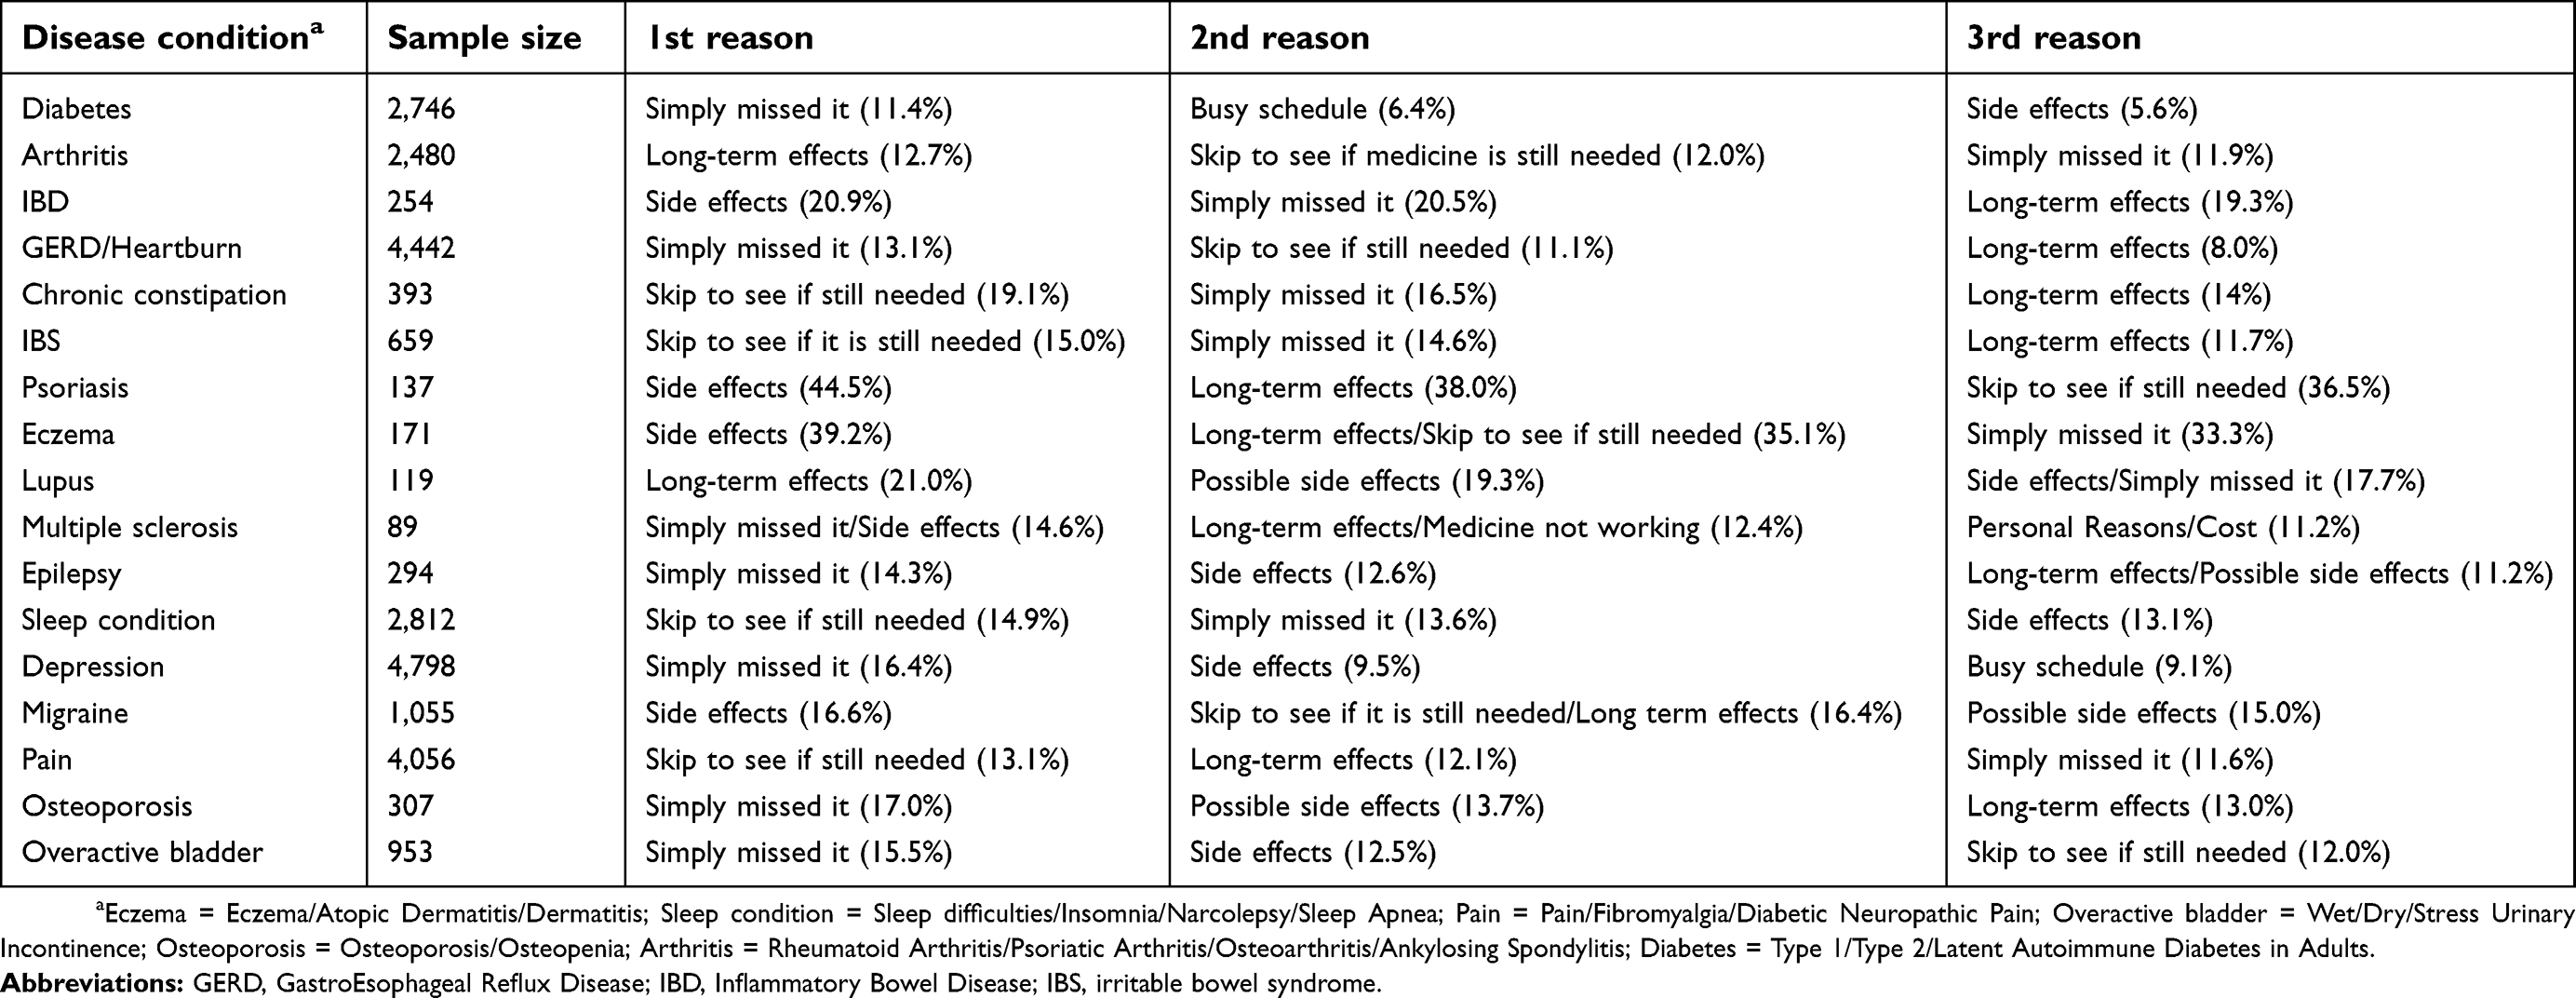 |
Table 4 Top three reasons for non-adherence with medicines taken daily and orally across all the 17 disease conditions |
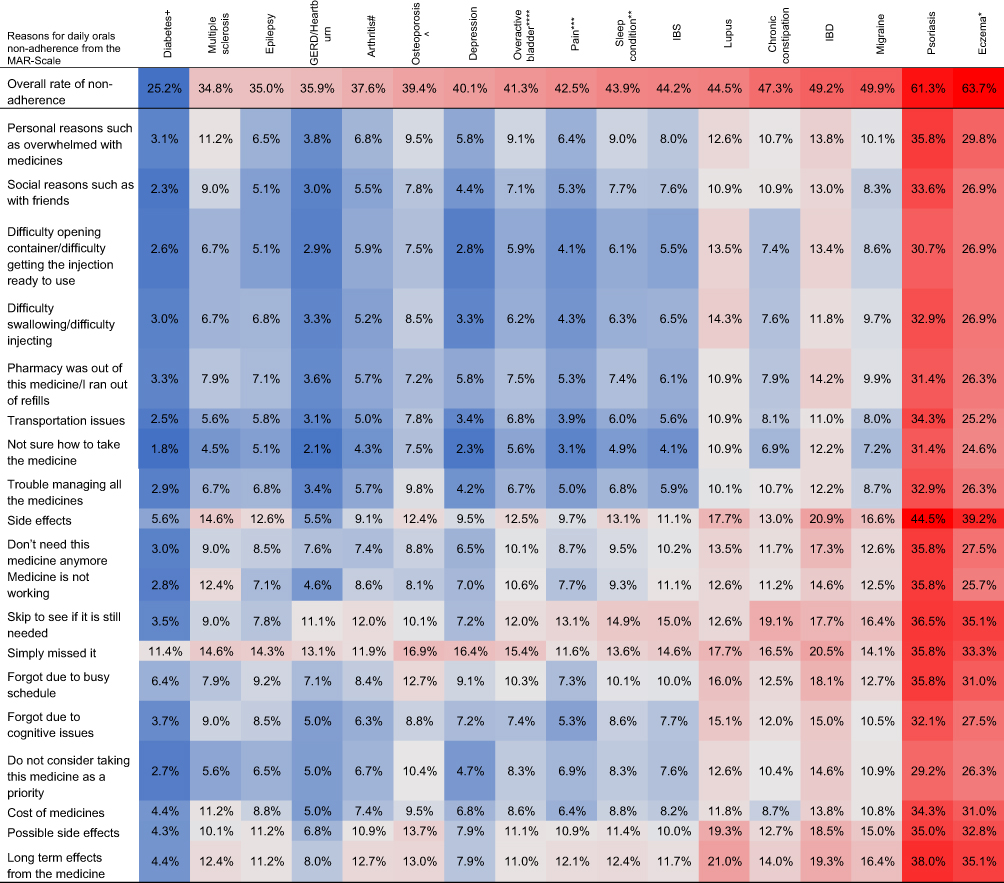
The reliability of the scale based on Cronbach’s alpha was higher than the “acceptable” threshold. The reliability statistics were not calculated for multiple sclerosis since the sample size was less than 100. For the other disease conditions, Cronbach’s alpha ranged from 0.887 in pain to 0.973 in psoriasis. No item was deleted to increase the Cronbach’s alpha. The split-half correlations ranged from 0.766 in pain to 0.984 in diabetes weekly injection. Table 5 lists the Cronbach’s alpha and Guttman split-half coefficient of the MAR-Scale across the various disease conditions and modes and frequencies of administration (whenever applicable). The use of MAR-Scale demonstrates the need for a comprehensive scale in measuring medication non-adherence. The rate of non-adherence based on the single global item is consistently lower compared with the medication non-adherence rate calculated from the 19 items identified as reasons for non-adherence (Figure 1). When patients are shown a comprehensive list of the commonly cited reasons for non-adherence, they are able to identify the various reasons why they missed their medicines. Additionally, the use of a comprehensive scale such as MAR-Scale demonstrates how patterns of non-adherence can vary across conditions (Table 6). For example, while respondents with lupus and depression have nearly identical overall non-adherence rates, those with lupus more frequently selected multiple reasons for their non-adherence, compared with mainly individual reasons for those with depression (as reflected in lower per-item frequencies relative to the equivalent overall averages). The same pattern can be seen in multiple sclerosis (multiple reasons) vs GERD/heartburn (individual reasons). Patterns across domains (rather than just conditions) are also informative; for example, while logistic reasons such as lack of access to a provider or pharmacy were relatively infrequent in most conditions, these reasons were equally prominent in eczema and psoriasis.
 |
Table 5 Reliability statistics for the MAR-scale across disease conditions and modes and frequencies of administration |
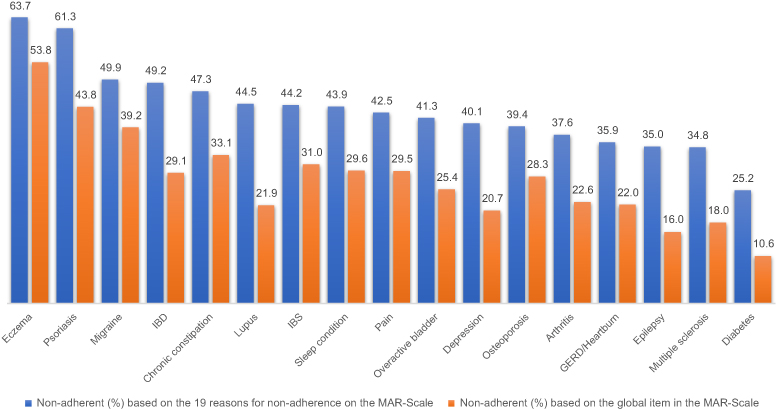 |
Figure 1 Comparison of proportion of respondents non-adherent (%) to daily oral medications for the 17 disease conditions based on the global item and the 19 items on the MAR-Scale. Eczema = Eczema/Atopic Dermatitis/Dermatitis; Sleep condition = Sleep difficulties/Insomnia/Narcolepsy/Sleep Apnea; Pain = Pain/Fibromyalgia/Diabetic Neuropathic Pain; Overactive bladder = Wet/Dry/Stress Urinary Incontinence; Osteoporosis = Osteoporosis/Osteopenia; Arthritis = Rheumatoid Arthritis/Psoriatic Arthritis/Osteoarthritis/Ankylosing Spondylitis; Diabetes = Type 1/Type 2/Latent Autoimmune Diabetes in Adults.Abbreviations: GERD, GastroEsophageal Reflux Disease; IBD, Inflammatory Bowel Disease; IBS, Irritable Bowel Syndrome. |
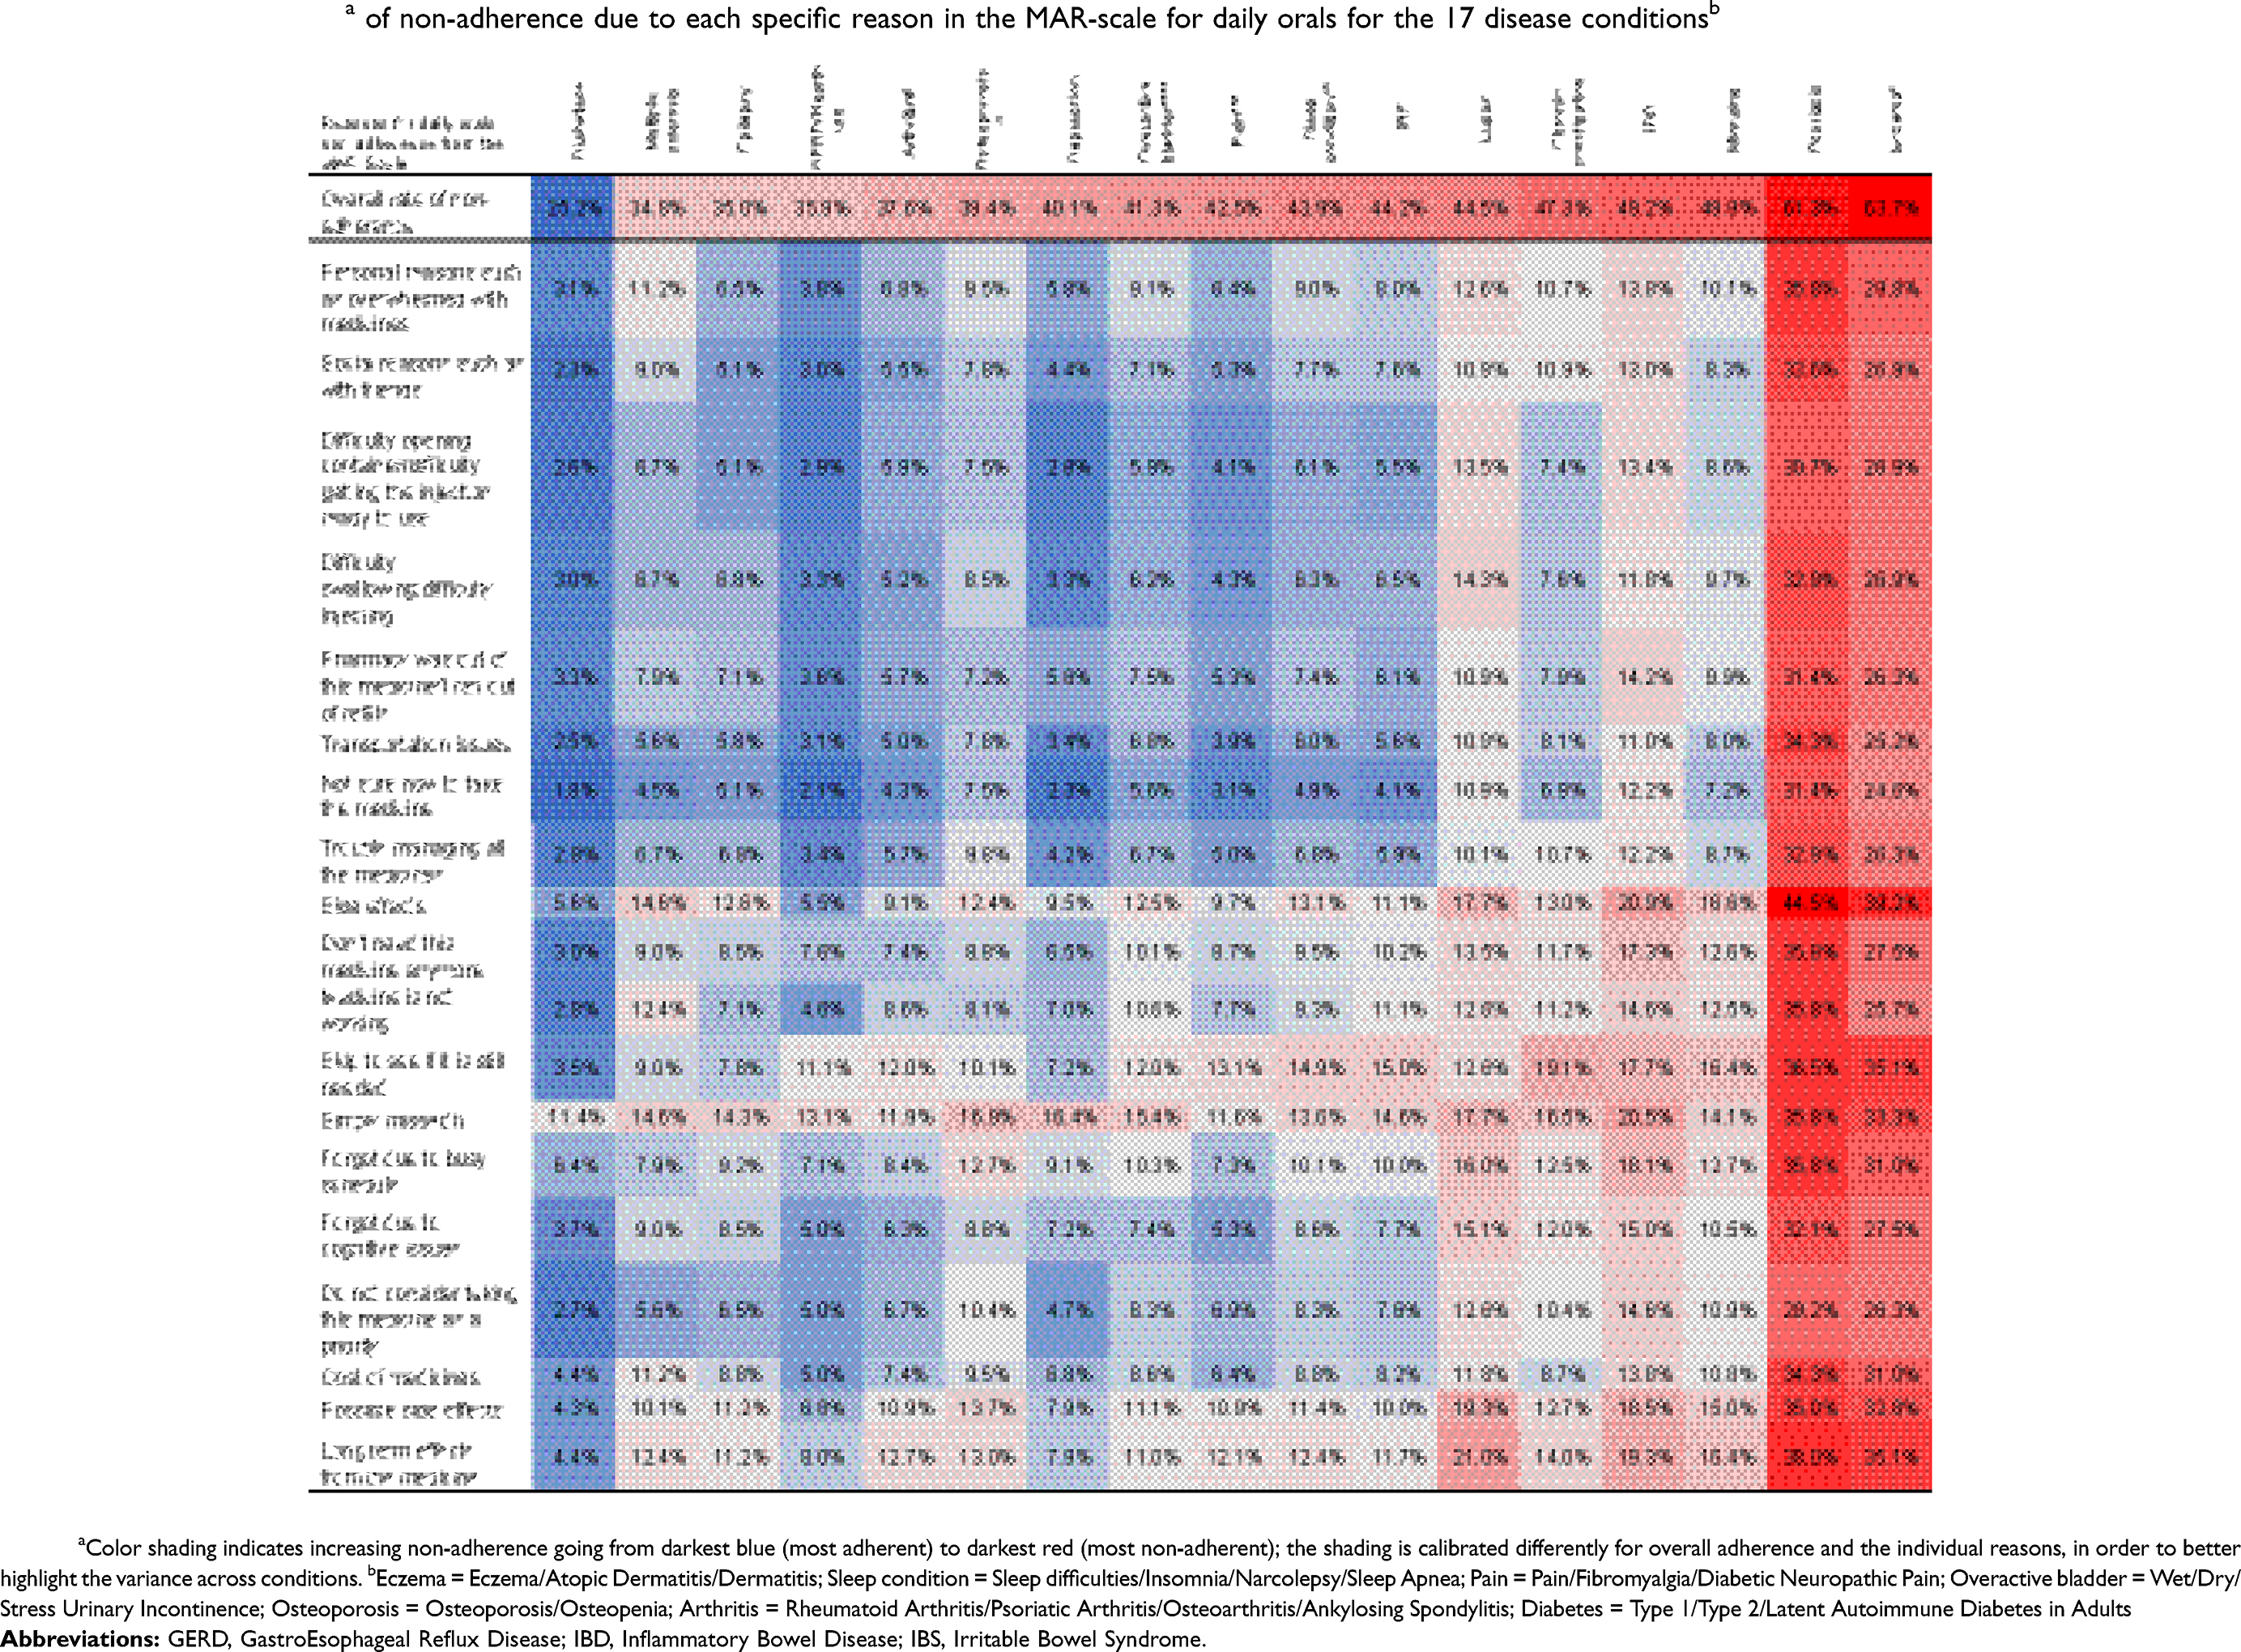 |
Table 6 Overall prevalencea of non-adherence due to each specific reason in the MAR-scale for daily orals for the 17 disease conditionsb
|
Discussion
The goal of the study was to assess the MAR-Scale’s reliability in multiple disease conditions and modes and frequencies of administration and to identify the most commonly cited reasons for non-adherence for the various disease conditions. MAR-Scale was able to reveal variation in the reasons for medication non-adherence across various conditions and modes and frequencies of administration. Additionally, the scale had acceptable reliability in all the disease conditions. Measuring medication non-adherence is challenging. Using secondary measures such as pharmacy claims databases can provide an accurate picture of the frequency of picking up medicines from the pharmacy. However, with claims databases, it is not certain as to whether the patient actually consumed the medication as prescribed. Similarly, when measured using a self-report measure such as MAR-Scale, there is a possibility of overestimation of adherence since patients may report adherence for social desirability reasons. Thus, comparing the rates of medication non-adherence across various studies can be a daunting task. What is more important is identifying those patients who self-report medication non-adherence, so that steps can be taken to remove the barriers to adherence. The MAR-Scale was developed with this exact intention, to identify the reason(s) for non-adherence, so that tailored interventions can be provided. While certain interventions can be straightforward based on the reasons, others can be more challenging. For example, non-adherence due to logistics such as side effects or transportation issues can be resolved with minimum intervention; other reasons such as “skip to see if it is still needed” or “taking this medicine is not a priority for me” necessitate more complex interventions. While there are several self-reported scales to measure medication non-adherence, the MAR-scale has several advantages.10,20–24 Medication non-adherence is a multidetermined phenomenon, with several facets that need to be measured in order to capture its complexity fully. MAR-Scale covers an inclusive, comprehensive breadth of possible reasons for medication non-adherence. Although longer than some other scales, MAR-Scale allows the provider to gain a more nuanced understanding of the reasons why a patient is not taking his or her medicine. Second, the scale quantifies medication non-adherence in one week’s (or month’s, for weekly dose) timeframe, thus lowering the risk of recall bias and linking the reasons for non-adherence to a specific period of time, as opposed to a more subjective, abstracted assessment of average behavior. Third, the scale is based on the number of days the medicine was missed, instead of agreement statements, which provides a more objective and easily quantified scale that can be used to compare non-adherence rates with refill records.
The MAR-Scale can be used either to measure the extent or frequency of medication non-adherence or the reasons for medication non-adherence. The non-adherence frequency item provides a rough estimate of the extent of medication non-adherence, and this rate can be used for macro-level interventions by a healthcare insurance or pharmacy based on the rates of non-adherence to a particular class of medications and the sizes of the populations affected. The 19 reasons-based items identify the reasons for non-adherence, which can be used for intervention purposes. Although this study only examined the rate of non-adherence and the common reasons for non-adherence for each class of medication, the scale can be used to determine the non-adherence reasons score for each patient for each medication. The earlier studies using this scale identified four domains from these 19 items: namely, non-adherence due to logistics, beliefs, forgetfulness, and long-term concerns.10 Depending on the responses from the patient, clinicians can decide either which reason to target or which domain to target for interventions. For example, if the score of a patient from the 19 items is 15, the clinician can evaluate which reasons are contributing to this score. If the score is 7 from forgetfulness due to change in schedules, 6 from not believing the medicine is working, and 2 from trouble managing all the medicines the patient has to take, the clinician can see that the patient has issues arising from the necessity of the medicines, probably leading to forgetfulness while on a busy schedule. This can be a good conversation starter for the clinician to understand the patient’s concerns about his or her medicines and work with the patient to overcome them. Additionally, if the intent of the research is to examine the common reasons for non-adherence, the 19 items can be used using a Yes/No scale rather than the eight-item 0–7 days scale. Thus, the utility of the MAR-Scale can be manifold, depending on the context of its use.
The global item in this scale demonstrates the need for a comprehensive scale in the measurement of medication non-adherence. When simply asked, “On how many days were you able to take your medicine as prescribed,” the response was mostly positive when compared with asking them, “Did you miss your medicine due to this specific reason?” This demonstrates the perception patients often have in their mind regarding their medication adherence that is often repeated during a physician visit when they are asked, “Are you taking your medicines?” Additionally, having a 7-day timeframe makes it comparatively easy for the patients to remember the number of days they missed their medicines. Also, since the reasons identified by the patients for non-adherence are recent, they can result in the provider taking steps to remove those barriers. However, the 7-day time frame can also result in overestimation or underestimation of medication adherence. For example, although cost was not an issue for adherence in the last week, it may have been a reason in the last month. On the other hand, if the patient was on vacation the prior week and hence missed taking the medicines, resulting in complete non-adherence, it may not reflect the usual situation. While communicating with patients, this needs to be kept in mind to get an overall picture of the patient’s medicine taking habits.
Clinicians and researchers often ask for short scales when measuring medication adherence. However, the results of this study demonstrate the informativeness of a comprehensive scale in measuring medication adherence. As can be seen from the results, the rates of medication non-adherence, as well as the reasons for non-adherence, vary across various conditions. For example, although both arthritis and osteoporosis reveal similar rates of non-adherence (37.6% and 39.4%), their primary reason for non-adherence is different. While patients reported concern about long-term effects as the primary reason for non-adherence with arthritis medicines, it was simple forgetfulness in osteoporosis. Similarly, whereas multiple reasons were selected for lupus, mainly one reason was chosen for depression, even though both diseases reveal similar rates of overall non-adherence; this kind of fine-grained differentiation can help increase vigilance for multiple reasons and multifaceted corresponding interventions in conditions such as lupus.
The strength of this study is the comparison of self-reported medication adherence across 17 disease conditions and modes and frequencies of administration. The study results emphasize the difference in the degree and reasons for non-adherence across these different disease conditions and within the same disease condition. Whereas the rate of non-adherence is approximately 37.6% with arthritis daily orals, it is close to 66.7% in daily injections. There are not many studies that have examined self-reported non-adherence patterns in this manner. In order to build on and strengthen the results of this study, future research should examine the rate and reasons for non-adherence across different disease conditions for the same patient, as well as to validate the scale in different conditions and to compare adherence and reasons for non-adherence statistically across disease groups. MAR-Scale can be used as an appropriate tool to understand how non-adherence varies and help identify which interventions can be used to improve medication adherence.
The study is not without limitations. The respondents were members of an online panel, thus resulting in some selection bias. However, measures were taken to ensure that the online panel has adequate representation of the US population by using quotas based on the US Census Bureau to resemble the general adult population. The dataset excluded respondents who did not wish to complete the survey but who otherwise would have submitted their surveys, if incomplete surveys were allowed. This may have resulted in the exclusion of respondents with a greater number of comorbid conditions. However, a sub-analysis showed that there was no statistically significant difference in the number of disease conditions reported by the respondents and those who were excluded based on incomplete responses. Additionally, as with most of the survey questionnaires, the responses are self-reported and can reflect social desirability and recall biases. More specifically, when we attempted to adapt the MAR-Scale for reporting daily and weekly medication use, it is unclear whether respondents always interpreted the intention of the frequency of administration correctly. This is especially a limitation for weekly administration, where, for example, biweekly and pro re nata medications could be interpreted or misinterpreted as nonadherent “weekly” medications. There is also the possibility that respondents reported treatment of a condition indirectly or not for traditional indications: for example, pain relief injections as a means of improving sleep reported as injections to treat sleep issues.
Conclusion
The Medication Adherence Reasons Scale demonstrates good reliability in multiple chronic disease conditions and across modes and frequencies of administration. The scale also demonstrates differences in non-adherence across various disease conditions, thus emphasizing the need for targeted adherence interventions. The scale can be used as a tool for macro-level understanding of medication non-adherence or for developing targeted interventions for a single patient, either for one disease condition or multiple conditions.
Data sharing
The Medication Adherence Reasons Scale can be obtained from the corresponding author upon request.
Ethics approval and consent to participate
The 2017 US NHWS survey was reviewed for exemption determination by Pearl IRB (Indianapolis, IN, USA; study number 14-KANT-146) prior to participant recruitment and found to meet the exemption requirements under DHHS 45 CFR46.101 regulations. All respondents viewed an online informed consent form and indicated their consent to participate prior to responding to the survey.
Acknowledgment
We acknowledge Kantar Health for data collection.
Disclosure
At the time of the study, Amir Goren and Nikoletta Sternbach were employees of Kantar Health, which provided funding and support for fielding the current version of the MAR-Scale. The authors report no other conflicts of interest in this work.
References
1. World Health Organization. Adherence to Long-Term Therapies: Evidence for Action. Geneva; World Health Organization; 2003.
2. Grahame-Smith D, Aronson J. Oxford Textbook of Clinical Pharmacology and Drug Therapy.
3. New England Health Care Institute. Thinking outside the pillbox: a system-wide approach to improving patient medication adherence for chronic disease; 2009. https://www.nehi.net/writable/publication_files/file/pa_issue_brief_final.pdf.
4. Vermeire E, Hearnshaw H, Van Royen P, Denekens J. Patient adherence to treatment: three decades of research. A comprehensive review. J Clin Pharm Ther. 2001;26:331–342.
5. DiMatteo MR. Variations in patients‘ adherence to medical recommendations: a quantitative review of 50 years of research. Med Care. 2004;42:200–209.
6. Vik SA, Maxwell CJ, Hogan DB. Measurement, correlates, and health outcomes of medication adherence among seniors. Ann Pharmacother. 2004;38:303–312. doi:10.1345/aph.1D252
7. Horne R. Patients‘ beliefs about treatment: the hidden determinant of treatment outcome? J Psychosom Res. 1999;47(6):491–495.
8. Nguyen TM, La Caze A, Cottrell N. What are validated self-report adherence scales really measuring? A systematic review. Br J Clin Pharmacol. 2014;77(3):427–445. doi:10.1111/bcp.12194
9. Unni EJ, Farris KB. Development of a new scale to measure self-reported medication nonadherence. Res Soc Adm Pharm. 2015;11(3):e133–e143. doi:10.1016/j.sapharm.2009.06.005
10. Unni EJ, Olson JL, Farris KB. Revision and validation of Medication adherence reasons scale (MAR-SCALE). Curr Med Res Opin. 2014;30(2):211–221. doi:10.1185/03007995.2013.851075
11. Bolge SC, Doan JF, Kannan H, Baran RW. Association of insomnia with quality of life, work productivity, and activity impairment. Qual Life Res. 2009;18(4):415–422.
12. Finkelstein EA, Allaire BT, DiBonaventura MD, Burgess SM. Direct and indirect costs and potential cost savings of laparoscopic adjustable gastric banding among obese patients with diabetes. J Occup Environ Med. 2011;53(9):1025–1029.
13. Gupta S, Richard L, Forsythe A. The humanistic and economic burden associated with increasing body mass index in the EU5. DiabetesMetab Syndr Obes. 2015;8:327–338.
14. Gupta S, Ryvlin P, Faught E, Tsong W, Kwan P. Understanding the burden of focal epilepsy as a function of seizure frequency in the United States, Europe, and Brazil. Epilepsia Open. 2017; 2(2): 199–213
15. Gruenberger J, Vietri J, Keininger D, Mahler D. Greater dyspnea is associate with lower health-related quality of life among European patients with COPD. Int J Chron Obstruct Pulmon Dis. 2017; 12: 937–944.
16. Gupta S, Kwan P, Faught E, Tsong W, Forsythe A, Ryvlin P. Understanding the burden of idiopathic generalized epilepsy in the United States, Europe, and Brazil: An analysis from the National Health and Wellness Survey. Epilepsy Behav. 2016; 55:146–156.
17. Gupta S, Isherwood G, Jones K, Van Impe K. Assessing health status in informal schizophrenia caregivers compared with health status in non-caregivers and caregivers of other conditions. BMC Psychiatry. 2015;15(162 ): 1–12.
18. Pavord I, Mathieson N, Scowcroft A, Pedersini R, Isherwood G, Price D. The impact of poor asthma control among asthma patients treated with inhaled corticosteroids plus long-acting β2-agonists in the United Kingdom: a cross-sectional analysis. NPJ Prim Care Respir Med. 2017; 27(1):17 : 1–9.
19. Yurdugul H. Minimum sample size for Cronbach’s coefficient alpha: a Monte Carlo study. H U J Edcn. 2008;35:397–405.
20. Svarstad BL, Chewning BA, Sleath BL, Claesson C. The brief medication questionnaire: a tool for screening patient adherence and barriers to adherence. Patient Educ Couns. 1999;37:113–124. doi:10.1016/S0738-3991(98)00107-4
21. Kripalani S, Risser J, Gatti ME, et al. Development and evaluation of the Adherence to refills and medications scale (ARMS) among low-literacy patients with chronic disease. Value Health. 2009;12:118–123. doi:10.1111/j.1524-4733.2008.00400.x
22. Morisky DE, Green LW, Levine DM. Concurrent and predictive validity of a self-reported measure of medication adherence. Med Care. 1986;24:67–74. doi:10.1097/00005650-198601000-00007
23. Hahn SR, Park J, Skinner EP, et al. Development of the ASK-20 adherence barrier survey. Curr Med Res Opin. 2008;24:2127–2138. doi:10.1185/03007990802174769
24. McHorney CA. The adherence estimator: a brief, proximal screener for patient propensity to adhere to prescription medications for chronic disease. Curr Med Res Opin. 2009;25:215–237. doi:10.1185/03007990802619425
 © 2019 The Author(s). This work is published and licensed by Dove Medical Press Limited. The
full terms of this license are available at https://www.dovepress.com/terms
and incorporate the Creative Commons Attribution
- Non Commercial (unported, 3.0) License.
By accessing the work you hereby accept the Terms. Non-commercial uses of the work are permitted
without any further permission from Dove Medical Press Limited, provided the work is properly
attributed. For permission for commercial use of this work, please see paragraphs 4.2 and 5 of our Terms.
© 2019 The Author(s). This work is published and licensed by Dove Medical Press Limited. The
full terms of this license are available at https://www.dovepress.com/terms
and incorporate the Creative Commons Attribution
- Non Commercial (unported, 3.0) License.
By accessing the work you hereby accept the Terms. Non-commercial uses of the work are permitted
without any further permission from Dove Medical Press Limited, provided the work is properly
attributed. For permission for commercial use of this work, please see paragraphs 4.2 and 5 of our Terms.