Back to Journals » Risk Management and Healthcare Policy » Volume 9
Using the failure mode and effects analysis model to improve parathyroid hormone and adrenocorticotropic hormone testing
Authors Magnezi R, Hemi A, Hemi R
Received 18 July 2016
Accepted for publication 5 November 2016
Published 1 December 2016 Volume 2016:9 Pages 271—274
DOI https://doi.org/10.2147/RMHP.S117472
Checked for plagiarism Yes
Review by Single anonymous peer review
Peer reviewer comments 2
Editor who approved publication: Professor Frank Papatheofanis
Racheli Magnezi,1 Asaf Hemi,1 Rina Hemi2
1Department of Management, Public Health and Health Systems Management Program, Bar Ilan University, Ramat Gan, 2Endocrine Service Unit, Sheba Medical Center, Tel Aviv, Israel
Background: Risk management in health care systems applies to all hospital employees and directors as they deal with human life and emergency routines. There is a constant need to decrease risk and increase patient safety in the hospital environment. The purpose of this article is to review the laboratory testing procedures for parathyroid hormone and adrenocorticotropic hormone (which are characterized by short half-lives) and to track failure modes and risks, and offer solutions to prevent them. During a routine quality improvement review at the Endocrine Laboratory in Tel Hashomer Hospital, we discovered these tests are frequently repeated unnecessarily due to multiple failures. The repetition of the tests inconveniences patients and leads to extra work for the laboratory and logistics personnel as well as the nurses and doctors who have to perform many tasks with limited resources.
Methods: A team of eight staff members accompanied by the Head of the Endocrine Laboratory formed the team for analysis. The failure mode and effects analysis model (FMEA) was used to analyze the laboratory testing procedure and was designed to simplify the process steps and indicate and rank possible failures.
Results: A total of 23 failure modes were found within the process, 19 of which were ranked by level of severity. The FMEA model prioritizes failures by their risk priority number (RPN). For example, the most serious failure was the delay after the samples were collected from the department (RPN =226.1).
Conclusion: This model helped us to visualize the process in a simple way. After analyzing the information, solutions were proposed to prevent failures, and a method to completely avoid the top four problems was also developed.
Keywords: failure mode and effect analysis (FMEA), laboratory medicine, team work, rank failures, test repetition
Background
Failure modes and effects analysis (FMEA) was first used in the aerospace industry to assess complex processes in order to identify elements that might cause harm and to prioritize remedial measures. It is based on the concept that risk is related to the likelihood of a failure, the severity of its consequences, and the feasibility of detecting and intercepting a failure before it occurs.1–3
The FMEA approach assigns each element of the process under investigation a risk priority number (RPN). This numerical rating of the severity, probability, and detection of each failure is used to prioritize actions needed for error prediction and prevention.4–6
The FMEA method has been used before in medical processes and has shown improvements in multidisciplinary areas, including documentation compliance,7 blood transfusion,8 and improvement of insulin pumps.9 The model is relevant to medical fields and patient safety because it can be applied to new processes before substantial damage or failure occurs.
The FMEA process consists of five major steps:
Define the FMEA topic. The examined topic should have high-risk potential or should be an unfamiliar process relating to patient safety.
Establish a multidisciplinary team. The team consists of a subject matter expert, an advisor, and a team leader. The subject matter expert’s role is necessary for understanding the process. However, including members not familiar with the topic may encourage critical review and provide greater diversity.
Drafting the process graphically. Describe the topic through a flow diagram, starting from the significant steps (using 1, 2, 3,...), and afterwards identify all subprocesses under each step (numbered 1A, 1B, 2A, 2B, 2C, etc).
Identify and rank failure modes. List all possible failures of the process and then determine the severity, probability, and detection on a numerical scale. Probability refers to the frequency of the failure, severity is the degree of harm for the patient, and detection is the ability to detect the failure before patient harm occurs. After ranking, these three scores are multiplied to one critical score or RPN. The higher the RPN score, the greater the risk associated with a failure.
Actions and outcome measures. The team needs to determine the causes of the high-risk failures so as to suggest preventive actions. Afterward, these actions need to be monitored and improved, if needed.10–11
FMEA is a useful tool for mapping complex processes and helps the multidisciplinary teams brainstorm and become more effective. However, there are some problems in validating the FMEA outcomes. Since team data sources, personal experiences, knowledge, and interests are individual, different teams will probably arrive at different outcomes for same process. Furthermore, multiplying ordinal scales to prioritize failures (RPN) is mathematically flawed.12
Parathyroid hormone (PTH) testing is used to help identify hyper- and hypoparathyroidism, to find the cause of abnormal calcium levels and to check the status of chronic kidney disease. Adrenocorticotropic hormone (ACTH) testing is designed to diagnose Cushing’s syndrome and adrenal insufficiency. These two hormones have a very short half-life: 4–5 minutes for PTH and 10 minutes for ACTH. Consequently, samples must be transferred and cooled immediately after they are drawn. Thus, the blood draw has to be carefully timed to ensure reliable results.
The degree of coordination necessary between the department and the laboratory can create logistical challenges in terms of scheduling a blood draw and maintaining optimal conditions until the specimen can be centrifuged. This study used the FMEA model to identify and examine possible risks in PTH and ACTH testing processes, with the goals of providing better service to patients and avoiding wasted resources.
Methods
The study was directed by the head of the 1,460-bed hospital. The endocrine laboratory receives an average of 8,300 tests per month. The project was part of an ongoing laboratory quality improvement program. The multidisciplinary team selected to plan and implement FMEA included two laboratory technicians, the endocrine laboratory director, the medical director of endocrinology, an internal medicine physician specializing in endocrinology, and three nurses.
The steps of the process were mapped, from requesting the test, scheduling the patient, and cooling the specimen through sample analysis, obtaining the result, and sending it to the physician. Next, potential failures at each step were identified. Team members assigned values from 1 to 10 based on the risk of injury should a failure result (severity, S); the frequency with which failures occur (occurrence, O); and the likelihood that a failure goes undetected before injury results (detection, D). The risk for each element is expressed as RPN and is calculated as the product of the severity, occurrence, and detection scores (RPN = S × O × D). The RPN identifies the most likely contributors to medically serious failures and also the priority measures.
Results
As summarized in Table 1, 19 high-risk failure modes were identified and the RPN calculated for each. A hazard analysis was completed by plotting the RPNs of the four highest failure modes in a priority matrix (Table 2). The four colors reflect priority levels for action: urgent (red); prompt (orange); scheduled (yellow); and monitoring (green). The priority matrix provides graphical evidence of which steps require urgent, corrective action.
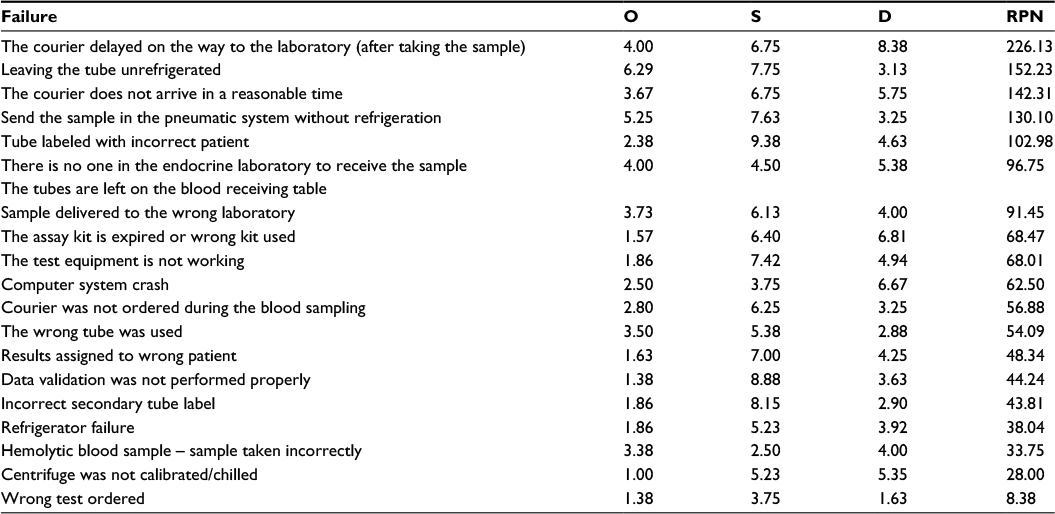 | Table 1 High-risk failure modes identified and their RPN Abbreviations: RPN, risk priority numbers; O, occurrence; S, severity; D, detection. |
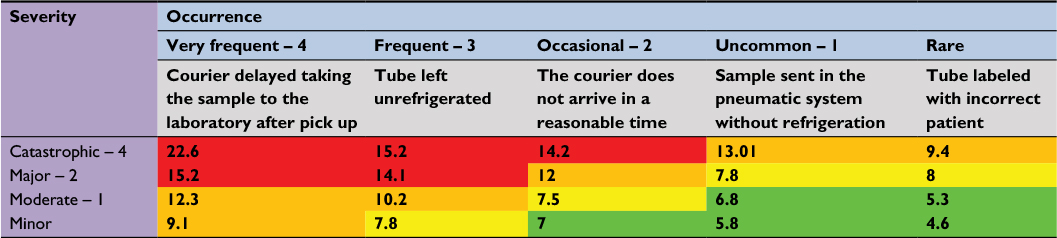 | Table 2 Priority matrix of the four highest failure modes Notes: The four colors reflect priority levels for action: urgent (red); prompt (orange); scheduled (yellow); and monitoring (green). The priority matrix provides graphical evidence of which steps require urgent, corrective action. |
Following the failure ratings, we performed an analysis based on a fishbone chart for four of the failures with the highest RPN score:
The courier delayed on the way to the laboratory (after taking the sample)
The tube was not refrigerated
The courier did not arrive in a reasonable time
The sample was sent via the pneumatic system without refrigeration.
The main conclusion we arrived at was that these four flaws could be resolved by using designated refrigeration containers and changing the method of sending the PTH and ACTH samples through the pneumatic system. This solution is inexpensive relative to patient inconvenience and the waste of hospital staff time. It is also easy to implement.
Discussion
Patient safety is a pressing health care challenge. Reducing the likelihood of clinical risks in hospitals is an important element in improving health care quality, developing effective staff and patient relationships, ensuring patient satisfaction, and limiting complaints regarding care.13,14
The International Organization for Standardization incorporated a technical specification for medical laboratories, suggesting FMEA for prospective risk analysis of high-risk processes.15,16 This systematic, bottom-up, teamwork-based tool is used to define, detect, prevent, eliminate, and control failures and to discover reasons for and effects of potential errors in a service system.
The FMEA process simplified laboratory procedures and revealed several failures. The RPN score allowed our team to focus on the major process failures. The four most serious failures were analyzed to determine causes and ways to prevent them. For example, for the first one “The courier delayed on the way to the laboratory (after taking the sample),” we suggested switching to filling out forms manually, a method that allows tracking delivery times or requiring a GPS system for the couriers. The first solution takes time and the second is costly to implement.
One of the most common problems was transporting and packaging samples. We found that refrigerator containers would allow sending the blood samples through the pneumatic system immediately after they were drawn. This solution simultaneously shortened shipping time and solved the cooling problem, and it also freed the shipping department to manage other assignments.
FMEA is not without limitations. Potts et al17 showed that using FMEA took more time than other prospective hazard analyses that identify risks, but the advantage is that it also suggests solutions. FMEA is probably the best known method for prospective hazard analysis in health care and has helped identify more hazards than other methods; however, it showed poor concordance with the hazards identified simultaneously by other methods.
Additional studies are needed to analyze the financial implications (personnel, equipment, hospitalization duration, etc) of wrong tests. For example, if purchasing refrigerated containers is less expensive, it would be better to change the work process.
Conclusion
Laboratories are inherently risky environments. A formal risk assessment process such as FMEA is an opportunity to describe how a systematic approach to highlight potential laboratory failures can be used. This type of analysis should be considered to help solve problems that occur in other complex, high-risk health care situations.
Disclosure
The authors report no conflicts of interest in this work.
References
Joint Commission Resources. Failure Mode and Effects Analysis in Health Care: Proactive Risk Reduction. 3rd ed. Oak Brook, IL: Joint Commission International; 2010. | ||
Sharma RK, Kumar D, Kumar P. Systematic failure mode effect analysis (FMEA) using fuzzy linguistic modeling. Int J Qual Reliab Manage. 2005;22:986–1004. | ||
Joint Commission on Accreditation of Healthcare Organizations. An introduction to FMEA. Using failure mode and effects analysis to meet JCAHO’s proactive risk assessment requirement. Failure Modes and Effect Analysis. Health Devices. 2002;31:223–226. | ||
Grissinger M, Rich D. JCAHO: meeting the standards for patient safety. Joint Commission on Accreditation of Healthcare Organizations. J Am Pharm Assoc (Wash). 2002;42(5 Suppl 1):S54–S55. | ||
Hojatnejad A. LPG spherical tank safety assessment using FMEA techniques and ETBA. Behbood J. 2008;12:180–189. | ||
Sedaghat A. Assessment and risk management of an emergency military field using the FMEA method. J Milit Med. 2008;10:167–174. | ||
Rosen MA, Chima AM, Sampson JB, et al. Engaging staff to improve quality and safety in an austere medical environment: a case–control study in two Sierra Leonean hospitals. Int J Qual Health Care. 2015;27;4:320–327. | ||
Lu Y, Teng F, Zhou J, Wen A, Bi Y. Failure mode and effect analysis in blood transfusion: a proactive tool to reduce risks. Transfusion. 2013;53:3080–3087. | ||
Uslan MM, Burton DM, Chertow BS, Collins R. Accessibility of insulin pumps for blind and visually impaired people. Diabetes Technol Ther. 2004;6:621–634. | ||
DeRosier J, Stalhandske E, Bagian JP, Nudell T. Using health care failure mode and effect analysis. Jt Comm J Qual Improv. 2002;27:248–267. | ||
Spath P. Introduction to Healthcare Quality Management. Chicago, IL: Health Administration Press; 2009. | ||
Shebl NA, Franklin BD, Barber N. Failure mode and effects analysis outputs: are they valid? BMC Health Serv Res. 2012;12:150. | ||
Singer M, Little R. ABC of intensive care. Cutting edge. BMJ. 1999;319:501–504. | ||
Chiozza ML, Ponzetti C. FMEA: a model for reducing medical errors. Clin Chim Acta. 2009;404:75–78. | ||
Trucco P, Cavallin MA. Quantitative approach to clinical risk assessment: the CREA method. J Saf Sci. 2006;44:491–513. | ||
Asefzadeh S, Yarmohammadian MH, Nikpey A, Atighechian G. Clinical risk assessment in intensive care unit. Int J Prev Med. 2013;4:592–598. | ||
Potts HW, Anderson JE, Colligan L, Leach P, Davis S, Berman J. Assessing the validity of prospective hazard analysis methods: a comparison of two techniques. BMC Health Serv Res. 2014;14:41. |
 © 2016 The Author(s). This work is published and licensed by Dove Medical Press Limited. The
full terms of this license are available at https://www.dovepress.com/terms
and incorporate the Creative Commons Attribution
- Non Commercial (unported, 3.0) License.
By accessing the work you hereby accept the Terms. Non-commercial uses of the work are permitted
without any further permission from Dove Medical Press Limited, provided the work is properly
attributed. For permission for commercial use of this work, please see paragraphs 4.2 and 5 of our Terms.
© 2016 The Author(s). This work is published and licensed by Dove Medical Press Limited. The
full terms of this license are available at https://www.dovepress.com/terms
and incorporate the Creative Commons Attribution
- Non Commercial (unported, 3.0) License.
By accessing the work you hereby accept the Terms. Non-commercial uses of the work are permitted
without any further permission from Dove Medical Press Limited, provided the work is properly
attributed. For permission for commercial use of this work, please see paragraphs 4.2 and 5 of our Terms.