Back to Archived Journals » International Journal of Wine Research » Volume 7
Usage rate segmentation: enriching the US wine market profile
Authors Kelley K, Hyde J, Bruwer J
Received 21 January 2015
Accepted for publication 9 March 2015
Published 8 May 2015 Volume 2015:7 Pages 49—61
DOI https://doi.org/10.2147/IJWR.S81285
Checked for plagiarism Yes
Review by Single anonymous peer review
Peer reviewer comments 2
Editor who approved publication: Dr Roger Pinder
Kathleen Kelley,1 Jeffrey Hyde,2 Johan Bruwer3
1Department of Plant Science, 2Department of Agricultural Economics, Sociology, and Education, The Pennsylvania State University, University Park, PA, USA; 3School of Marketing, University of South Australia, Adelaide, SA, Australia
Abstract: The purpose of this research is to enrich our knowledge of the US wine market and provide insights into how usage rate segmentation can be enhanced by select innovative perspectives of current offerings. Data were collected through a 15-minute online survey of 910 US wine drinkers randomly selected from a panel of consumers. It was found that the “super core” segment not only drank wine more frequently, but also were more likely to drink other types of alcohol presented (beer, distilled spirits, and ready-to-drink cocktails), and at a greater frequency, “at least once a week” and “about once a week”, than “marginal” drinkers. Differences between usage rate segments existed between sex and age generations. Female millennial “super core” consumers would increase wine consumption if the number of calories were reduced to fewer than 80 per 5 oz serving. Practical implications for a winery or wine retailer might include the potential to add these beverages to their product offering or bundling these beverages to create packages (allowing for mass customization, which is used often in retail) and appropriately marketing these offerings to their customers. Changes that may invoke a positive response are wine made from “sustainably farmed” or “naturally farmed” grapes, and certified carbon-free wine. From an originality viewpoint, this study is the first to investigate how usage rate segmentation can be enriched by means of variable cross-extension and examination.
Keywords: consumer behavior, market segmentation, usage rate, consumption frequency, USA
Introduction
It has been an ongoing challenge for researchers to find the segmentation basis best suited to a specific market. According to Berni et al, when a product is as versatile as wine, traditional approaches (geographic, demographic, and psychographic), can be restrictive.1 The use of the more traditional approaches to market segmentation, most notably those based on demographics, to explain or predict consumer behavior, has been questioned mainly because demographics lack richness.2,3 In the case of wine, Bruwer et al assert that demographics are inadequate to describe let alone provide the information basis from which to successfully penetrate wine target segments.4
A market can be segmented in many ways although, in general, there are three distinct approaches to specify market segments. These include analysis of consumer characteristics (ie, sociodemographics, personality, attitude), analysis of consumer response (situation-specific), and simultaneous analysis of consumer characteristics and consumer response.5 In recent times, techniques used in market segmentation have come under scrutiny. Dibb et al cite some of the conceptual and empirical problems associated with the technique as a probable cause for the difficulty in establishing a confirmed link between market segmentation and (improved) organizational performance.6 There have also been questions posed in the marketing literature about whether market segments are stable entities.7,8 Although no single approach to market segmentation is necessarily “superior” to others, the characteristics of the market to be segmented (ie, size, product category, level of evolvement, and current research knowledge base) all combine to influence the decision about the segmentation approach to use.
The US wine market is an example of a market that is still immature by world standards in terms of consumption, yet its size alone warrants further investigation. Wine sales in the USA continue to grow, with 337.9 million 12-bottle cases worth $39.9 billion sold in 2013, and sales are predicted to reach 373.3 million 12-bottle cases in 2018, making the USA the world’s largest wine consumer market.9 Harris Interactive revealed that 60% of US adults purchased wine in 2013; however, the Wine Market Council reported that just over one-third (35%) of adults aged 21 years and older consumed wine in 2013.10,11 Growth was not restricted only to consumption as the number of wineries in the USA grew by nearly 4% in 2013 over the previous year to reach a total of 7,762.12 At the same time, the USA is also a large importer of wine, which accounted for 38% of sales volume.9 Therefore, with an array of international brands added to this growing wine market, consumers have access to a very large assortment of wines. With so much choice available to consumers, wineries may struggle with how to differentiate their product in the US market place.13
Despite the fact that the US wine market has existed for more than a century and has become the largest in the world in terms of volume consumption, surprisingly little market segmentation research (in the public domain) has been conducted in which well-grounded academic research principles have been used. A case in point is the Wine Market Council in the USA, which has been conducting an ongoing consumer tracking study (through Merrill Research) since 1993 on a biannual basis. This longitudinal study, which employs the usage rate market segmentation approach, is arguably the most grounded one in the public domain and, although limited in scope, has withstood the test of time.
Based on segmenting consumers by usage rate (consumption), 57% of US wine consumers have been categorized as “core” drinkers (consume wine at least once a week) and 43% as “marginal” drinkers (consume wine less frequently). The core segment can be subdivided even further. Within the group, consumers that drank wine several times a week, if not daily, were identified as “super core” consumers. These consumers accounted for 11% of the US adult wine drinking population in 2013 and drank the majority (82%) of all table wine.14 In this study, we used the same approach to segment the market, but more specifically to illustrate ways and means to strongly enrich this approach. In short, we provide new insights into the use of usage rate segmentation methodology in the US wine market.
Literature review
In most markets, there is a need for market segmentation from the marketing managerial viewpoint in order to cope with the large diversity of consumer behavior and expectations. Businesses cannot connect with all customers and not all consumers are alike.15,16 Wine producers should determine which segments are the “right” types of consumer, given their products. The aim of market segmentation is to find homogeneous subgroups of people with different patterns of domain-specific values and behaviors.5 These subgroups should be large enough for a differentiated marketing approach, and should be within reach for advertising and distribution.17 Not surprisingly, almost every consumer behavior variable has been proposed for segmenting markets.18
As wine increasingly becomes a lifestyle beverage and more acceptable and desired by a wider spectrum of consumers, there is a greater need to understand wine consumption patterns and profiles, along with consumer values; in short, the dynamics of consumer behavior. Essential in the understanding of consumer behavior, and to convert this understanding into successful marketing strategies, is the adoption of a sound market segmentation approach.4 The marketing discipline is based on several grounded theories, and the principles encapsulated within these theories should not be overlooked in the approach adopted to segment a wine market. The key is not to oversimplify the interpretation of any of these theoretical constructs, whilst also not complicating straightforward marketing basics too much by looking for deeply theoretical explanations of what is in fact “commonsense” buyer behavior.
Market segmentation approaches
Businesses usually take a sequential process to segmenting their target markets using criteria/variables that differentiate groups based on their purchasing behavior.16,19 There are two broad approaches for segmenting a market, either descriptive in nature (geographic, demographic, and psychographic) or behavioral in nature (benefits sought, occasion-based, and involvement).16 Ideally, a combination of both methods provides a greater understanding of the different segments. However, any method of segmentation can be used as long as the segments are measurable, substantial, accessible, differentiable, and actionable, and then it is functional for marketers.16 There are several research publications on the conceptual and methodological foundations of market segmentation (ie, Orth et al) and hence there is no need for an elaborate general discussion thereof in this paper.20
In the history of market segmentation, most studies have involved an a priori or backward type of analysis, also known as the traditional or classical approach.2 They are particularly well suited to situations where it is known, from either prior research or experience, which demographic variable can be used to split consumers into homogeneous subgroups in terms of their response. A priori segmentation is thus a procedure whereby a company chooses to break out customer groups by a generally accepted classification procedure related to variations in customer purchase or usage of the product category. If, on the other hand, the situation is not conducive to an a priori approach, a response-based, post hoc, or a posteriori approach can be used to best construct homogeneous response subgroups from the data provided. The classical approach for segmenting markets come from one or a combination of demographics, geographical characteristics, situational factors, and purchase and consumption behaviors, and is typically used to define segments of potential customers with similar behavior (ie, lifestyles).21 The “classical approaches” can be classified into four main market segmentation variable types, ie, geographic, demographic, psychographic, and behavioral. The current approach adopted by the Wine Market Council in the USA uses behavioral segmentation and hence our further discussion is focused thereon.
Behavioral market segmentation
Behavioral segmentation is an alternative to demographic segmentation and, some might argue, a more effective way of dividing the market as it focuses on actual consumer behavior, rather than the more tenuous demographics of age group, sex, geographical location, or income bracket. Behavioral segmentation is based on customer attitudes toward use of or response to a product. Many marketers believe that behavioral variables, such as occasion, benefits, user status, usage rate, buyer readiness stage, loyalty status, and attitude are the best starting points for constructing market segments.16 By combining the different behavioral variables, it is possible for marketers to get a view of a market and its segments and thereby the marketer can enhance its targeting strategies.16
Usage rate segmentation
For the past 21 years, the Wine Market Council in the USA has applied usage rate as the primary variable to segment the US wine market.14 One of the objectives of our study was to enrich the basic information base provided by usage rate segmentation and demonstrate the value of doing this in terms of a much sharper focus on the said segments. A short initial discussion of usage rate segmentation is thus prudent.
Usage rate segmentation divides consumers according to how much they use a product. They are divided into groups of non-users and light, medium, and heavy product users, and companies often seek to target one heavy user rather than several light users.22 This is due to the fact that heavy users constitute a small percentage of the market but account for a high percentage of the total buying.23 Thus, a company should seek to adapt their marketing strategy according to these customers. However, it should be mentioned that it is important not to exclude non-users, due to the fact that they may provide a positive prospect for future expansions. The usage rate variable may sometimes overlap with brand loyalty, as it looks at the rate and regularity with which consumers use a product or access a service. When analyzing demand for a product in terms of behavioral segmentation, it might be divided distinctly into those customers who use the product heavily or frequently, and those who are no less loyal, but only use the product occasionally.
Variables to enrich usage rate segmentation
Despite the fact that the value of demographic segmentation has been questioned, as discussed earlier, demographic and associated socioeconomic variables used in combination with product usage rate segmentation can enhance the latter considerably. Whereas we used a suite of socioeconomic variables, such as highest educational qualification, household income, number of adults and dependent children living in the household, and geography (state and metropolitan area of residence) to illustrate this process of enrichment, the demographic variables of sex and age are more pivotal as explanatory and/or antecedent variables.24,25
Atkin et al suggest that a good starting point when evaluating how consumers make wine buying decisions may be to look at differences by sex.26 It has been found that sex differences in wine consumption are likely to be associated more strongly with volume (and perhaps) wine style and grape variety.11 There has been a shift in sex roles, and in an Australian study on wine consumption and household income, females reported a higher incidence of being the decision-maker in wine purchasing.27 In the USA, women account for 60% of “high-end” wine buying. That is, they match two of the three following criteria: purchase wine costing more than US$15 occasionally to frequently, have more than 12 bottles on hand at home, and would buy a wine costing more than US$15 for a casual meal at home.14
Generational age cohorts are one of the least understood marketing dynamics. Generational issues are only one element that marketers should include in planning their marketing strategies.11 There is now a widely held belief that for the world wine market to grow, more young drinkers must be introduced to wine during the critical years in their early to mid 20s, during which they form consumption habits for life.28,29 In fact, Murphy found that most people in the USA have established their drinking preferences by the age of 40 years.30 Generally consumers’ wine consumption increases with age, peaking during the midlife stages before declining.31
Wine consumers can be split into two main groups, ie, regular and infrequent drinkers. There is no universal standard for denoting frequency of wine consumption, and such a perspective on wine consumption is therefore very much country-specific.31 In most instances, the “at least once a week” consumer will be regarded as a regular wine drinker, including in the UK and USA.14,32 In Australia, Bruwer et al go a step further and equate frequency with actual volume consumption, enabling them to segment the consumers into light, moderate, and heavy drinkers.25 This shows that consumption in the Australian wine market is male-dominant as opposed to the female dominance in the UK and US wine markets.14,32 It is also clear that young millennial consumers (aged 21–34 years) drink significantly less wine than the older generations.31 The relationships(s) between sex, age group, and consumption frequency are further investigated in this study.
Consumers rely on both extrinsic cues (eg, price, brand name, packaging, store name, country of origin, and color) and intrinsic cues (eg, taste, texture, and aroma) when assessing wine product quality. When consumers shop for wine, they face a plethora of wine brands on the shelves and must make their decision on information on the labels and the bottle, and/or on previous experience of the brand(s).33 Whereas labels are the second most important predictor of wine purchase intent after price,34 there has been very little research to date on what changes to wine product composition (as reflected on labels) would have an effect on purchasing. Hence our study examined what changes to standard composition (eg, reduced and increased alcohol content by volume) and wine bottle characteristics (eg, container size, material, and how the grapes and wines were produced) appealed to consumers and that could affect their purchasing decision.
In view of the aforementioned, our study’s overall aim was to improve the knowledge of wine usage rate segmentation in terms of a range of product innovations that would alter the “standard” product composition/offering in the US wine market. To give further direction to the research, three research questions were developed to: segment the wine market through usage rate segmentation and compare with the metrics as per the Wine Market Council’s longitudinal study;14 determine the degree of overlapping alcoholic beverage consumption (wine, beer, spirits, ready-to-drink cocktails) within the wine usage rate segments; and determine what changes to the “standard” wine product offerings would result in increased wine consumption within usage rate segments and between sex and age generations.
Materials and methods
Data were collected using a 15-minute Internet survey (July 12–17, 2011) administered to consumers residing in two metropolitan areas in the eastern USA (Philadelphia, PA, and New York, NY). Respondents were randomly selected from a panel of consumers managed by Survey Sampling International (Shelton, CT, USA), a provider of sampling solutions for survey research. Respondents received an electronic consent statement along with a link to the survey developed by the researchers. Respondents were screened for being at least 21 years old, a resident of one of the targeted metropolitan areas, having both purchased and drank wine at least once within the previous year, and not being a member of the wine industry (producer, wholesaler, or retailer).
Respondents answered questions about their wine purchasing and consumption attitudes and behaviors and sociodemographic questions. Upon completion of the survey, each respondent was entered into Survey Sampling International’s $12,000 quarterly drawing to compensate them for their time. Survey questions were pretested and administered to a sample of 102 randomly selected Survey Sampling International respondents. For the final survey, 1,945 panelists accessed the survey, of whom 1,136 met the criteria to participate. Of these, 910 respondents completed the final survey.
Data retrieved from the surveys were analyzed with Statistical Package for the Social Sciences version 20 software (SPSS Inc., Chicago, IL, USA) using analysis of variance followed by the Games-Howell test, as well as Pearson’s Chi-square and Phi and Cramer’s V tests to assess differences in response based on wine consumption frequency, sex, and age categories.
Results and discussion
Participant geographic, sociodemographic, and behavioral characteristics
Most common responses to demographic questions were female (72%), a member of a two-adult household (54%), residing with at least one other adult wine drinker (70%), living in a household with no children (56%), age 35–44 years (37%), in possession of a bachelor’s degree (38%), and with an annual household income between $25,000 and $75,999 (46%). Sixty-five percent of the participants lived in the New York City metropolitan area and 35% in metropolitan Philadelphia (Table 1). Close to one-third of participants resided in each of the three states that comprise the two metropolitan areas, ie, New York (37%), New Jersey (35%), and Pennsylvania (28%). The sex and age generation demographic variables are further explored in Table 7 in terms of respondents’ willingness to increase wine purchases if certain changes were made to the product’s composition.
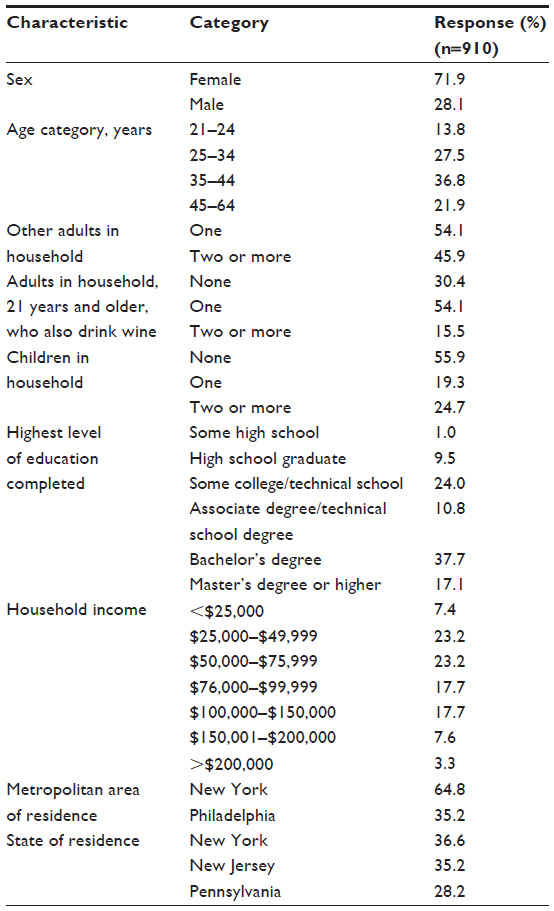 | Table 1 Sociodemographic profile of the wine consumers |
Based on responses to wine purchasing frequency (Table 2), 29% of respondents had purchased wine “a few times a year”, 24% “two to three times a month”, and 21% “about once a month”, with fewer responding that they purchased wine “more than once a week” and “about once a week” (8% and 19%, respectively). Regarding wine consumption during this period, nearly half of our participants (48%) could be characterized as “marginal” wine drinkers (drinking wine less frequently than once a week) with the remainder nearly evenly split between “core” wine drinkers (drinks wine once a week, 23%) and “super core” wine drinkers (those who drink wine more than once a week, 29%). We based our segmentation on that developed by the American Wine Market Council. This segmentation is the nexus of the council’s approach to usage rate segmentation in which the market has been broadly subdivided into super core (25%), core (32%), and marginal (43%) wine drinker segments. The sample distribution of our study thus mirrored this to a fair extent.
 | Table 2 Participant wine purchasing and consumption behaviors |
Pertaining to the type of alcohol consumed, 5% of people reported that they only drank wine (Table 2). Consumption of other alcoholic beverages was also documented, with a 23% incidence of not drinking beer, 14% not drinking distilled spirits, either alone or mixed, and 36% not drinking ready-to-drink cocktails.
Usage rate segmentation and sociodemographic characteristics
In accordance with the aim of the research, data were segmented into the three recognized wine consumption segments based on usage rate, ie, “super core”, “core”, and “marginal” wine drinkers. Significant differences were found between these groups for several demographic characteristics investigated (Table 3). Although in the minority, males had a relatively higher representation in the “core” segment and a lower representation in the “marginal” segment, with females exhibiting the opposite behavior. Twenty percent of participants aged 21–24 years were “core” wine drinkers, although the greatest percentage of “core” wine drinkers, as well as of “super core” and “marginal” drinkers, were in the group aged 35–44 years (generation X). For all three segments, at least half of the respondents (52%–58%) lived in a household with one other adult wine drinker. Although a greater percentage of “super core” wine drinkers obtained a master’s degree or higher compared with “marginal” wine drinkers, there was no difference between segments with regard to the percentage that had a bachelor’s degree. This education category also contained the greatest percentage of respondents in each segment. Significant differences were apparent for household income, with a greater percentage of “super core” wine drinkers reporting an income of $100,000 or higher (35%) than “marginal” wine drinkers (24%).
 | Table 3 Differences in demographic characteristics (for survey respondents based on wine consumption segmentation) |
No differences existed based on state of residence. While approximately a third of respondents in each segment resided in New Jersey (34%–36%), one-third to 42% resided in New York, and 23%–32% resided in Pennsylvania. Where differences did exist was between segments based on the metropolitan area where they resided. A greater percentage of “super core” (69%) and “core” (71%) wine drinkers than “marginal” wine drinkers (60%) lived in the New York metropolitan area, and the reverse trend existed for percentage of respondents residing in the Philadelphia metropolitan area, with more “marginal” wine drinkers (40%) living in this metropolitan area than the other two segments.
Differences in type of alcoholic beverage consumption
Table 4 shows that members of the “super core” segment were more likely to drink beer, distilled spirits, and ready-to-drink cocktails (83%, 91%, and 73%, respectively) than “marginal” wine drinkers (74%, 81%, and 59%, respectively), and more likely to drink ready-to-drink cocktails than “core” drinkers (62%). Significant differences were also found for frequency of consumption of beer and distilled spirits based on consumption segment. For example, a greater percentage of “super core” drinkers consumed beer “at least once a week” (40%) than the other two segments (25% and 14%) and “about once a week” (26%) compared with “marginal” drinkers (18%). A similar trend existed for consumption of distilled spirits and ready-to-drink cocktails, although the percent differences were not as dramatic as seen between segments for beer consumption. We conclude that there are overlapping wine drinker segments between the three main rivals in the alcoholic beverage market, ie, wine, spirits, and beer. The majority of wine drinkers also drink beer, distilled spirits, and/or ready-to-drink cocktails, which means competition for consumer dollars.
 | Table 4 Differences in alcoholic beverage type consumption and frequency of consumption per wine segment |
Price differences and wine varietals purchased
Apart from “wine priced at less than $6.00”, a significantly greater percentage of “super core” wine drinkers purchased wine priced $6.00 and higher than “marginal” wine drinkers (Table 5). Additionally, a greater percentage of the “super core” segment responded that they had purchased wine in the $30.00 to $39.99 and $40.00 or more (luxury) price categories (60% and 50%, respectively) than the “core” (48% and 41%, respectively) and “marginal” segments (30% and 22%, respectively). It follows that “super core” and “core” consumers not only consume the most wine, but also more likely to buy wine at higher price points.
 | Table 5 Price respondents paid for bottle of wine they consumed, wine varietals purchased, and past purchase of wine from Mid-Atlantic states (New Jersey, New York, and Pennsylvania) per wine segment |
Respondents were asked to indicate which of the 13 wine varietals presented they had purchased. A significantly greater percentage of “super core” drinkers reported purchasing each of the varietals presented, aside from “White Zinfandel”, than “marginal” drinkers (Table 5). This is not surprising because this varietal most often represents cheaper more affordable wines. Only one difference existed for “super core” and “core” drinkers, ie, a greater percentage of “super core” drinkers (71%) reported purchasing “Syrah/Shiraz” compared with “core” drinkers (57%).
Overall, slightly over one-third of respondents reported that they had purchased wine produced by New Jersey (35%) and Pennsylvania (37%) wineries, while 53% had purchased wines produced by New York wineries (Table 5). When segmented based on wine consumption, a greater percentage of “super core” wine drinkers had purchased wine produced by New Jersey (36%) and New York (37%) wineries compared with “marginal” wine drinkers (34% and 42%, respectively) and wine produced by Pennsylvania wineries (26%) compared with both “core” and “marginal” wine drinkers (23%), but less than marginal wine drinkers (32%).
Changes in wine bottle composition that will increase consumption per segment
Several bottle composition characteristics were investigated to better understand what features most appeal to wine consumers, and if preferences existed based on frequency of wine consumption. Characteristics were selected based on options readily available in the US market place. Respondents were asked to compare proposed options with a “standard” and indicate whether their purchases would increase, stay the same, or increase. Data are reported for “would increase purchasing” (Table 6).
 | Table 6 Willingness to increase wine purchases if proposed changes were made to wine they purchase |
Based on changes in alcohol and calorie content, relatively few “core” drinkers (11%) would increase their purchasing if a 750 mL bottle of wine contained “less than 10% alcohol content” compared with the standard “10%–14% alcohol content”, which was significantly different from “marginal” drinkers (13%). Percentages for the three segments did not differ significantly for wine that had a “15% or greater alcohol content”; however, 24%–27% of respondents in each segment reported that they would increase their purchasing based on the proposed change. Interest in “low calorie” wine was higher, with 46%–52% of respondents in each segment reporting that they “would increase purchasing” if wine contained “fewer than 80 calories per 5 oz serving” compared with the standard of “80–112 calories per 5 oz serving.” This represents a latent demand for more health consciousness in wine offerings, targeted at “super core” consumers in particular.
Although 40%–44% of respondents indicated their purchasing would increase, no differences were detected between segments if a “portion of proceedings of the bottle was donated to a cause the participant cares about”. However, “marginal” wine drinkers were significantly less likely to be influenced by a “portion of proceeds of a bottle of wine was donated to any cause” marketing program (20%) than “super core” drinkers (27%).
The issue of choice of closure type is still evolving in the wine industry, as evidenced by the fact that “super core” drinkers were significantly more likely to increase purchasing if a “cork closure” was used in place of a “screw cap closure” (29%) compared with “marginal” drinkers (21%). If a “synthetic (plastic) closure” was used in place of a “screw cap closure” no differences between segments existed, with only 11%–14% of respondents in each segment indicating that they would increase purchasing if “synthetic (plastic) closure” was used.
Changes to bottle composition and size yielded few differences. Compared with the standard, namely a “750 mL glass wine bottle that holds 4–6 glasses of wine (4–6 oz per glass)”, no significant differences existed between groups if the change included a “plastic bottle”, “aluminum can”, or “tetra pack”, or if the bottle was reduced to a “500 mL volume holding 2.5–4 glasses of wine”. Significant differences did exist if the container was increased to a “1.5 L volume holding 8–12 glasses” or “5 L box (eg, cask wine, bag-in-box, or boxed wine) holding 30–45 glasses”, with a greater percentage of “super core” drinkers indicating that purchasing would increase (33% and 27%, respectively) when compared with “marginal” drinkers (21% and 12%, respectively). “Super core” drinkers were also more likely to increase their purchases if the option was a “5 L box” compared with “core” drinkers (19%).
Several potential production and processing characteristics were compared against the standard wine, ie, wine that is not produced with sustainable, organic, biodynamic or similar grapes or processed using these methods. For all proposed changes, “super core” wine drinkers were more likely to respond that they would increase their wine purchases when compared with both “core” and “marginal” wine drinkers. Additionally, “core” wine drinkers were more likely to indicate that they would increase their purchasing if the wine was marketed as being made with “sustainably farmed” or “naturally farmed grapes”, and “made with biodynamic grapes” (42% and 14%, respectively) compared with “marginal” drinkers (35% and 9%, respectively).
Wine bottle composition changes that will increase consumption by sex and age group
Finally, the research examined if there were differences between sexes and age generations pertaining to the wine bottle composition changes discussed in the previous subsection that would increase consumption if introduced. Table 7 shows that females reported significantly greater willingness to purchase wine with fewer than 80 calories per serving (51% compared with 32% for males), a portion of proceedings donated to a cause they cared about (36% versus 31%), a portion of proceedings donated to any cause (25% versus 18%), and if the wine was marketed as certified carbon-free (24% versus 17%). Males, on the other hand, were significantly more loyal to cork closures (32% versus 21%) and, although acceptance was low, more inclined to accept alternative packaging materials such as aluminum cans (8% versus 3%) and tetra packs (10% versus 5%). No other differences between the sexes were significant.
 | Table 7 Willingness to increase wine purchases if proposed changes were made to wine they purchase |
When comparing the age generations, differences were more profound and existed across more wine compositional changes than sex. A clear pattern also emerged in the process. Young millennial consumers (aged 21–34 years) were significantly more likely than generation X and older consumers (aged ≥35 years) to increase wine consumption for all changes involving percent alcohol content, lower calories, cause-related donations, alternative packaging material types, and increased pack sizes. They were also more likely to respond positively to lower percent alcohol content and smaller bottle size (750 mL reduced to 500 mL), but these differences were not significant. Millennials were significantly more likely to increase consumption for both closure types (cork and synthetic) compared with screw caps. Finally, millennials were also significantly more responsive to environmentally friendly grape-growing, winemaking, and low carbon footprint wines, underlining the fact that they are more receptive to innovations in wine compensation in general.
Conclusion and managerial implications
The techniques used in market segmentation have come under fire in recent times, and there have also been questions posed in the marketing literature about whether market segments are stable entities, or whether they even exist at all. Our study did not attempt to weigh into this debate (if there is one to be had), but demonstrated instead how a basic segmentation approach can be enriched through the careful introduction and cross-examination of other variables. We uncovered fairly robust additional differences between the super core, core, and marginal segments of the US wine market. These are discussed below from the viewpoint of their practical implications.
From this study, there are apparent differences between what “super core” drinkers and what “marginal” wine drinkers have purchased. Knowing which wine-consuming segments shop at a retail outlet is key when marketing wine at higher price ranges as differences in percentages in each segment did become more apparent as price increased. Though often dictated by region where grapes are grown and other factors, surveying customers on the wines they consume can, at least in part, help wineries streamline or expand their product line.
Wine retailers, including tasting rooms, should survey consumers to determine how many of each of the segments they serve in order to properly market their products. “Super core” members not only drank wine more frequently that the other two segments, they were also more likely to drink the other types of alcohol presented and at a greater frequency, ie, “at least once a week” and “about once a week”, than “marginal” drinkers who consume beer, distilled spirits, and ready-to-drink cocktails. Implications for a winery or wine retailer might include the potential to add these beverages to their product offering or bundling these beverages to create packages (allowing for mass customization, which is used often in retail) and appropriately marketing these offerings to their customers.
Pertaining to the price at which wine is sold, it is clear that respondents classified as “super core” wine drinkers were more likely to have purchased wine priced at $30.00 and more than the other two segments. No differences existed between “super core” and “core” segments based on wine priced “$10.00 through $29.99”. It was only for wine priced “at less than $6.00” that there were no differences between the three segments, and approximately one-third of each segment had purchased wine in this price range. Even though there were no differences between segments at this price range, it was not the price range at which a majority of the wine was purchased. Except for the percentage of “marginal” wine drinkers who purchased wine priced at “$30.00 to $39.99” and “$40.00 or more”, a greater amount of all three segments purchased wine at each of the higher price points. Hence, retailers or winery tasting room managers may not need to give as much focus to wines “priced at less than $6.00” compared with higher priced wines, as 91.9% of “super core”, 87.2% of “core”, and 78.3% of “marginal” wine drinkers reported purchasing wine priced at “$10.00 to $13.99.” Even though there were significant differences within this price range, it was the range in which the greatest percentage of wine was reportedly purchased.
It is readily apparent that certain changes to the “standard” wine bottle presented did not appeal to a majority of respondents. The one change that did appeal to the highest percentage of respondents in each of the three segments was a “fewer than 80 calories per 5 oz serving”. These significant differences between usage rate segments also existed between the sexes and age generations. Female “super core” consumers in the millennial generation (aged 21–34 years) reported significantly greater increases in wine consumption in this case.
Other changes did appeal to at least one-third of respondents in each segment, including reducing calories per serving, a more customized cause marketing program, wine produced in certain ways, or grapes grown under certain production conditions. As there is some interest in these proposed changes, and there are differences between the three segments, further investigation is warranted. For example, although a greater percentage of “super core” wine drinkers indicated that their purchases would increase if a “portion of proceedings of the bottle was donated to a cause they care about”, there were no differences between the three groups, and the percentages were between 40% and 44% if a “portion of proceedings of the bottle was donated to a cause the participant cares about”. With at least one brand using mass customization in their cause marketing efforts as a point of differentiation, http://www.onehopewine.com, and the potential for other to adopt this strategy, the rationale behind such response rates could be further explored.
Additionally, with several brands focusing on lower alcohol content and/or lower calorie content than the “standard” wine bottle, why, again, is there such as low response rate among the wine drinkers who participated in this study? What, if anything, could encourage these wine drinkers to have an interest in such an offering? Further investigation should include asking respondents if they, in fact, do already purchase such wines and their attitudes toward and likelihood of future purchases. Although low percentages of respondents found changes such as container material appealing, consumer interest may change and the appeal should be studied again in the future.
Of the significant differences based on demographics, it is encouraging that over half of the respondents in each segment reside in a household with one other adult wine drinker. Future studies should investigate the influence that these other wine drinkers have on purchases and wine consumption and if this influence differs based on wine consumption segment. Additionally, metropolitan area of residence could further be investigated along with how this might influence wine consumption.
Segmentation studies conducted or validated 3–4 years ago may not be appropriate today. We therefore recommend periodic revalidation of the segments from our baseline study to check their stability, size, and consistency of response to variations in the marketing mix.
Disclosure
The authors report no conflicts of interest in this work.
References
Berni P, Begalli D, Capitello R. An occasion-based segmentation approach to the wine market in Denmark. Journal of International Food and Agribusiness Marketing. 2005;17:117–145. | |
Ahmad R. Benefit segmentation: a potentially useful technique of segmenting and targeting older consumers. Int J Market Res. 2003;45:373–388. | |
Wedel M, Kamakura WA. Market Segmentation: Conceptual and Methodological Foundations. 2nd ed. Boston, MA, USA: Kluwer Academic Publishers; 2000. | |
Bruwer J, Li E, Reid M. Segmentation of the Australian wine market using a wine-related lifestyle approach. J Wine Res. 2002;13:217–242. | |
Oppedijk van Veen WM, Verhallen TMM. Vacation market segmentation: a domain-specific value approach. Ann Tourism Res. 1986;13:37–58. | |
Dibb S, Stern P, Wensley R. Marketing knowledge and the value of segmentation. Marketing Intelligence and Planning. 2002;20:113–119. | |
Andrews RL, Currim IS. Recovering and profiling the true segmentation structure in markets: an empirical investigation. Int J Market Res. 2003;20:177–192. | |
Firat AF, Shultz CJ. From segmentation to fragmentation: markets and marketing strategy in the postmodern era. Eur J Mark. 1997;31:183–207. | |
Euromonitor International. Wine in the US. Passport Report, 2014. Available from: http://www.euromonitor.com/wine-in-the-us/report. Accessed March 29, 2015. | |
Harris Interactive. Americans in tea party towns – past (Boston) and present (DC): most likely to drink alcohol at least once a week, 2013. Available from: http://www.harrisinteractive.com/vault/Harris%20Poll%2074%20-%20MMQ%20Beer,%20Wine%20&%20Spirits_10.24.13.pdf. Accessed August 24, 2014. | |
Higgins KT. Generational marketing. Marketing Management. 1998;7:1–6. | |
Wines and Vines. 2013 Directory/Buyer’s Guide. San Rafael, CA, USA: Wines and Vines; 2013. | |
Montgomery IK, Bruwer J. Domain-specific consumer involvement in the US wine market. J Food Prod Market. 2013;19:439–462. | |
Wine Market Council. The US wine market: consumer trends and analysis 2013. Available from: http://winemarketcouncil.com/research/. Accessed August 12, 2014. | |
Cahill DJ. Target marketing and segmentation: valid and useful tools for marketing. Management Decision. 1997;35:10–13. | |
Kotler P, Keller KL. Marketing Management. 14th ed. London, UK: Pearson Education Limited; 2012. | |
Van Raaij WF, Verhallen TMM. Domain-specific market segmentation. Eur J Mark. 1994;28:49–66. | |
Bock T, Uncles M. A taxonomy of differences between consumers for market segmentation. Int J Market Res. 2002;19:215–224. | |
Geraghty S, Torres AM. The Irish wine market: a market segmentation study. International Journal of Wine Business Research. 2009;21:143–154. | |
Orth UR, McDaniel M, Shellhammer T, Lopetcharat K. Promoting brand benefits: the role of consumer psychographics and lifestyle. J Consum Mark. 2004;21:97–108. | |
Bruwer J, Li E. Wine-related lifestyle (WRL) market segmentation: demographic and behavioral factors. J Wine Res. 2007;1:19–34. | |
Armstrong G, Kotler P. Marketing: An Introduction. 7th ed. Upper Saddle River, NJ, USA: Prentice Hall; 2005. | |
Gunter B, Furnham A. Consumer Profiles: An Introduction to Psychographics. London, UK: Routledge; 1992. | |
Bruwer J, Burrows N, Chaumont S, Li E, Saliba AJ. Consumer involvement and associated behavior in the UK high-end retail off-trade wine market. Int Rev Retail Distrib Consum Res. 2014;24:45–165. | |
Bruwer J, Saliba AJ, Miller B. Consumer behavior and sensory preference differences: implications for wine product marketing. J Consum Mark. 2011;28:5–18. | |
Atkin T, Nowak L, Garcia R. Women wine consumers: Information search and retailing implications. International Journal of Wine Business Research. 2007;19:327–339. | |
Bruwer J, Jiranek V, Halstead L, Saliba AJ. Lower alcohol wines in the UK market: some baseline consumer behavior metrics. Br Food J. 2014;116:1143–1161. | |
Bruwer J. The love affair of Generation-X consumers with the winery tasting room. Australian and New Zealand Grapegrower and Winemaker. 2004;491:19–24. | |
Bruwer J. The importance and role of the winery tasting room in the Australian wine industry: some perspectives. Australian and New Zealand Grapegrower and Winemaker. 2002;463:6–99. | |
Murphy HL. Xers vintage point. Marketing News. 1999;33:1–2. | |
Bruwer J, Fong M, Saliba AJ. Perceived risk, risk-reduction strategies (RRS) and consumption occasions: roles in the wine consumer’s purchase decision. Asia Pac J Market Logist. 2013;25:369–390. | |
Wine Intelligence. UK wine market landscape report. Wine Intelligence. London. 2010:1–126. | |
Lockshin L, Jarvis W, d’Hauteville F, Perrouty J-P. Using simulations from discrete choice experiments to measure consumer sensitivity to brand, region, price, and awards in wine choice. Food Qual Prefer. 2006;17:166–178. | |
de Mello L, Gonçalves RP. Message on a bottle: Colours and shapes in wine labels. Munich Personal RePEc Archive, 2008. Available from: http://mpra.ub.uni-muenchen.de/13122/. Accessed August 24, 2014. |
 © 2015 The Author(s). This work is published and licensed by Dove Medical Press Limited. The
full terms of this license are available at https://www.dovepress.com/terms
and incorporate the Creative Commons Attribution
- Non Commercial (unported, 3.0) License.
By accessing the work you hereby accept the Terms. Non-commercial uses of the work are permitted
without any further permission from Dove Medical Press Limited, provided the work is properly
attributed. For permission for commercial use of this work, please see paragraphs 4.2 and 5 of our Terms.
© 2015 The Author(s). This work is published and licensed by Dove Medical Press Limited. The
full terms of this license are available at https://www.dovepress.com/terms
and incorporate the Creative Commons Attribution
- Non Commercial (unported, 3.0) License.
By accessing the work you hereby accept the Terms. Non-commercial uses of the work are permitted
without any further permission from Dove Medical Press Limited, provided the work is properly
attributed. For permission for commercial use of this work, please see paragraphs 4.2 and 5 of our Terms.