Back to Archived Journals » Reports in Medical Imaging » Volume 7
Update on non-invasive imaging for congenital heart disease: an additional dimension
Authors Weigand J, Chelliah A, Lai W
Received 2 June 2014
Accepted for publication 29 July 2014
Published 2 December 2014 Volume 2014:7 Pages 95—107
DOI https://doi.org/10.2147/RMI.S45314
Checked for plagiarism Yes
Review by Single anonymous peer review
Peer reviewer comments 3
Editor who approved publication: Professor Tarik Massoud
Justin D Weigand, Anjali Chelliah, Wyman W Lai
Division of Pediatric Cardiology, Columbia University Medical Center, New York, NY, USA
Abstract: In the past three decades, technical advances in cardiovascular imaging have created a better balance in the requisite trade-off between spatial versus temporal resolution that is inherent to all dynamic imaging modalities. This update focuses on two techniques in which the advances in computer and engineering technologies have allowed for an additional dimension of imaging for patients with congenital heart disease (CHD). The development of matrix array probes has propelled three-dimensional (3D) echocardiography into a routinely available tool for the assessment of valvular dysfunction, structural abnormalities, and ventricular size and function. Recent advances in time-resolved 3D velocity mapping, widely known as four-dimensional flow cardiac magnetic resonance, have significantly improved our ability to assess the hemodynamic abnormalities associated with CHD. These advances have allowed for significantly increased amounts of data to be collected, with further improvements expected. Their current applications in patients with CHD are reviewed. Future studies will help to define the roles of these advanced technologies in routine clinical care.
Keywords: cardiac magnetic resonance, congenital heart disease, echocardiography, four-dimensional flow, three-dimensional echocardiography
Introduction
In the past three decades, technical advances in cardiovascular imaging have created a better balance in the requisite trade-off between spatial versus temporal resolution that is inherent to all dynamic imaging modalities. This update focuses on two techniques in which the advances in computer and engineering technologies have allowed for an additional dimension of imaging for patients with congenital heart disease (CHD). The development of matrix array probes has propelled three-dimensional (3D) echocardiography into a routinely available tool for the assessment of valvular dysfunction, structural abnormalities, and ventricular size and function. Recent advances in time-resolved 3D velocity mapping, widely known as four-dimensional (4D) flow cardiac magnetic resonance (CMR), have significantly improved our ability to assess the hemodynamic abnormalities associated with CHD.
Three-dimensional echocardiography
The advent of sophisticated matrix array probes whose designs consist of thousands of piezoelectric elements, along with updates in software have made possible the acquisition of pyramidal volumes at sufficiently high rates for the capture of cardiac structures in motion. When created in real time, these pyramidal volumes are limited by either a relatively small volume size or a lower frame rate. By acquiring multiple pyramids over consecutive heartbeats and “stitching” these single-beat volumes together, one can enlarge the 3D dataset to encompass larger structures with improved temporal resolution. More recently, 3D matrix probes have evolved to incorporate real-time 3D color into the images. With these advances, 3D echocardiography has become both relatively user-friendly and more clinically sophisticated, making it practical for widespread clinical use.
Modes of 3D image acquisition
The same principles of image acquisition that guide two-dimensional (2D) imaging also govern the acquisition, and optimization, of 3D images. The interrogating ultrasound beam should optimally be aligned perpendicular to the object of interest. The anatomy of interest should be centered within the sector width, taking care not to foreshorten or cut off structures under investigation. Gain and compression settings are generally set in middle range. Once an optimized 2D image has been obtained, the added element of elevation width completes the 3D image.
Listed are four established modes of 3D echocardiography. Each mode has characteristics that may be advantageous for answering specific clinical questions (Table 1).
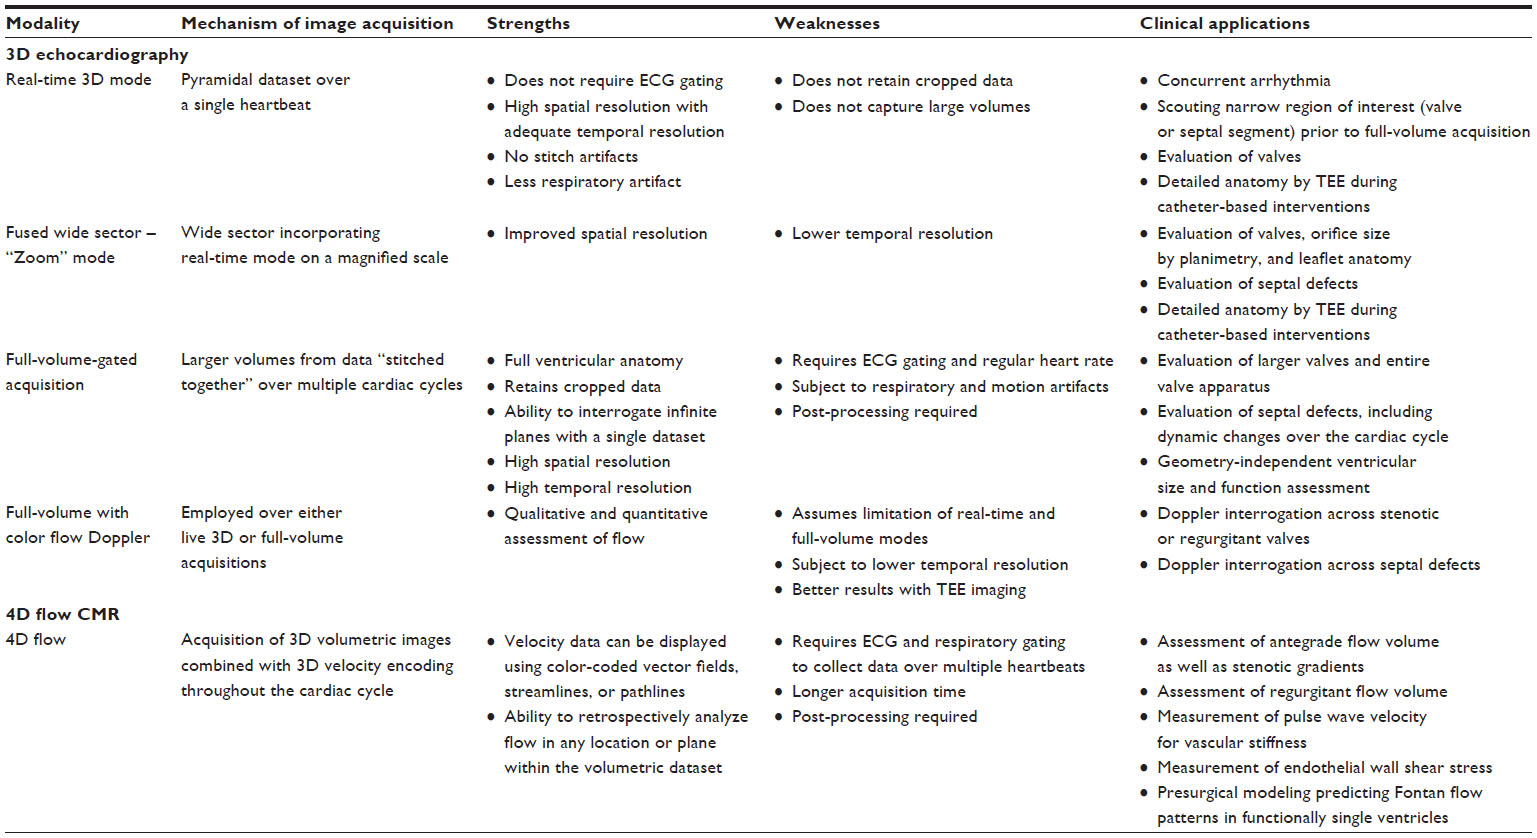 | Table 1 Imaging modality strengths, weaknesses, and clinical applications |
Real-time 3D mode
This mode acquires pyramidal datasets over a single heartbeat. Since real time, live images are acquired over narrow sector fields, they have more scan lines per volume, that is, they provide a higher spatial resolution with acceptable temporal resolution. This mode is often used in focused examinations of a specific valve or region of septum as a scout mode, ensuring the anatomy of interest has been properly localized in the dataset before committing to “Zoom” or full-volume acquisitions. This narrow dataset does not retain the information cropped out of the picture, in contrast to the abilities of full-volume mode. However, its advantages include the ability to image patients with rhythm disturbances and the freedom from stitch artifacts caused by respiration or patient movement.
Fused wide sector – Zoom
This is a live, wide sector mode used for focused imaging of specific cardiac structures. It incorporates the properties of live mode but on a magnified scale. It can therefore provide greater resolution of the structure of interest and is mainly employed to evaluate cardiac valves or septal defects. The trade-off, however, for the magnification of a region of interest is lower temporal resolution and lower line density. When utilized on a transesophageal probe, the 3D Zoom mode provides live anatomic details that are useful in catheter-based interventions.
Full-volume-gated acquisition
This full-volume mode is an amalgamation of narrow data volumes acquired over consecutive, electrocardiography (ECG)-gated beats (typically four cardiac cycles). The software then stitches these volumes together to produce larger cardiac volumes, ideal for capturing the totality of a ventricle. The requisite 2D images are obtained in classic views but these larger, more complete volume sets need to be subsequently processed. The most commonly used technique for processing is called multi-planar reformatting (MPR). This processing technique allows the user to work in three orthogonal planes (coronal, sagittal, and transverse) to strip away (or crop) unwanted information in the dataset and focus on the anatomy of interest. The stripped away data are not lost, and infinite other planes may be interrogated from the same acquired dataset. For example, one can move closer to the ventricular septum and eliminate the unwanted mitral valve (MV) data. Similarly, the planes can be cut to unearth the MV and the valve can be viewed from any direction, including the clinically useful en face views. By acquiring large volumes of data over multiple beats and slicing through it, the MPR processing technique also serves to somewhat circumvent the limited resolution of a live, single beat 3D clip. However, since this mode relies upon ECG gating, abnormal rhythms and patient motion will result in an artifact known as “stitch artifact.” Yet, full-volume acquisition has remained the workhorse of evaluating pediatric CHD because of its maximized spatial and temporal resolution.
Full volume with color flow Doppler
3D color Doppler can be employed over either live 3D or full-volume echocardiography. It thereby shares the limitations of these modes. It is generally agreed that 3D transesophageal imaging provides better 3D color Doppler quality and thereby color flow analysis. Such color flow is measured across valves, as in areas of stenosis or regurgitation, and across septal defects. Long and short axis views of regurgitant jets provide information on the degree and mechanism of regurgitation. Smaller interrogation fields and lower frame rates have traditionally limited color flow 3D images. However, newer 3D systems have features that capture color flow at higher frame rates, improving the resolution of 3D images with overlying color.
Clinical applications of 3D echocardiography in pediatric and CHD
3D echocardiography has become a reliable tool for evaluating valvular morphology and function; septal morphology; ventricular volumes and function; and specific CHD lesions. It is now used routinely to aid in transcatheter or surgical procedures. However, it has yet to supplant 2D echocardiography as a method for obtaining a complete study. That is, imaging exclusively with 3D has yet to become common practice, though with emerging technology in large-volume 3D data acquisition, this may be on the horizon.
In 2012, the European Association of Echocardiography and American Society of Echocardiography published comprehensive recommendations for 3D image acquisition.1 Further recommendations were made on how to best crop the acquired data to obtain the most useful clinical information for the cardiologist and surgeon. Although published for adults, the most commonly utilized views for specific anatomy are also applicable to the pediatric population. The application of these views and the updated role of 3D echocardiography in CHD are discussed below.
MV assessment
MV anatomy and pathology have been among the most studied applications of 3D echocardiography. 3D imaging of the MV begins from the apical four-chamber and parasternal long view. Most often, Zoom mode is employed to detail leaflet anatomy while full-volume mode is used to capture the entire MV apparatus.1 The “en face” view has proven very valuable and can be viewed from both the left ventricular and left atrial (or surgeon’s view) perspective (Figure 1). From this view, planimetry of the MV has been shown to be efficiently achievable. New standards in display of the en face view show the anterior MV leaflet forming the floor of the left ventricular outflow tract at the top of the image.1
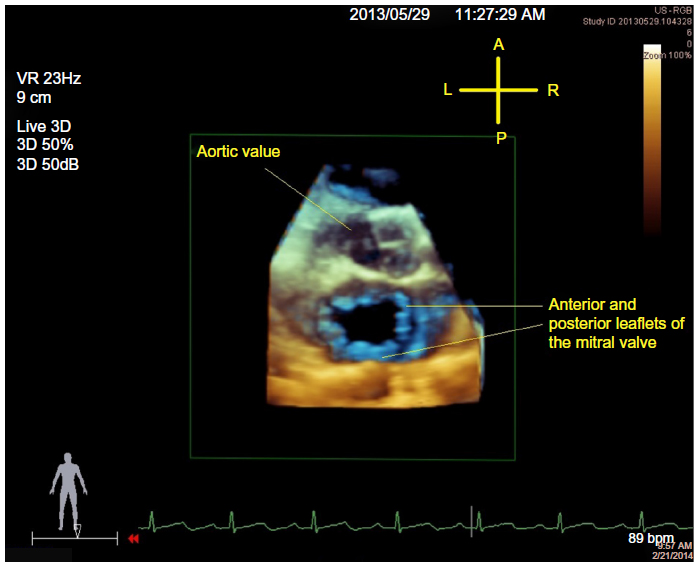 | Figure 1 View of the MV in ventricular diastole from the left atrium, or the so-called surgeon’s view. |
The use of 3D echocardiography to assess MV stenosis has been well studied in the context of adult rheumatic fever. Employing 3D planimetry to obtain effective mitral valve area (MVA) has been validated against established 2D methods.2 MVA measured in real-time 3D echocardiography had correlated well with pressure half-time in adults with rheumatic MV disease.3 Furthermore, 3D measurements of MVA have been shown to be the most accurate of the echocardiography-derived area measurements when compared with transcatheter, equation-based gold standards.4 Obtaining an en face view from the left ventricle, one can visualize the effective MV orifice in mitral stenosis. Anwar et al utilized this view to better assess MV morphology and the effective MVA to establish a mitral stenosis scoring system that accurately prognosticated response to intervention on the MV.5 Quantification of congenital MV stenosis in children has long relied upon mean MV gradients by continuous-wave Doppler and pressure half-time measurement in older children. MVA quantification by 3D echocardiography in children has yet to be validated against these standards. The differences between acquired rheumatic or calcified MV disease and congenital MV stenosis are obvious.6 Congenital mitral stenosis more often involves the subvalvular apparatus and multiple eccentric jets. This makes MVA quantification and 3D color flow Doppler assessment more difficult. However, for these same reasons, 3D echocardiography benefits the understanding of mitral stenosis due to a parachute MV. The subvalvular anatomy is well delineated, as is the often-eccentric MV orifice.6
For the assessment of mitral regurgitation, cropped full-volume datasets constructed from the apical and parasternal long views provide superior anatomic details of origin, size, and direction of the regurgitant jet. Indeed, use of 3D echocardiography has proven better in the detection of multiple regurgitant jets. These views may also help to differentiate tethered chordae versus a dilated left ventricle as a cause of poor coaptation. Application of 3D color Doppler has produced detailed images of the vena contracta of the regurgitant jet, while planimetry of the vena contracta acts as a surrogate for size of the regurgitant orifice. Quantification of the vena contracta as a marker for severity of mitral regurgitation has been explored in adults7 but studies in children are lacking. Real-time 3D quantification of MV flow rate and volume has been examined in healthy children8,9 and burgeoning investigation into determining mitral regurgitant fraction is underway.
Use of both 3D Zoom and full-volume datasets with MPR processing has proven useful in evaluating mitral valve prolapse (MVP). Adult studies have established the accuracy of 3D in assessing MVP as on par with transesophageal echocardiography, widely considered the gold standard in adults.10 The en face view can display prolapsing segments from either the left ventricular or left atrial projection. Similarly, dissection of tissue above and below the MV annulus on the horizontal plane allows detection of even mild MVP. Quantification of degree of prolapse using 3D echocardiography has been accomplished through transesophageal probes and while its superiority has been shown in adults,11 few studies have focused on MVP in children.
Tricuspid valve assessment
The advantage of 3D echocardiography of the tricuspid valve is visualization of all three leaflets simultaneously throughout the cardiac cycle.12 This is possible using apical, parasternal, or subxiphoid views to capture the tricuspid valve annulus. Similar to the MV, 3D echocardiography allows interrogation of the whole tricuspid valve apparatus. Appreciation of tricuspid valve components in space, that is, relationship of chordae to ventricular septal defects (VSDs), has proven valuable for surgical planning. The en face view of the tricuspid valve is visualized from either the right ventricle or right atrium, and standards for display place the septal leaflet at the 6 o’clock position.1
Clinically, 3D echocardiography provides precise definition of the anatomy of Ebstein anomaly of the tricuspid valve. Full-volume datasets and subsequent cropping show the hallmark rotation of the valve orifice toward the right ventricular outflow tract. This rotational aspect of the orifice and the apical displacement of the septal and posterior leaflets are key to differentiating Ebstein anomaly from tricuspid valve dysplasia.13,14 The hinge points of the poorly delaminated septal and posterior leaflets and coaptation failure are well demarcated when full-volume datasets are processed for these purposes.
Atrial and VSDs
Routine transcatheter closure of atrial septal defects (ASDs) has placed added importance on defining ASD morphology. 3D transthoracic echocardiography provides an en face view of the atrial septum that can be visualized from the perspective of the right or left atrium (Figure 2). Subxiphoid and apical views provide the dataset that both localizes and sizes the defect. Real-time 3D transthoracic echocardiography better characterizes the contour of the ASD than 2D echocardiography in both children and adults undergoing evaluation for ASD closure.15 Size and rim dimensions as measured by 3D echocardiography also correlate well with standard 2D transesophageal echocardiography (TEE) and surgical measurements. Furthermore, the proximity of the defect to local cardiac structures (coronary sinus, tricuspid valve, superior vena cava, and inferior vena cava) can be seen with the added dimension of depth, which addresses concerns of encroachment on these structures by closure device. Full-volume datasets display the dynamic changes in the ASD size and shape that occur through the cardiac cycle.
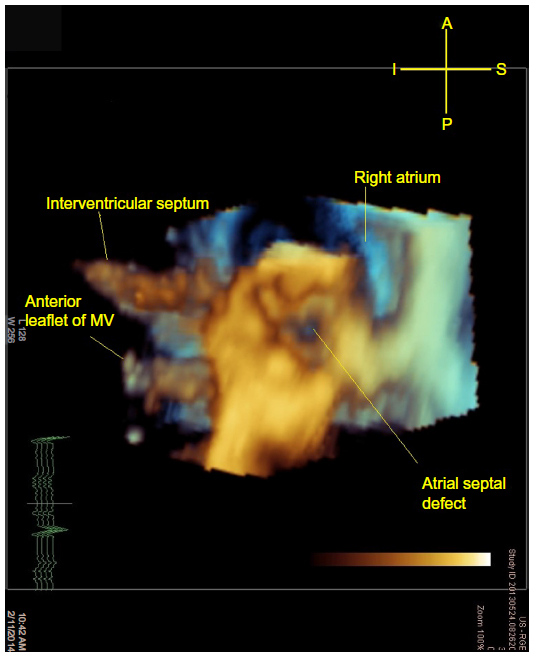 | Figure 2 A 3D image cropped from a full-volume dataset of a secundum ASD as viewed from the left atrium. |
Real-time 3D transesophageal echocardiography has been generally limited by probe size to patients over 20–25 kg. Guidance of transcatheter ASD device closure has been documented in adults and has proven very effective in sizing and shaping of secundum ASDs.16 Procedural real-time 3D transesophageal echocardiography also allows visualization of the device placement, deployment, and proper positioning of the device (Figure 3). Application of this technique to pediatric transcatheter ASD device closure is currently underway and may guide device closure candidacy as well as closure device selection the near future. Additionally, real-time 3D transesophageal echocardiography of the atria may provide valuable topographical information during electrophysiology studies.
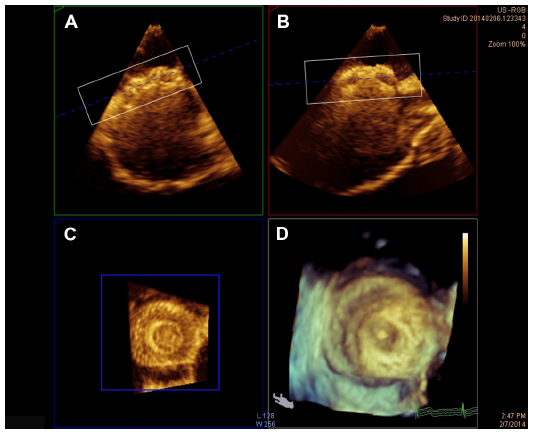 | Figure 3 Demonstration of 3D image cropping to achieve optimal right atrial view of a 13 mm Amplatzer septal occluder device as obtained by intra-procedural 3D transesophageal echocardiography. Orthogonal axial (A), sagittal (B), and coronal (C) oblique views are shown along with the 3D image (D). |
As with ASDs, 3D echocardiography provides detailed views of VSD size and shape, as well as the dynamic changes in both throughout the cardiac cycle. Apical, parasternal, and subxiphoid views are generally suitable for obtaining the en face view in live 3D or full-volume datasets. Such renderings provide a superior understanding of the spatial relationship of the VSD to atrioventricular or semilunar valves. Obscuring valvular tissue, such as tricuspid valve chordae, can be cropped away to better expose the VSD or kept to demonstrate to the surgeon what may be encountered intraoperatively en route to VSD repair. Real-time 3D echocardiography has performed with good fidelity in describing defect location and geometry when held against the standard of intraoperative observation.17 VSD sizing has been shown to be more accurate using 3D echocardiography when compared with 2D echocardiography.17
Complete atrioventricular canal defect
The value of 3D echocardiography in the evaluation of complete atrioventricular canal defects (CAVC), also known as complete atrioventricular septal defects, has perhaps been the most documented. Full-volume datasets obtained from apical four-chamber and subxiphoid views can be manipulated to reveal an unparalleled en face view of the common atrioventricular valve.12 Hlavacek et al demonstrated the utility of 3D echocardiography in CAVC pre-repair planning and post-repair evaluation of residual shunts.18 3D echocardiography proved distinctly useful for characterizing the bridging leaflets, the left-sided atrioventricular valve cleft regurgitation, and presence of left ventricular outflow tract obstruction. In cases of unbalanced CAVC, 3D echocardiography also proved useful in deciding for or against biventricular repair based on its ability to better evaluate chordal attachments and approximate ventricular cavity sizes. Barrea et al used 3D echocardiography to evaluate residual left-sided atrioventricular valve regurgitation in patients who underwent patch augmentation of this valve during CAVC repair.19 They concluded that 3D echocardiography was superior to 2D echocardiography in ascertaining the mechanism of leaflet failure and best correlated with the intraoperative determination of leaflet failure. Kutty et al described such distinct advantages of 3D echocardiography in evaluating CAVC that they suggest it supplants its 2D predecessor in the preoperative planning for this lesion.20 Transthoracic 3D echocardiography proves superior in detailing location and mechanism of atrioventricular valve regurgitation in motion, even when compared to the less physiologic intraoperative 2D transesophageal images. Most recently, Takahashi et al have used full-volume datasets acquired at high frames to investigate the anatomical intricacies of the repaired left-sided atrioventricular valve. By tagging anatomic landmarks in space within their 3D images, they developed a model of repaired left-sided atrioventricular valves and compared them with normal controls. Factors independently associated with increased left-sided atrioventricular valve regurgitation after CAVC repair included a larger prolapsed volume, larger annular area, and more counterclockwise rotation of the posteromedial papillary muscle.21
Ventricular volume, mass, and function
3D echocardiography possesses many advantages over 2D echocardiography in the assessment of left ventricular volume and function. In patients with CHD, the presence of chronic volume or pressure overload may distort the geometry of one or both ventricles, rendering traditional 2D methods of analysis rife with potential error. The use of 3D echocardiography in the assessment of left ventricular volume and ejection fraction has been well validated in healthy children as well as those with CHD, including the single ventricle population. Using full-volume datasets from the apical view and manual offline processing, Bu et al established that 3D echocardiographic measurement of left ventricular volumes, mass, and ejection fraction correlated well with CMR in children.22 Newer technology is making rapid assessment of these left ventricular parameters feasible and reliable. Shibayma et al have recently shown that full-volume datasets acquired from a single cardiac cycle and automated left ventricular volume measurement provided more accurate measurements of volume and function than 2D echocardiography and correlated well with CMR. Additionally, these data were obtained efficiently at the bedside, with a mean operation time of 6 minutes, making such assessment of left ventricular volume clinically applicable.23
This fidelity has been tested within the CHD population. van den Bosch et al demonstrated the viability of real-time 3D echocardiography in assessing left ventricular volumes and ejection fraction in the context of unconventional left ventricles in adults with CHD.24 Rhiele et al used both manual and semi-automated border detection in their 3D measurements, both of which produced left ventricular volumes that correlated well with CMR.25 Friedberg et al demonstrated that 3D echocardiography measurements of left ventricular volumes and mass correlated well with CMR in neonates and infants with CHD or small left ventricles, including patients with hypoplastic left heart syndrome.26 Ejection fraction was underestimated by 3D echocardiography when compared with CMR in this population.
Given its independence from left ventricular geometry, 3D echocardiography seemed ideal for evaluating the single ventricle. In the early era of 3D echocardiography, Altman et al were among the first to compare the assessment of ventricular volume, mass, and function with CMR in the single ventricle population.27 In patients with functionally single left ventricles 3D echocardiographic values correlated well with CMR, more closely than did 2D echocardiography. Soriano et al later corroborated the accuracy of 3D in determining single ventricular volumes and mass, though ejection fraction was less well correlated.28
3D transthoracic and transesophageal echocardiography is now widely considered superior to 2D echocardiography for reliable and reproducible assessment of left ventricular volume and mass. Ejection fraction measurements have been less strongly correlated to those from CMR, though 3D echocardiography is believed to produce more accurate ejection fraction values than traditional 2D methods. It is reasonable to say that this extends to patients with CHD. Newer technology, including probes with higher frequency capability, and single beat volume acquisition may make use in neonates and infants even more accurate.
Finally, 3D speckle tracking for the evaluation of left ventricular strain has demonstrated advantages over 2D speckle tracking. Speckles can be tracked through 3D volumes of data in through-planes, where they are often lost in 2D speckle tracking. 3D strain measurements are providing new insights into age-related shifts in deformation patterns. Kaku et al not only established good correlation for left ventricular strain between 3D speckle tracking and CMR but also established reference ranges for segmental global, longitudinal, circumferential, and radial strains. In doing so, they found that there exists a normal maturational change in deformation characteristics.29 Global longitudinal strain decreases with age while circumferential and radial strains remain relatively constant. Torsion, or the base to apex gradient of rotation along the long axis of the left ventricle, changes with age. The gradient increases as children age, with significantly less basal rotation and more apical rotation. Zhang et al also found 3D speckle tracking to be a reliable tool for measuring segmental and global strain in healthy children. However, this group identified a peak in longitudinal and circumferential strain in early adolescence before reaching a nadir similar to the aforementioned study in late adolescence. Radial and global strains remained constant throughout maturation.30
New applications for 3D echocardiography are making their way into clinical practice. These include use of 3D echocardiography to obtain near instantaneous volumes, which when combined with transcatheter pressure measurements are being used to establish pressure–volume curves for an individual ventricle. These virtual thumbprints of a patient’s pressure–volume curve provide invaluable assessment of individual patient cardiac function and have been employed in neonates and children with CHD.31 Work is ongoing to refine 3D echocardiographic evaluation of right ventricular parameters, a potentially extremely useful application to CHD such as tetralogy of Fallot. A desire to increase the temporal resolution of 3D echocardiography has led to fast frame-rate techniques of image processing.32 This technique utilizes 3D volume sets and reorders images obtained over several cardiac cycles based on their relation to the QRS complex to give more detailed pictures of fine movements of the structure in question. With respect to valvular disease, this allows more accurate examination of valve opening and coaptation. Exquisite detail of valve motion is achieved and advancements in processing software will make this method of valve examination more clinically efficient.
In addition to CHD, 3D strain technology has great applicability with acquired heart disease. Early application in obese children demonstrates significant differences in left ventricular volumes and deformation indices, shedding light on how obesity may trigger the heart to deform differently.33 These subtleties of deformational changes may serve as harbingers for future global left ventricular dysfunction. Early, pre-clinical detection by 3D echocardiography has promising clinical applicability not only for the study of obesity but also of cardiomyopathies, muscular dystrophies, as well as in transplanted hearts. Work still needs to be done in establishing uniformity in 3D speckle tracking across different vendors.34
Four-dimensional flow cardiac magnetic resonance imaging
Cardiac magnetic resonance imaging has become a routine imaging tool that complements the use of echocardiography to evaluate cardiac anatomy, function, and hemodynamics in patients with CHD. Four-dimensional flow CMR is a more recent development that has allowed us to visualize and quantify complex multi-dimensional patterns of blood flow within the heart, great arteries, and veins. Early reports have demonstrated the potential of this non-invasive method to significantly expand our understanding of normal vascular hemodynamics and their alterations in the setting of cardiovascular disease (Table 1).
2D through-plane phase contrast imaging, the traditional method of evaluating blood flow by CMR, evaluates flow in a single direction through a user-defined plane across a valve or vessel. However, global and regional patterns of intracardiac blood flow are complex and occur in three dimensions. The acquisition of 4D flow CMR data involves acquiring 3D volumetric images of the heart or vascular structures and combining them with 3D velocity encoding that is obtained over time throughout the cardiac cycle.35 Blood flow velocity is acquired for each voxel of the 3D heart or vascular volume by consecutively encoding x, y, and z vector components during a single sequence acquisition. Electrocardiographic and respiratory gating are utilized in order to collect data over multiple heartbeats and represent the resulting flow data as a single cardiac cycle with minimal motion artifact.36 A large quantity of data are therefore obtained during this sequence; however, technologic developments such as high-performance gradients, parallel processing, and other accelerated imaging approaches have reduced acquisition time to less than 10–15 minutes.36,37 Multiple sources of error, such as eddy current effects and velocity aliasing, similar to that seen in echocardiography, can also affect data accuracy. Thus, post-processing must be performed to adjust for these effects prior to quantitative analysis.
Once processed, 4D flow datasets can be visualized as a 3D angiographic representation of the heart with a superimposed velocity vector field depicting blood flow. Velocity data can be displayed using 2D color-coded graphic vector fields representing the magnitude and direction of each voxel’s velocity (Figure 4A). Streamlines (Figure 4B) can be used to demonstrate instantaneous flow trajectories across the entire volume at a specific time in the cardiac cycle. Pathlines (Figure 4C), true 4D images that display the spatial trajectory of defined particles followed over time, are most commonly used to visualize the flow patterns and color-coded velocities of blood throughout the cardiac cycle.36,38–40
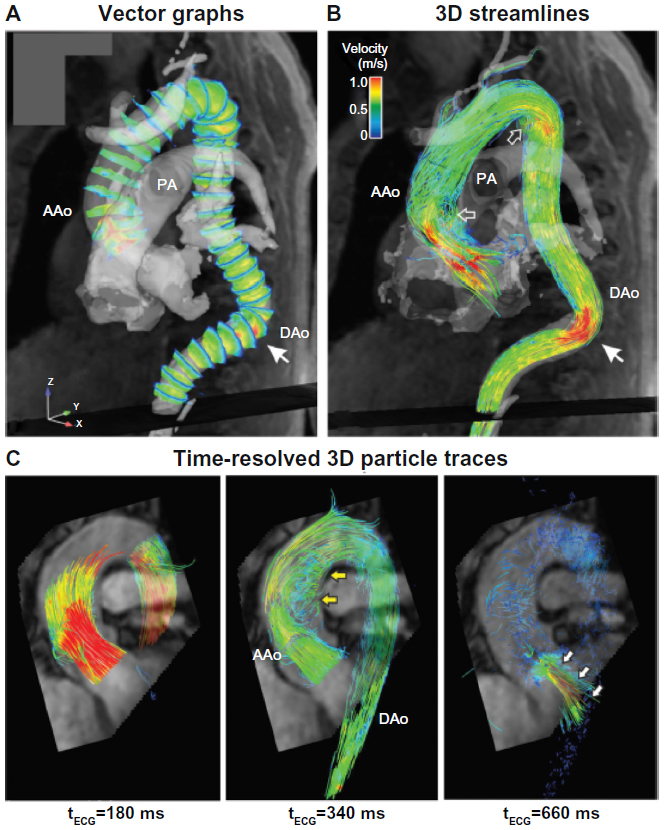 | Figure 4 Three-dimensional blood flow visualization in the thoracic aorta. |
In addition to qualitative data, a number of quantitative hemodynamic parameters can be calculated throughout the heart and cardiac vasculature. Unlike 2D phase contrast imaging, in which each flow plane of interest must be predefined by the user and obtained in multiple acquisitions, any location or plane within the volumetric dataset can be retrospectively analyzed. Additional flow parameters including pulse wave velocity (a measure of vascular stiffness), wall shear stress on endothelium, and pressure gradient measurements, can also be derived in order to non-invasively characterize cardiovascular dynamics.35,41–44
Clinical applications of 4D flow CMR in CHD
Four-dimensional flow CMR has proved particularly useful in studying the hemodynamics of congenital heart lesions and demonstrating complex blood flow patterns in unrepaired, progressive, and palliated disease states. Valverde et al found that acquiring a single 4D flow dataset, while time-consuming, is faster than performing multiple 2D phase contrast image acquisitions to assess flow complex congenital heart lesions.45 A vast array of congenital and acquired pathologies have been evaluated using 4D flow; this discussion will focus on a few defects more commonly encountered in the pediatric population.
Tetralogy of Fallot
Cardiac CMR is considered the clinical standard to evaluate anatomy and function following the repair of tetralogy of Fallot. It is essential to accurately assess pulmonary stenosis and regurgitation as well as relative blood flow to the left and right pulmonary arteries when evaluating the surgical repair. Four-dimensional flow measurements of pulmonary regurgitant fraction have been demonstrated to not only correlate closely with 2D phase contrast measurements but to also correlate more closely than 2D phase contrast with forward and reverse stroke volumes as measured on cine CMR images.46 Other studies have demonstrated abnormal flow patterns in patients with repaired tetralogy of Fallot (TOF), even those without residual pulmonary stenosis. Geiger et al demonstrated disproportionately increased right pulmonary artery flow and increased systolic velocity in the main pulmonary artery even in patients without significant residual obstruction.47 François et al also found differences in peak main pulmonary artery flow, resistance, and wall stress in repaired TOF patients relative to normal controls.48 Both studies found large, inefficient flow vortices throughout the right heart and pulmonary arteries on qualitative pathline maps (Figure 5).
 | Figure 5 A 9-year-old male with Tetralogy of Fallot status post-Blalock-Taussig shunt and complete repair with transannular patch at 6 months of age. |
Congenital aortic disease
Blood flow patterns in aortic pathology have been long recognized to play a role in progression of disease; for example, it is known that flow alterations in the setting of a bicuspid aortic valve can lead to aortic dilation or coarctation. Flow-sensitive 4D flow CMR is an ideal method to evaluate these flow patterns in repaired and unrepaired aortic disease. Studies of ascending aortic flow in patients with a bicuspid aortic valve have identified abnormal helical flow patterns and wall shear stress in the ascending aorta even without significant aortic stenosis or dilation.49,50 A subsequent study found that different flow patterns are associated with different patterns of commissural fusion in functionally bicuspid aortic valves.51 These findings may eventually permit us to identify those at risk for aortic dilation and predict the progression of disease in bicuspid aortic valve patients before dilation is apparent. Evaluation of patients with aortic coarctation before and after repair similarly shows abnormal flow vortices throughout the aorta, not just in the region of coarctation.52 Finally, 4D flow analysis can prove particularly useful in patients with Marfan syndrome and other congenital aortopathies to help identify patients at risk of aortic aneurysm and dissection.53,54
Complex single ventricle disease
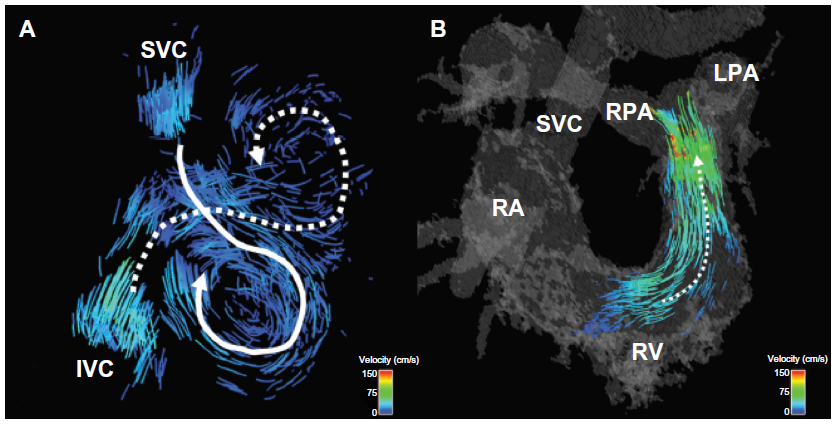
In patients with only a single functional ventricle, a multi-stage palliation is performed to harness the single ventricle to pump to the systemic circulation while directing the systemic venous return flow to the pulmonary arteries via a cavopulmonary connection, resulting in what is known as a Fontan circulation. In some cases, antegrade blood flow from the ventricle also contributes to the pulmonary circulation. The resulting hemodynamics are quite complex. While previous computational models developed to better understand single ventricle flow patterns have yielded important insights, they have required simplifying assumptions and interpolated data. The feasibility of whole-heart 4D flow CMR has been demonstrated in a comparison of flow among patients who had undergone a Fontan cavopulmonary connection with normal controls. The 4D flow measurements found that, contrary to what had been previously reported, relative superior and inferior venae caval flow distributions to the left and right pulmonary arteries varied widely and depended largely upon the degree of horizontal offset between the superior and inferior cavopulmonary anastomoses (Figure 6).55 The same group reported in a patient with double outlet right ventricle, a hypoplastic left ventricle, d-malposed great vessels, and aortic hypoplasia who had undergone a three-stage single ventricle palliation, including the Norwood procedure, to analyze time-resolved blood flow patterns as a non-invasive alternative to cardiac catheterization. Though the patient had been believed to be doing well based on echocardiographic findings, flow-sensitive 4D CMR demonstrated abnormal flow helices distal to the patient’s repaired coarctation site and significantly increased caval blood flow to the right lung relative to the left.56 A comparison of single ventricle patients who underwent two different types of Fontan palliations – lateral tunnel versus extracardiac – demonstrated large flow vortices in lateral tunnel Fontan connections compared with generally more laminar flow with some helix formation in extracardiac connections. However, differential pulmonary blood flow in extracardiac Fontans was found to be highly dependent upon the placement site of the extracardiac conduit.57 These findings have been successfully clinically applied in individual patients to permit presurgical modeling, predicting pulmonary blood flow, and thereby planning operative repair.58 Four-dimensional flow has also been used to study hemodynamics in two patients with pulmonary atresia and intact ventricular septum who had undergone a 1.5 ventricle repair, in which a Glenn anastomosis of the superior vena cava to pulmonary arteries is performed in addition to having antegrade pulmonary blood flow. Flow curves and vector field analysis showed a highly inefficient circulation in which the two sources of pulmonary blood flow often competed with each other, with superior vena caval flow being directed retrograde into the main pulmonary artery and right ventricle rather than the lung, and in which most of the pulmonary blood flow was directed toward the right pulmonary artery.59
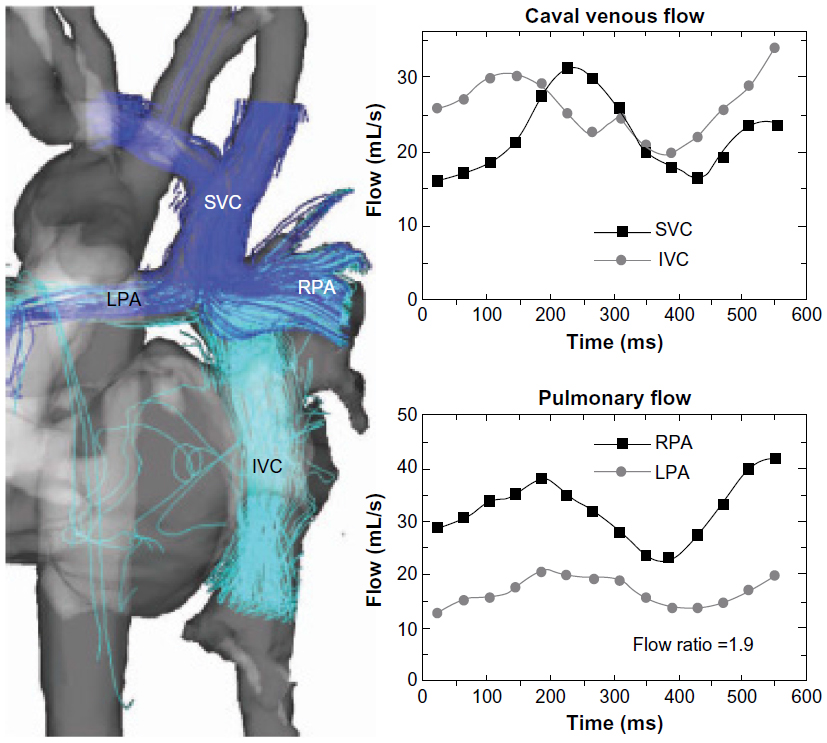 | Figure 6 Quantification and visualization of caval venous and pulmonary hemodynamics. |
Conclusion
New techniques of 3D and 4D image acquisition are now available for the assessment and management of patients with CHD. Advancements in technology have improved the balance between spatial versus temporal resolution in both 3D echocardiography and 4D flow CMR. These advances have allowed for significantly increased amounts of data to be collected, with further improvements expected. Future studies will help define the roles of these advanced technologies in routine clinical care.
Disclosure
The authors have no conflicts of interest to disclose.
References
Lang RM, Badano LP, Tsang W, et al. EAE/ASE recommendations for image acquisition and display using three-dimensional echocardiography. J Am Soc Echocardiogr. 2012;25(1):3–46. | |
Pérez de Isla L, Casanova C, Almería C, et al. Which method should be the reference method to evaluate the severity of rheumatic mitral stenosis? Gorlin’s method versus 3D-echo. Eur J Echocardiogr. 2007; 8(6):470–473. | |
Xie MX, Wang XF, Cheng TO, Wang J, Lu Q. Comparison of accuracy of mitral valve area in mitral stenosis by real-time, three-dimensional echocardiography versus two-dimensional echocardiography versus Doppler pressure half-time. Am J Cardiol. 2005;95(12):1496–1499. | |
Zamorano J, Cordeiro P, Sugeng L, et al. Real-time three-dimensional echocardiography for rheumatic mitral valve stenosis evaluation: an accurate and novel approach. J Am Coll Cardiol. 2004;43(11):2091–2096. | |
Anwar AM, Attia WM, Nosir YF, et al. Validation of a new score for the assessment of mitral stenosis using real-time three-dimensional echocardiography. J Am Soc Echocardiogr. 2010;23(1):13–22. | |
Kutty S, Colen TM, Smallhorn JF. Three-dimensional echocardiography in the assessment of congenital mitral valve disease. J Am Soc Echocardiogr. 2013;27(2):142–154. | |
Zeng X, Levine RA, Hua L, et al. Diagnostic value of vena contracta area in the quantification of mitral regurgitation severity by color Doppler 3D echocardiography. Circ Cardiovasc Imaging. 2011;4(5):506–513. | |
Ge S, Bu L, Zhang H, et al. A real-time 3-dimensional digital Doppler method for measurement of flow rate and volume through mitral valve in children: a validation study compared with magnetic resonance imaging. J Am Soc Echocardiogr. 2005;18(1):1–7. | |
Lu X, Nadvoretskiy V, Klas B, et al. Measurement of volumetric flow by real-time 3-dimensional Doppler echocardiography in children. J Am Soc Echocardiogr. 2007;20(8):915–920. | |
Gutiérrez-Chico JL, Zamorano Gómez JL, Rodrigo-López JL, et al. Accuracy of real-time 3-dimensional echocardiography in the assessment of mitral prolapse. Is transesophageal echocardiography still mandatory? Am Heart J. 2008;155(4):694–698. | |
Benenstein R, Saric M. Mitral valve prolapse: role of 3D echocardiography in diagnosis. Curr Opin Cardiol. 2012;27(5):465–476. | |
Meijboom FJ, van den Bosch A, McGhie J. 3D Echocardiography. In: WW Lai, LL Mertens, MS Cohen, T Geva, editors. Echocardiography in Pediatric and Congenital Heart Disease: From Fetus to Adult. Oxford: Wiley-Blackwell; 2009. | |
Vettukattil JJ, Bharucha T, Anderson RH. Defining Ebstein’s malformation using three-dimensional echocardiography. Interact Cardiovasc Thorac Surg. 2007;6(6):685–690. | |
Bharucha T, Anderson RH, Lim ZS, Vettukattil JJ. Multiplanar review of three-dimensional echocardiography gives new insights into the morphology of Ebstein’s malformation. Cardiol Young. 2010;20(1):49–53. | |
van den Bosch AE, Ten Harkel DJ, McGhie JS, et al. Characterization of atrial septal defect assessed by real-time 3-dimensional echocardiography. J Am Soc Echocardiogr. 2006;19(6):815–821. | |
Perk G, Lang RM, Garcia-Fernandez MA, et al. Use of real time three-dimensional transesophageal echocardiography in intracardiac catheter based interventions. J Am Soc Echocardiogr. 2009;22(8):865–882. | |
Chen FL, Hsiung MC, Nanda N, et al. Real time three-dimensional echocardiography in assessing ventricular septal defects: an echocardiographic-surgical correlative study. Echocardiography. 2006;23(7):562–568. | |
Hlavacek AM, Crawford FA Jr, Chessa KS, Shirali GS. Real-time three-dimensional echocardiography is useful in the evaluation of patients with atrioventricular septal defects. Echocardiography. 2006;23(3):225–231. | |
Barrea C, Levasseur S, Roman K, et al. Three-dimensional echocardiography improves the understanding of left atrioventricular valve morphology and function in atrioventricular septal defects undergoing patch augmentation. J Thorac Cardiovasc Surg. 2005;129(4):746–753. | |
Kutty S, Smallhorn JF. Evaluation of atrioventricular septal defects by three-dimensional echocardiography: benefits of navigating the third dimension. J Am Soc Echocardiogr. 2012;25(9):932–944. | |
Takahashi K, Guerra V, Roman KS, Nii M, Redington A, Smallhorn JF. Three-dimensional echocardiography improves the understanding of the mechanisms and site of left atrioventricular valve regurgitation in atrioventricular septal defect. J Am Soc Echocardiogr. 2006;19(12):1502–1510. | |
Bu L, Munns S, Zhang H, et al. Rapid full volume data acquisition by real-time 3-dimensional echocardiography for assessment of left ventricular indexes in children: a validation study compared with magnetic resonance imaging. J Am Soc Echocardiogr. 2005;18(4):299–305. | |
Shibayama K, Watanabe H, Iguchi N, et al. Evaluation of automated measurement of left ventricular volume by novel real-time 3-dimensional echocardiographic system: validation with cardiac magnetic resonance imaging and 2-dimensional echocardiography. J Cardiol. 2013;61(4):281–288. | |
van den Bosch AE, Robbers-Visser D, Krenning BJ, et al. Real-time transthoracic three-dimensional echocardiographic assessment of left ventricular volume and ejection fraction in congenital heart disease. J Am Soc Echocardiogr. 2006;19(1):1–6. | |
Riehle TJ, Mahle WT, Parks WJ, Sallee D 3rd, Fyfe DA. Real-time three-dimensional echocardiographic acquisition and quantification of left ventricular indices in children and young adults with congenital heart disease: comparison with magnetic resonance imaging. J Am Soc Echocardiogr. 2008;21(1):78–83. | |
Friedberg MK, Su X, Tworetzky W, Soriano BD, Powell AJ, Marx GR. Validation of 3D echocardiographic assessment of left ventricular volumes, mass, and ejection fraction in neonates and infants with congenital heart disease a comparison study with cardiac MRI. Circ Cardiovasc Imaging. 2010;3(6):735–742. | |
Altmann K, Shen Z, Boxt LM, et al. Comparison of three-dimensional echocardiographic assessment of volume, mass, and function in children with functionally single left ventricles with two-dimensional echocardiography and magnetic resonance imaging. Am J Cardiol. 1997;80(8):1060–1065. | |
Soriano BD, Hoch M, Ithuralde A, et al. Matrix-array 3-dimensional echocardiographic assessment of volumes, mass, and ejection fraction in young pediatric patients with a functional single ventricle a comparison study with cardiac magnetic resonance. Circulation. 2008;117(14):1842–1848. | |
Kaku K, Takeuchi M, Tsang W, et al. Age-related normal range of left ventricular strain and torsion using three-dimensional speckle-tracking echocardiography. J Am Soc Echocardiogr. 2013;27(1):55–64. | |
Zhang L, Gao J, Xie M, et al. Left ventricular three-dimensional global systolic strain by real-time three-dimensional speckle tracking in children: feasibility, reproducibility, maturational changes, and normal ranges. Clin Gastroenterol Hepatol. 2013;26(8):853–859. | |
Herberg U, Gatzweiler E, Breuer T, Breuer J. Ventricular pressure-volume loops obtained by 3D real-time echocardiography and mini pressure wire – a feasibility study. Clin Res Cardiol. 2013;102(6):427–438. | |
Perrin DP, Vasilyev NV, Marx GR, del Nido PJ. Temporal enhancement of 3D echocardiography by frame reordering. JACC Cardiovasc Imaging. 2012;5(3):300–304. | |
Saltijeral A, Isla LP, Pérez-Rodríguez O, et al. Early myocardial deformation changes associated to isolated obesity: a study based on 3D-wall motion tracking analysis. Obesity. 2011;19(11):2268–2273. | |
Gayat E, Ahmad H, Weinert L, Lang RM, Mor-Avi V. Reproducibility and inter-vendor variability of left ventricular deformation measurements by three-dimensional speckle-tracking echocardiography. J Am Soc Echocardiogr. 2011;24(8):878–885. | |
Hope MD, Sedlic T, Dyverfeldt P. Cardiac magnetic resonance flow imaging. J Thorac Imaging. 2013;28:217–230. | |
Calkoen EE, Roest AA, van derGeest RJ, de Roos A, Westenberg JJ. Cardiovascular function and flow by 4-dimensional magnetic resonance imaging techniques: new applications. J Thorac Imaging. 2014;29(3):185–196. | |
Stankovic Z, Allen BD, Garcia J, et al. 4D flow imaging with CMR. Cardiovasc Diagn Ther. 2014;4(2):173–192. | |
Markl M, Schnell S, Barker AJ. 4D flow imaging: current status to future clinical applications. Curr Cardiol Rep. 2014;16:481. | |
Markl M, Kilner PJ, Ebbers T. Comprehensive 4D velocity mapping of the heart and great vessels by cardiovascular magnetic resonance. J Cardiovasc Magn Reson. 2011;13:7. | |
Buonocore MH. Visualizing blood flow patterns using streamlines, arrows, and particle paths. Magn Reson Med. 1998;40:210–226. | |
Stalder AF, Russe MF, Frydrychowicz A, Bock J, Hennig J, Markl M. Quantitative 2D and 3D phase contrast CMR: optimized analysis of blood flow and vessel wall parameters. Magn Reson Med. 2008;60:1218–1231. | |
Markl M, Frydrychowicz A, Kozerke S, et al. 4D flow CMR. J Magn Reson Imaging. 2012;35:1015–1036. | |
Bock J, Frydrychowicz A, Lorenz R, et al. In vivo noninvasive 4D pressure difference mapping in the human aorta: phantom comparison and application in healthy volunteers and patients. Magn Reson Med. 2011;66:1079–1088. | |
Ebbers T, Wigström L, Bolger AF, Engvall J, Karlsson M. Estimation of relative cardiovascular pressures using time-resolved three-dimensional phase contrast CMR. Magn Reson Med. 2001;45:872–879. | |
Valverde I, Nordmeyer S, Uribe S, et al. Systemid-to-pulmonary collateral flow in patients with palliated univentricular heart physiology: measurement using cardiovascular magnetic resonance 4D velocity acquisition. J Cardiovasc Magn Reson. 2012;14:25. | |
van derHulst AE, Westenberg JJ, Kroft LJ, et al. Tetralogy of Fallot: 3D velocity-encoded MR imaging for evaluation of right ventricular valve flow and diastolic function in patients after correction. Radiology. 2010;256(3):724–734. | |
Geiger J, Markl M, Jung B, et al. 4D-MR flow analysis in patients after repair for tetralogy of Fallot. Eur Radiol. 2011;21:1651–1657. | |
François CJ, Srinivasan S, Schiebler ML, et al. 4D cardiovascular magnetic resonance velocity mapping of alterations of right heart flow pattenrs and main pulmonary artery hemodynamics in tetralogy of Fallot. J Cardiovasc Magn Reson. 2012;14:16. | |
Barker AJ, Markl M, Bürk J, et al. Bicuspid aortic valve is associated with altered wall shear stress in the ascending aorta. Circ Cardiovasc Imaging. 2012;5(4):457–466. | |
Hope MD, Meadows AK, Hope TA, et al. Evaluation of bicuspid aortic valve and aortic coarctation with 4d flow magnetic resonance imaging. Circulation. 2008;117(21):2818–2819. | |
Hope MD, Hope TA, Meadows AK, et al. Bicuspid aortic valve: four-dimensional MR evaluation of ascending aortic systolic flow patterns. Radiology. 2010;255:53–61. | |
Frydrychowicz A, Markl M, Hirtler D. Aortic hemodynamics in patients with and without repair of aortic coarctation: in vivo analysis by 4D flow-sensitive magnetic resonance imaging. Invest Radiol. 2011;46(5):317–325. | |
Geiger J, Markl M, Herzer L, et al. Aortic flow patterns in patients with Marfan syndrome assessed by flow-sensitive four-dimensional CMR. J Magn Reson Imaging. 2012;35:594–600. | |
Hope TA, Kvitting JP, Hope MD, Miller DC, Markl M, Herfkens RJ. Evaluation of Marfan patients status post valve-sparing aortic root replacement with 4D flow. Magn Reson Imaging. 2013;31(9):1479–1484. | |
Markl M, Geiger J, Kilner PJ, et al. Time-resolved three-dimensional magnetic resonance velocity mapping of cardiovascular flow paths in volunteers and patients with Fontan circulation. Eur J Cardiothorac Surg. 2011;39(2):206–212. | |
Markl M, Geiger J, Jung B, Hirtler D, Arnold R. Noninvasive evaluation of 3D hemodynamics in a complex case of single ventricle physiology. J Magn Reson Imaging. 2012;35(4):933–937. | |
Sundareswaran KS, Haggerty CM, de Zélicourt D, et al. Visualization of flow structures in Fontan patients using 3-dimensional phase contrast magnetic resonance imaging. J Thorac Cardiovasc Surg. 2012;143(5):1108–1116. | |
Sundareswaran KS, de Zélicourt D, Sharma S, et al. Correction of pulmonary arteriovenous malformation using image-based surgical planning. JACC Cardiovasc Imaging. 2009;2(8):1024–1030. | |
Uribe S, Bächler P, Valverde I, et al. Hemodynamic assessment in patients with one-and-a-half ventricle repair revealed by four-dimensional flow magnetic resonance imaging. Pediatr Cardiol. 2013;34(2):447–451. |
 © 2014 The Author(s). This work is published and licensed by Dove Medical Press Limited. The
full terms of this license are available at https://www.dovepress.com/terms
and incorporate the Creative Commons Attribution
- Non Commercial (unported, 3.0) License.
By accessing the work you hereby accept the Terms. Non-commercial uses of the work are permitted
without any further permission from Dove Medical Press Limited, provided the work is properly
attributed. For permission for commercial use of this work, please see paragraphs 4.2 and 5 of our Terms.
© 2014 The Author(s). This work is published and licensed by Dove Medical Press Limited. The
full terms of this license are available at https://www.dovepress.com/terms
and incorporate the Creative Commons Attribution
- Non Commercial (unported, 3.0) License.
By accessing the work you hereby accept the Terms. Non-commercial uses of the work are permitted
without any further permission from Dove Medical Press Limited, provided the work is properly
attributed. For permission for commercial use of this work, please see paragraphs 4.2 and 5 of our Terms.