Back to Journals » Risk Management and Healthcare Policy » Volume 14
Understanding the Patterns and Trends of Food Consumption in a Developing Country Context: The Case of Amhara Region, Ethiopia
Authors Mengesha ST ![]()
Received 2 January 2021
Accepted for publication 20 March 2021
Published 29 April 2021 Volume 2021:14 Pages 1777—1784
DOI https://doi.org/10.2147/RMHP.S299669
Checked for plagiarism Yes
Review by Single anonymous peer review
Peer reviewer comments 2
Editor who approved publication: Professor Marco Carotenuto
Seyoum Teffera Mengesha
Department of Economics, College of Business and Economics, Bahir Dar University, Bahir Dar, Ethiopia
Correspondence: Seyoum Teffera Mengesha
Department of Economics, College of Business and Economics, Bahir Dar University, PoBox: 618, Addis Alem, Bahir Dar, Ethiopia
Email [email protected]
Background: Food and nutrition security continued to be a significant concern in the global food system. However, this system is not delivering optimal nutrition and health outcomes. Most low- and middle-income countries are burdened by persistent undernutrition and recently growing overweight and diet-related non-communicable diseases. One of the mechanisms for addressing this nutrition paradox is understanding consumers’ food choices and preferences. Thus, this study’s objective was to assess the patterns and trends of food consumption in a developing country context: the case of Amhara region, Ethiopia, and to identify market-based interventions involving specific foods and groups.
Methods: A household-based cross-sectional study and multistage sampling technique were used to select study participants and collect data. A structured questionnaire was used for data collection, and the study adopted a descriptive research approach and a mix of complementary qualitative and quantitative methods in its analysis. A Household Dietary Diversity Score (HDDS) to describe the respondents’ food consumption pattern was used in the study.
Results: Following FAO (2010)’s guideline, the HDDS score was calculated based on the intake of 12 food groups using a week recall data. The average HDDS was 8.5 out of 12 food groups. The average HDDS was relatively high, which might be related to the week recall in our data measurement period.
Conclusion: This report seeks to understand consumers’ behavior by investigating several aspects of food choices, including household dietary diversity and food expenditures. The study also provides insights for researchers to further investigate the issue by adding other scientific databases and methods to draw more meaningful and implementable conclusions.
Limitations: Although the sampling procedure was random, it might not be representative to study the patterns and trends of food consumption at a country or broad level due to its small size.
Keywords: food consumption, HDDS, nutrition, Ethiopia
Introduction
Food and nutrition security is continued to be a significant concern in the global food system. Food security is assumed to exist
when all people, at all times, have physical and economic access to sufficient, safe and nutritious food to meet their dietary needs and food preferences for an active and healthy life.1
Three significant dimensions to the attainment of food security, therefore, are: 1) Food Availability: sufficient quantities of appropriate, necessary types of food from domestic production, commercial imports, or donors are consistently available to the individuals or are within reasonable proximity to them or are within their reach; 2) Food Access: individuals have adequate incomes or other resources to purchase or barter to obtain levels of appropriate food needed to maintain consumption of an adequate diet/nutrition level; 3) Food Utilization: food is adequately used, proper food processing and storage techniques are employed, sufficient knowledge of nutrition and child care techniques exist and is applied, and adequate health and sanitation services exist.2
However, the global food system is not delivering optimal nutrition and health outcomes. Notably, most low- and middle-income countries are burdened by persistent undernutrition and recently growing overweight and diet-related non-communicable diseases.3,4 Millions of people continue to be undernourished, while others consume diets that increase their risk of developing non-communicable diet-related diseases. Health systems in developing countries are under increasing pressure to deal with a range of adverse health conditions due to the nutrition paradox.5 Doak et al argued that the nutrition paradox, where both undernutrition and overnutrition coexist within the same poor population segments, has become a widely observed feature of low- and middle-income countries.6 Addressing both undernutrition and overweight at the same time requires solving food and nutrition insecurity and understanding consumers’ food choices and preferences to promote nutritious foods and a healthy lifestyle. We argue that understanding consumers’ food choices and preferences can help identify entry points for food system improvements and opportunities for business development via linking nutritional demands with economic values. This understanding is critical for poverty policy analysts to design appropriate interventions that use consumer behavior science to influence consumers’ food choices and lifestyles.
Recently, the prospects and approaches for ending malnutrition are changing. In particular, there has been a shift towards more emphasis on the roles of consumer behaviour and other factors. A component of this transition is a movement towards consuming more ready-to-eat processed foods. A concern is that such foods are not as healthy as less processed foods and that micronutrients are not as prevalent in diets as is optimal from a nutrition or health perspective. Fortunately, in developing countries where processed and ultra-processed foods are not as consumed, there is still an opportunity to guide the diet transition towards healthier foods.
At the same time, accumulated evidence has shown that nutritional deficiencies are not merely the result of low food availability but also poor consumer food behaviors and eating practices. They are in turn, shaped by much powerful marketing, psychosocial, and other behavioral factors.7,8 There is now increasing interest to understand better the role of consumer behavior in improving dietary outcomes. For example, even if healthier foods are available, consumers may not necessarily decide to purchase healthier foods, and even if consumers purchase healthier foods, targeted individuals may not consume them. This suggests that improving nutrition outcomes is possible through influencing consumers’ dietary choices towards healthier and more nutritious diets, even when resources are limited. But promoting healthy dietary behaviors requires a better understanding of consumers’ food choices and consumption behaviors to identify credible methods and interventions to stimulate demand for healthier food products both among food purchasers in households and individuals within households.
Furthermore, significant changes are happening in food markets worldwide and especially so in developing countries. Rapid urbanization and economic development are considered significant forces for the consumer industry. The reason might be because urbanization and rising incomes will likely result in a shift in consumer diets to include more protein, sugars and sweeteners, fats, and oils; stressing the importance of boosting local food production to meet the growing demand for more animal-derived foods and high–calorie plant foods. However, the issue is now understanding the consumers’ food choices and food consumption patterns better. To date, there is no comprehensive empirical research on the consumer market in Africa.9 Notably, we lack a clear understanding of consumers’ behavior, preferences, tastes, and attitude to tap these growing business opportunities. To the best of our knowledge, the implication of understanding consumers’ food choices and the patterns of food consumption has rarely been explored in the context of Africa in general and Ethiopia in particular. This will constitute a significant contribution of this research.
Our study focuses on Ethiopia, a large food insecure country by many standards. Undernutrition remains a devastating problem in the country. Low dietary diversity and quality of food sit at the roots of the country’s multiple malnutrition burdens. Women and children constitute the most vulnerable groups to undernutrition.10–12 At the same time, obesity levels are increasing, especially among women, with one out of three women in the growing urban areas being already overweight. This is also called the double burden of malnutrition.3
Overall, this paper attempted to address several primary research questions, including:
- How diverse are consumers’ diets in Amhara region, Ethiopia?
- What are the current food consumption patterns in Amhara region, Ethiopia?
- What dietary gaps can be identified from the analysis of the current food situation in Amhara region, Ethiopia?
Thus, this study’s main objective was to assess the patterns and trends of food consumption in a developing country context: the case of Amhara region, Ethiopia. The specific objectives include
- identify the level of diversity in consumers’ diets in Amhara region, Ethiopia
- describe the current food consumption patterns in Amhara region, Ethiopia
- identify the types of dietary gaps of the current food situation in Amhara region, Ethiopia
This paper contributes to the existing literature and knowledge in several ways. This study is the first of its kind that attempts to comprehensively understand consumers’ food choices and patterns of food consumption in Ethiopia to the best of our knowledge. The findings significantly contribute to policy efforts aiming to alleviate poverty problems related to food choices and consumption. A better understanding of consumption patterns is useful in guiding interventions to improve food consumption and dietary diversity. Therefore, it could be used as an inference for other research to be substantiated based on issues raised and the gap identified. Finally, the result of the study guides policymakers to craft appropriate policies and programs towards improving food and nutrition security.
Data and Research Methodology
This study adopts a cross-sectional study design and descriptive research approach. Data were collected in Amhara National Regional State, the second-most populous region of the country, in northwestern Ethiopia, in 2017. To minimize the agro-ecological variations for our comparison of urban and rural consumers, the survey was conducted in three metropolitan cities (Bahir Dar, Gondar, and Dessie) of the Amhara region to represent urban consumers and three rural districts surrounding these metropolitan cities.
One of the essential steps in conducting research is calculating the sample size, as it is not always possible to study the whole population in places where the population is sufficiently large.13 Hence, for our study, a set of participants (sample) was selected from the population using a single population proportion formula14 on the following assumptions: expected food insecurity prevalence rate of 30%, 95% confidence interval (5% level of significance—Z(α/2) = 1.96) and 5% margin of error (absolute precision), 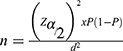 .
.
Where is the critical value of the Normal distribution at  , d is the margin of error, and P is the sample proportion.
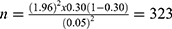
Therefore, the survey included about 167 urban households and 166 rural households who were randomly sampled. To recruit the participants, we first contacted local officers from each Kebele to attain permission to recruit participants. Then to obtain informed consent from participants, pertinent information had been presented for participants, and adequate time had been given to review the consent document.
A structured questionnaire was used for data collection. The questionnaire consisted of several modules, including sociodemographic characteristics, food consumption, and food shopping. To test our surveys’ validity and examine their feasibility on a larger scale, we had done a pilot test for our study.
For this part of the analysis, we used only the data from urban households as urban consumers offer the opportunity to study food choice and purchase behavior. The information on food choice and purchase behavior for rural households is limited as they are largely subsistence and are found not to buy much food from the market.
The study employed a mix of complementary qualitative and quantitative approaches in its analysis. The study also employed descriptive statistics in its analysis. Consumers’ food choices and patterns of food consumption have been discussed with tables, graphs, and charts, as they appear appropriate in the various components of the paper.
Results and Discussion
Table 1 contain detailed descriptive information about the characteristics of respondents. As indicated in table 2 the highest share of participants were males (92%), Orthodox Christians (83%), and had attended a formal education above primary education (85%). The sample exhibits a paternalistic feature of Ethiopian households, with most of the decision-makers are males, accounting for 92% of the respondents, though women and children constitute the most vulnerable in the population in terms of food insecurity. As indicated in table 1 the average respondent was aged about 42 years and came from a household with a family size of about four individuals. The average household monthly income is about 4700 Eth. Birr, though about 70% of the sample households earned effectively less than the average income. Around 20% of the respondents had received remittance income from someone who was either elsewhere in Ethiopia or overseas.
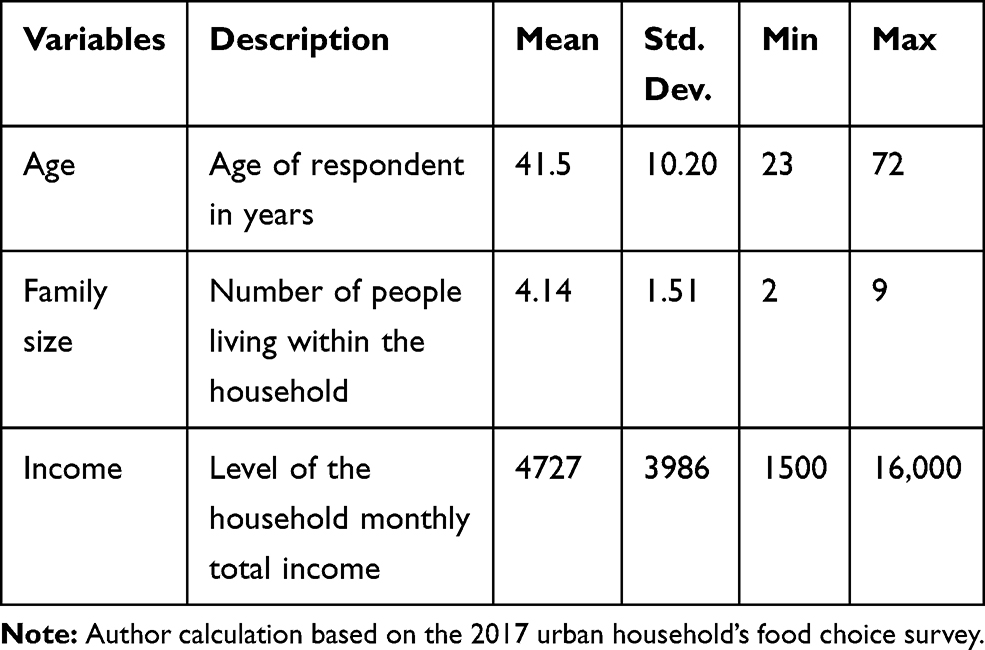 |
Table 1 Summary Statistics of the Study Sample (N = 187) |
When appropriate, we carry out sub-sample analysis and comparison based on participants’ vital sociodemographic characteristics, including gender, education, and income. Table 3 provides the number of observations in each sub-sample used for sub-sample analyses. The sub-samples for gender and education are straightforward. The sub-samples for income are produced by grouping data into categories as indicated in Table 3.Table 2
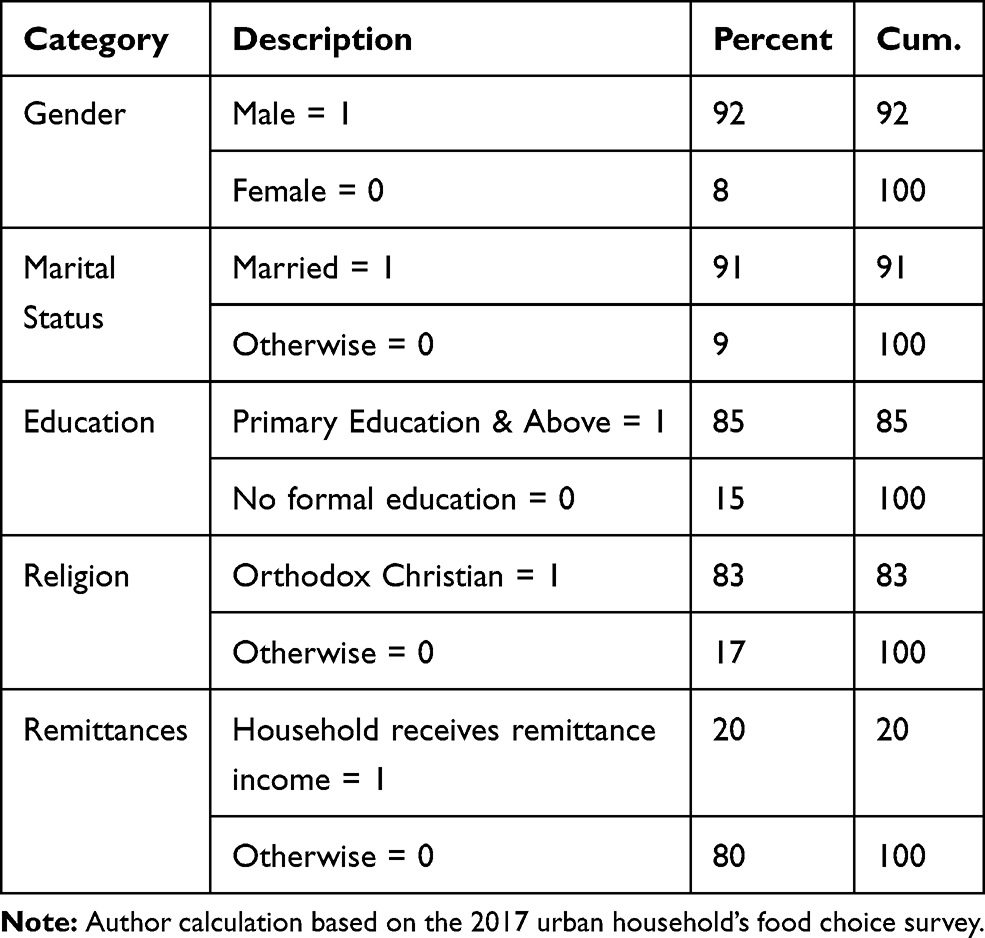 |
Table 2 Frequency Distribution of the Study Sample (N = 187) |
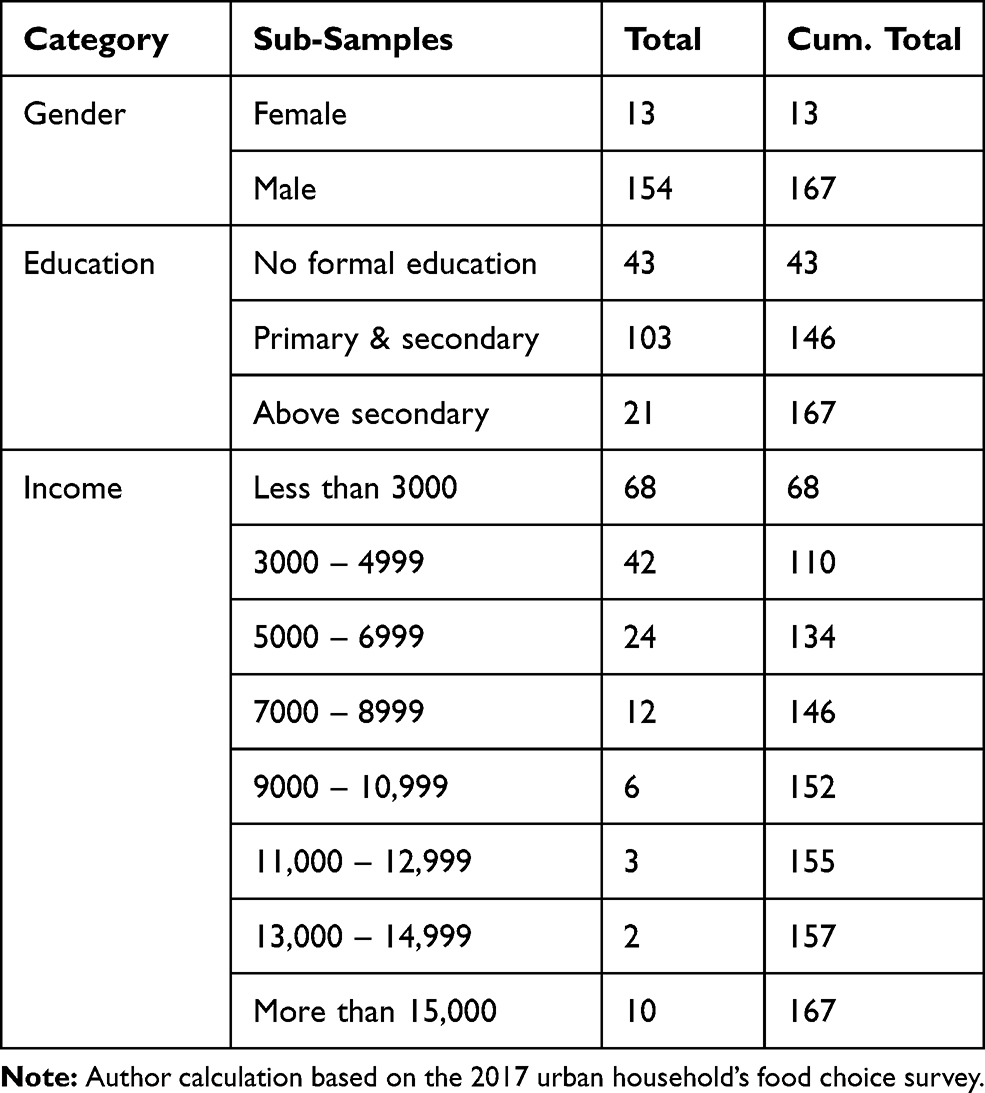 |
Table 3 Distribution of Observations in Different Sub-Samples |
To describe respondents’ food consumption patterns, we used a household dietary diversity score (HDDS). Dietary behavior is complex, and focusing on single food or nutrient cannot constitute the complexity of food consumption patterns and their multidimensional nature.15,16 Dietary diversity analysis allows characterizing the current food consumption patterns and identifying dietary gaps from the analysis. It is typically used for dietary gap analyses and dietary recommendations in developing countries. It is shown to be a predictor for macronutrient and micronutrient adequacy17 and is considered a good indicator of nutrition and health outcomes. Household dietary diversity score (HDDS) reveals diversity in both macronutrients and micronutrients and the economic access of a household to food. To better reflect a quality diet, the number of different food groups consumed, rather than the number of different foods consumed, is used to construct the HDDS. Following the FAO (2010) ’s guideline, the score is calculated based on the intake of 12 food groups: cereals; white tubers and roots; vegetables; fruits; meat; eggs; fish and fish products; legumes, nuts and seeds; milk and milk products; oils and fats; sweets and sugars; and spices, condiments, and beverages. http://www.fao.org/3/X6877E/X6877E00.htm HDDS may preferably be calculated using 24h recall data. Here, we prefer the week recall as Wednesday and Friday are fasting days for Orthodox Christian Ethiopians. The week recall allows us to avoid possible biases due to interview dates. Respondents were asked whether the household consumed each food group over the recent week.HDDS may preferably be calculated using 24h recall data. Here, we prefer the week recall as Wednesday and Friday are fasting days for Orthodox Christian Ethiopians. The week recall allows us to avoid possible biases due to interview dates. The sum of the 12 food groups for each respondent was computed to give a maximum score of 12.
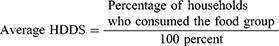
The average HDDS indicator is calculated for the sample population in the following way.
The household dietary diversity score (HDDS) is meant to reflect the economic ability of a household (not individuals) to access a variety of foods. Various studies have shown that an increase in household dietary diversity is associated with socio-economic status and household food security.18
Table 4 provides the different food groups and the proportion of households who consumed the food groups. The average HDDS is 8.5 out of 12 food groups. The average HDDS was relatively high, which might be related to the week recall in our data measurement period. Looking at the consumption of individual food groups revealed essential trends. Nearly all households consumed cereals, spices, condiments and beverages, legumes, nuts, and seeds. The consumption level of vegetables also appeared to be high; however, this high level of vegetable consumption might have to be considered curiously. Traditionally, Ethiopians use onions in cooking their sauces and stews, and this high level of vegetable consumption may reflect this fact rather than the consumption of more diversified vegetables. About two-thirds of households consumed dairy products, but the consumption of other animal source foods (meat, poultry, and eggs) was not high relatively. Particularly, only about 3% of households consumed fish and other seafood.
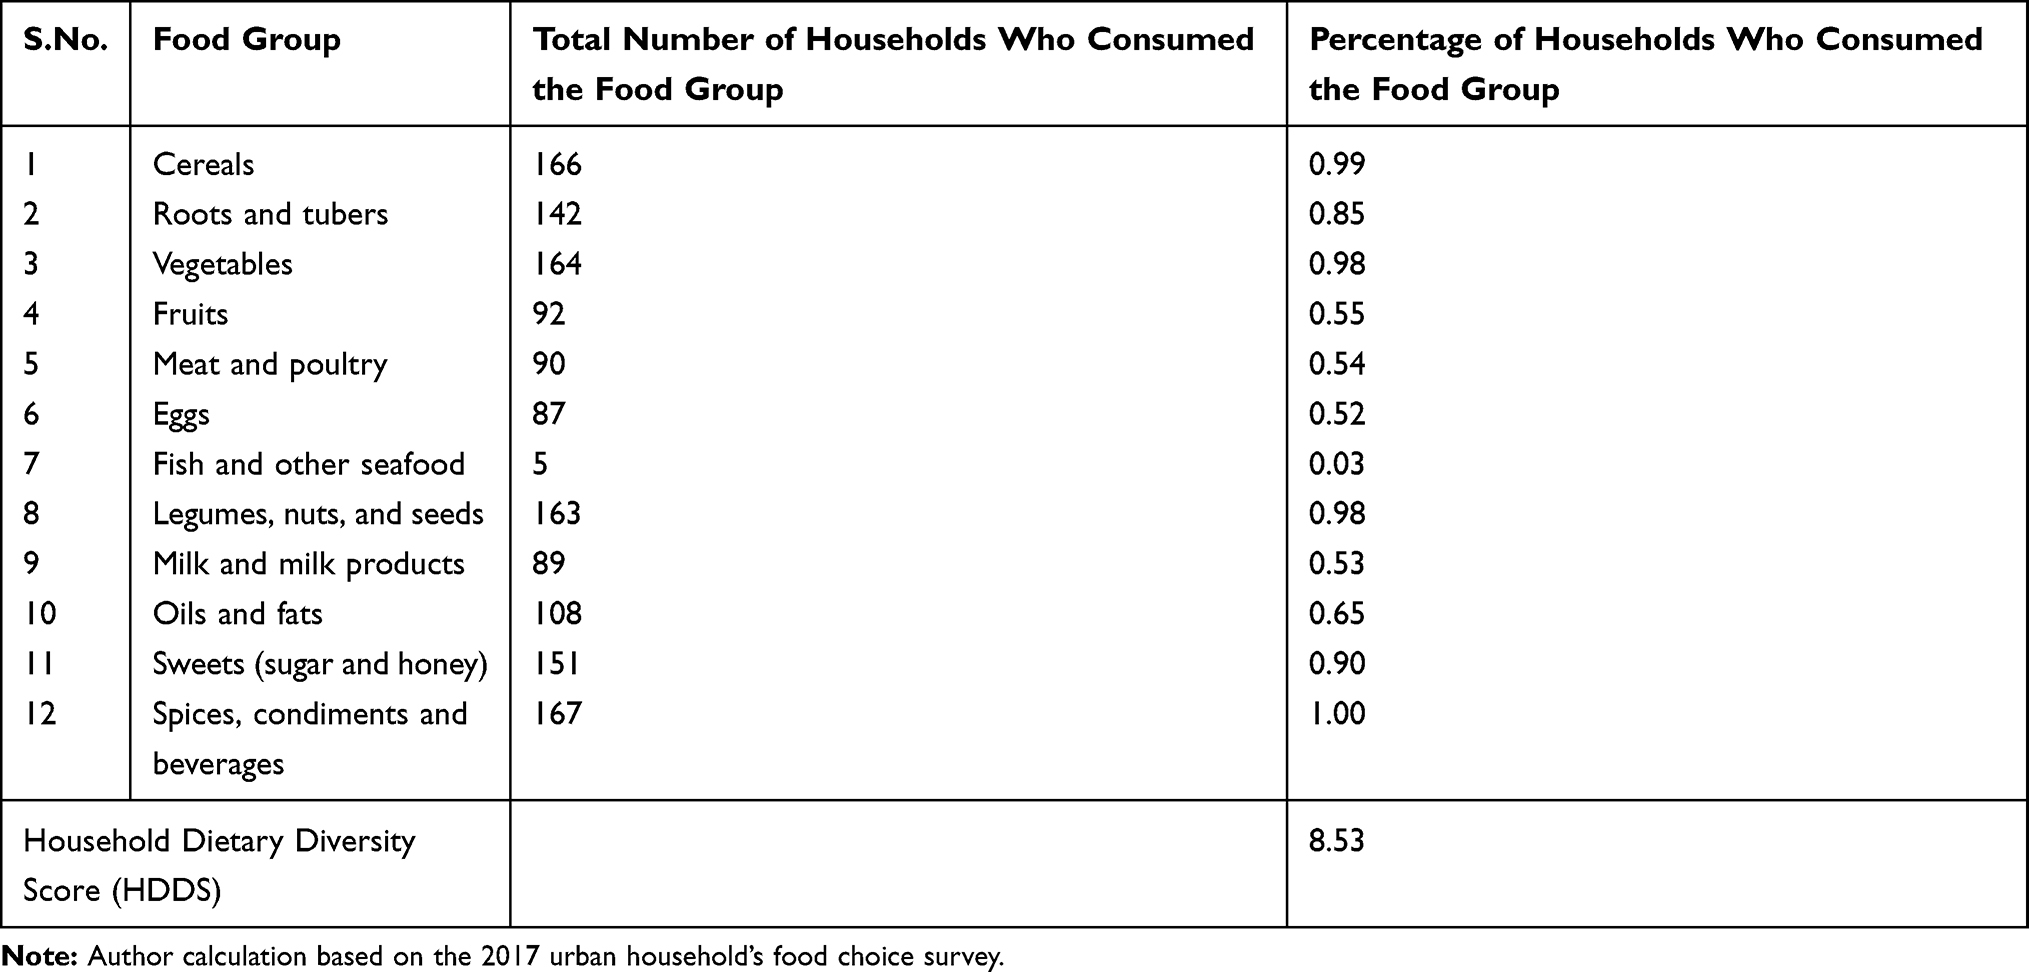 |
Table 4 Food Groups Used for HDDS Calculation |
We also looked at differences in HDDS across several relevant sociodemographic characteristics of respondents. The average HDDS did not differ significantly between female (8.5) and male (8.7) participants. Figure 1 shows that HDDS tends to increase with the income and education level of respondents.
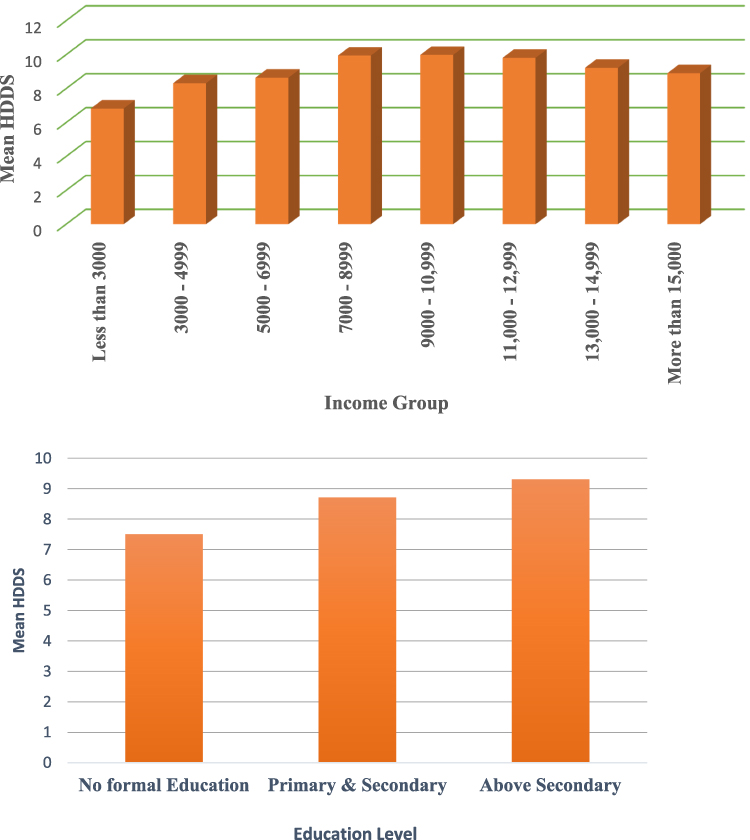 |
Figure 1 Variations of HDDS across different sub-samples (A) Relationship between HDDS and income. (B) Relationship between HDDS and education. |
It is generally clear that certain healthier food categories are missing from the diets of our sample. Furthermore, sub-sample analyses indicate that these missing more beneficial categories get filled in as nutrition knowledge or income increases. However, intakes of processed foods also increase by income levels. Thus, people are eating both healthier and unhealthier foods as their incomes increase.
The average weekly food expenditure of sampled households was about 620 Ethiopian Birr. A chi-squared test (p = 0.726) showed that the average weekly food expenditure did not vary significantly for female (601) and male (616) respondents. However, the average spending appeared to increase with income and level of education. The differences across the different groups are also significant across income and education levels of respondents. Figure 2 illustrates these differences. Notably, average food expenditure increases with income to a certain level (15, 000 Eth. Birr) and then decreases as income increases.
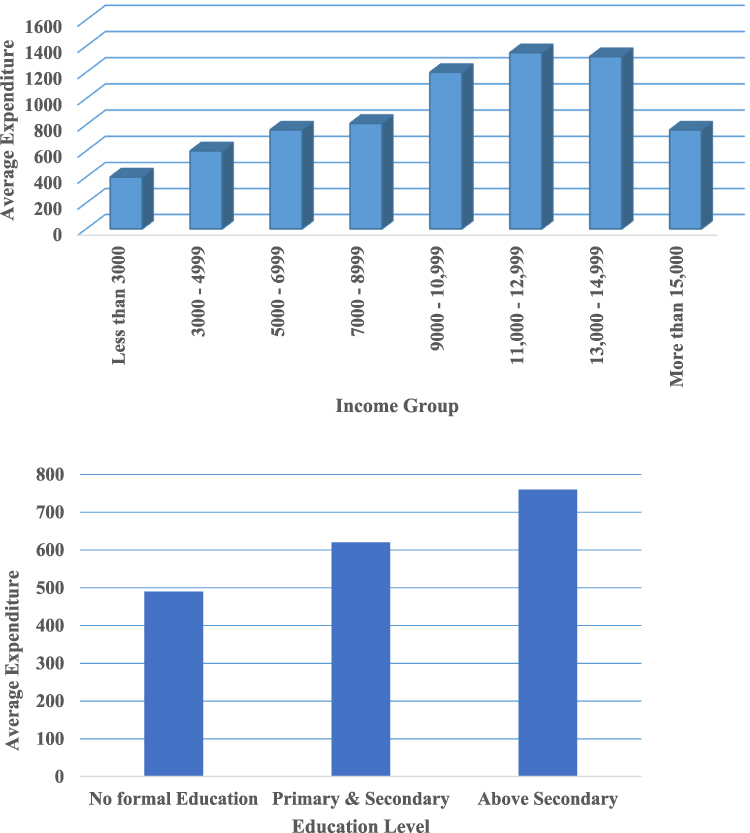 |
Figure 2 Variations of average food expenditure across different sub-samples. (A) Relationship between average expenditure and income. (B) Relationship between average expenditure and education. |
Conclusion and Implications
Food issues have long been a major concern in Ethiopia. They have been diversely approached in economic, agricultural or health, and nutrition terms. Notably, there is no shortage of literature on consumption patterns in Ethiopia. General trends in food consumption patterns have already been documented.17 However, such general analysis underscores severe gaps in our knowledge and understanding of which foods are consumed by which consumer groups.
This report seeks to understand consumers’ behavior by investigating the “what”, component of consumers’ food choices. This component informs the conceptual framework of the report of consumers’ food choices. Besides, this element consists of several aspects of food choices, including household dietary diversity and food expenditures.
To describe respondents’ food consumption patterns, we used a household dietary diversity score (HDDS) calculated based on the intake of 12 food groups using a week recall data. The average HDDS was relatively high, which might be related to self-reporting. Therefore, the use of a food diary might enable to draw more meaningful and implementable conclusions.
Furthermore, the information on food choice and purchase behavior for rural households is limited as they are largely subsistence and are found not to buy much food from the market, which forced us to use the data from urban households only as urban consumers offer the opportunity to study food choice and purchase behavior. The implication is that the urban consumers’ foods and diets deserve more attention than they have been given so far due to their implications on food and agriculture planning and for determining remedial actions and preventive measures to tackle food and nutrition insecurity problems. Therefore, characterizing consumption patterns and dynamics is an important starting point to identify market-based interventions involving specific foods and groups. Remarkably, the application of consumer research methods to the study of consumption patterns is an ideal approach to develop food profiles and classifications, which in general has been little used in developing countries. Such food profiles and categories can be used to quantify consumption patterns from the household level to the national level.
Ethics and Consent
The study was conducted according to the Declaration of Helsinki principles and fulfilled the Ethiopian National Health Research and Ethics Guideline requirements. Moreover, the study received ethical approval from the Ethical Review Committee of Bahir Dar University. Information and an informed consent sheet were sent to each study participant together with the questionnaire. Consequently, data were collected after getting their informed consent from each study participant. Participation was entirely voluntary based, including not responding after reading the instructions and questions. Data confidentiality was maintained through anonymity by avoiding any personal identifiers. Thus, the data collection process was secured.
Disclosure
The author declares that there are no conflicts of interest.
References
1. FAO. Rome declaration on world food security and world food summit plan of action rome declaration on world food security; 1996. Available from: https://digitallibrary.un.org/record/195568?ln=en.
2. Swindale A, Bilinsky P. Advances in developing country food insecurity measurement development of a universally applicable household food insecurity measurement tool: process, current status, and outstanding issues 1–3. J Nutr. 2006;136:1449–1452. doi:10.1093/jn/136.5.1449S
3. Lim SS, Vos T, Flaxman AD, et al. A comparative risk assessment of burden of disease and injury attributable to 67 risk factors and risk factor clusters in 21 regions, 1990–2010: a systematic analysis for the Global Burden of Disease Study 2010. Lancet. 2012;380(9859):2224–2260. doi:10.1016/S0140-6736(12)61766-8
4. Hawkes C, Thow AM, Downs S, et al. Identifying effective food systems solutions for nutrition and non-communicable diseases: creating policy coherence in the fats supply chain. SCN News. 2014;40:39–47.
5. Caballero B. A nutrition paradox — underweight and obesity in developing countries. New Engl J Med. 2005;352(15):1514–1516. doi:10.1056/NEJMp048310
6. Doak CM, Adair LS, Monteiro C, Popkin BM. Overweight and underweight coexist within households in Brazil, China and Russia. J Nutr. 2000;130(12):2965–2971. doi:10.1093/jn/130.12.2965
7. Webb TL, Sheeran P. Does changing behavioral intentions engender behavior change? A meta-analysis of the experimental evidence. Psychol Bull. 2006;132(2):249–268. doi:10.1037/0033-2909.132.2.249
8. Geaney F, Fitzgerald S, Harrington JM, Kelly C, Greiner BA, Perry IJ. Nutrition knowledge, diet quality and hypertension in a working population. Preventive Med Rep. 2015;2:105–113. doi:10.1016/j.pmedr.2014.11.008
9. Hattingh D, Russo B, Sun-Basorun A, Wamelen. A van. The Rise of the African Consumer: A Report from McKinsey’s Africa Consumer Insight Center. McKinsey&Company. 2012.
10. Headey D. An analysis of trends and determinants of child undernutrition in Ethiopia, 2000–2011. Int Food Policy Res Inst. 2014.
11. Beyene M, Worku AG, Wassie MM. Dietary diversity, meal frequency and associated factors among infant and young children in Northwest Ethiopia: a cross-sectional study. BMC Public Health. 2015;15(1):1007. doi:10.1186/s12889-015-2333-x
12. Alemayehu MS, Tesema EM. Dietary practice and associated factors among pregnant women in Gondar Town North West, Ethiopia, 2014. Int J Nutr Food Sci. 2015;4(6):707–712. doi:10.11648/j.ijnfs.20150406.27
13. Daniel, Wayne W., and Chad L. Cross. Biostatistics: a foundation for analysis in the health sciences. Wiley; 2013.
14. Vereecken C, Maes L. Young children’s dietary habits and associations with the mothers’ nutritional knowledge and attitudes. Appetite. 2010;54(1):44–51. doi:10.1016/j.appet.2009.09.005
15. Arimond M, Wiesmann D, Becquey E, et al. Simple food group diversity indicators predict micronutrient adequacy of women’s diets in 5 diverse, resource-poor settings1-7. J Nutr. 2010;140(11):2059–2069. doi:10.3945/jn.110.123414
16. Steyn N, Nel J, Nantel G, Kennedy G, Labadarios D. Food variety and dietary diversity scores in children: are they good indicators of dietary adequacy? Public Health Nutr. 2006;9(5):644–650. doi:10.1079/phn2005912
17. Berhane G, McBride L, Hirfrfot KT, Tamiru S. Patterns in foodgrain consumption and calorie intake. Food Agric Ethiop Prog Policy Challenges. 2013;9780812208:190–216. doi:10.9783/9780812208610.190
18. Hoddinott J, Yohannes Y. Dietary diversity as a food security indicator. International Food Policy Research Institute 2002. doi:10.22004/AG.ECON.16474
 © 2021 The Author(s). This work is published and licensed by Dove Medical Press Limited. The
full terms of this license are available at https://www.dovepress.com/terms
and incorporate the Creative Commons Attribution
- Non Commercial (unported, 3.0) License.
By accessing the work you hereby accept the Terms. Non-commercial uses of the work are permitted
without any further permission from Dove Medical Press Limited, provided the work is properly
attributed. For permission for commercial use of this work, please see paragraphs 4.2 and 5 of our Terms.
© 2021 The Author(s). This work is published and licensed by Dove Medical Press Limited. The
full terms of this license are available at https://www.dovepress.com/terms
and incorporate the Creative Commons Attribution
- Non Commercial (unported, 3.0) License.
By accessing the work you hereby accept the Terms. Non-commercial uses of the work are permitted
without any further permission from Dove Medical Press Limited, provided the work is properly
attributed. For permission for commercial use of this work, please see paragraphs 4.2 and 5 of our Terms.