Back to Journals » International Journal of Nanomedicine » Volume 9 » Issue 1
Umbilical cord mesenchymal stem cells labeled with multimodal iron oxide nanoparticles with fluorescent and magnetic properties: application for in vivo cell tracking
Authors Sibov T, Pavon L, Miyaki L, Mamani J ![]() , Nucci L, Alvarim L, Silveira P, Marti L, Gamarra LF
, Nucci L, Alvarim L, Silveira P, Marti L, Gamarra LF ![]()
Received 20 August 2013
Accepted for publication 2 October 2013
Published 8 January 2014 Volume 2014:9(1) Pages 337—350
DOI https://doi.org/10.2147/IJN.S53299
Checked for plagiarism Yes
Review by Single anonymous peer review
Peer reviewer comments 2
Tatiana T Sibov,1,2 Lorena F Pavon,1 Liza A Miyaki,1 Javier B Mamani,1 Leopoldo P Nucci,1,2 Larissa T Alvarim,1,3 Paulo H Silveira,1 Luciana C Marti,1 LF Gamarra1–3
1Hospital Israelita Albert Einstein, São Paulo, Brazil; 2Departamento de Neurologia e Neurociências, Universidade Federal de São Paulo, São Paulo, Brazil; 3Faculdade de Ciências Médicas da Santa Casa de São Paulo, São Paulo, Brazil
Abstract: Here we describe multimodal iron oxide nanoparticles conjugated to Rhodamine-B (MION-Rh), their stability in culture medium, and subsequent validation of an in vitro protocol to label mesenchymal stem cells from umbilical cord blood (UC-MSC) with MION-Rh. These cells showed robust labeling in vitro without impairment of their functional properties, the viability of which were evaluated by proliferation kinetic and ultrastructural analyzes. Thus, labeled cells were infused into striatum of adult male rats of animal model that mimic late onset of Parkinson's disease and, after 15 days, it was observed that cells migrated along the medial forebrain bundle to the substantia nigra as hypointense spots in T2 magnetic resonance imaging. These data were supported by short-term magnetic resonance imaging. Studies were performed in vivo, which showed that about 5 × 10⁵ cells could be efficiently detected in the short term following infusion. Our results indicate that these labeled cells can be efficiently tracked in a neurodegenerative disease model.
Keywords: mesenchymal stem cells, multimodal iron oxide nanoparticles, Rhodamine, magnetic resonance imaging, Parkinson's disease
Introduction
Mesenchymal stem cells from umbilical cord blood (UC-MSC) can be isolated from Wharton’s jelly, and these cells proliferate faster, have good ex vivo expansion capability, and may be better tolerated following infusion.1,2 UC-MSC can be induced to differentiate into osteoblasts, chondrocytes, and adipocytes,3 and recent studies have shown that an infusion of UC-MSC can promote regeneration of injured/ischemic tissue, neuroprotection resulting in improved mobility in experimental models of traumatic spinal cord injury,4 cerebral global ischemia,5 and Parkinson’s disease.6 Therefore, infusion of these cells has been considered as a potential therapeutic strategy for treating patients with central nervous system injury and neurodegenerative disease.2
Neurodegenerative diseases are characterized by selective neuronal vulnerability and neurodegeneration in specific regions of the brain.7 These diseases affect the gray matter of the central nervous system, mainly by progressive loss of neurons with associated secondary changes in the white matter tracts, causing irreversible destruction of nervous tissue.7,8
In vivo studies have demonstrated a stem cell treatment approach to enhance neuroprotective mechanisms and to induce neuroregeneration in some types of neurodegenerative disease.9 Thus, use of these cells might be beneficial in cell therapy protocols for neurodegenerative and neurovascular diseases, but requires an effective method to detect infused UC-MSC in vivo.
Cell tracking in vivo is an important methodology in the development of successful stem cell therapies. Magnetic resonance imaging (MRI) is used to track the infused stem cells, because of its ability to track these cells noninvasively for long periods of time.10,11 Cellular MRI involves labeling of stem cells with magnetic contrast agents to enable tracking of their migration and distribution in tissues, whereas for molecular MRI, magnetic contrast agents are functionalized with ligands (eg, antibodies) that specifically target molecular markers.12
Superparamagnetic iron oxide nanoparticles (SPIONs)13 have been widely used for labeling of stem cells and development of diverse functional analysis in biomedical research.14 Labeling cells with SPION enables detection of single or clustered labeled cells within target tissues following direct infusion or intravenous injection, as well as quantification of the amount of iron internalized per cell.15 Quantification of the approximate number of magnetically labeled cells within a voxel may provide an effective and efficient method for monitoring and optimizing cellular therapies.15
Recent advances in nanotechnology and biotechnology have contributed to the development of multifunctional nanoparticles.12 There are different types of multimodal nanoparticles available, which can be characterized as bimodal (two properties) or trimodal (three properties), and they may have magnetic, fluorescent, nuclear, and bioluminescent properties.16–18 Nanoparticles labeled with Rhodamine-B (Rh-B), a fluorescent dye that can be visualized by both MRI and fluorescent imaging, is an example of multimodal iron oxide nanoparticles (MION) with magnetic and fluorescent properties.11,19,20
Multimodal imaging may be a powerful tool for in vivo studies of stem cell homing and injured tissue regeneration by fluorescence techniques.11,19 This is because MIONs are not only nontoxic, but they also do not cause cell cycle arrest or changes in morphology or phenotype, and are visible by MRI and optical imaging without the requirement for invasive methods.11,19
In this study, we report the development and validation of an efficient in vitro protocol for labeling of UC-MSC with MION conjugated to Rh-B (MION-Rh). We optimized the best concentration of MION-Rh and UC-MSC, achieving robust labeling of these cells in vitro without impairing their functional properties. We also quantified the internalized iron content of UC-MSC by MRI, including number of MION-Rh per cell, as well as the amount of iron loaded per cell at various labeling concentrations and after several days in culture. The effect of intracellular MION-Rh on cell viability and proliferative capacity was also evaluated. In vivo MRI combined with fluorescence and cytology demonstrated that the infused labeled cells could be efficiently tracked in a neurodegenerative disease model.
Materials and methods
Umbilical cord sample collection, isolation, and culture of MSC
Five umbilical cord samples were collected after obtaining the donor mother’s informed consent in accordance with the ethics committee for research at the Instituto Israelita de Ensino e Pesquisa Albert Einstein (São Paulo, Brazil). The samples of umbilical cord were processed and cultured in the manner previously described by Sibov et al.21 After 3 weeks, with a medium change every other day, MSC with fibroblast morphology became the predominant cells in culture. UC-MSC were characterized by differentiation in three mesodermal lineages and by flow cytometry, as previously reported.21,22 All experiments were performed in the fourth cell passage.
MION characteristics
The MION (BioPAL Inc, Worcester, MA, USA) used for labeling the UC-MSC had an 8 nm magnetic core with a hydrodynamic size of 35 nm, a zeta potential of −31 mV, and an iron concentration of 2 mg/mL. These nanoparticles exhibit fluorescent properties when conjugated with Rh-B. The wavelength of excitation for Rh-B is 555 nm and the emission wavelength is 565–620 nm.
Stability of MION-Rh in culture medium
A study of the stability of MION-Rh was performed in Dulbecco’s Modified Eagle’s Medium-Low Glucose (DMEM-LG) and Roswell Park Memorial Institute (RPMI) 1640 (Gibco, Invitrogen Corporation, Carlsbad, CA, USA) supplemented with 10% fetal bovine serum (Gibco). These types of culture media were chosen because they are often mentioned as being used in the cell labeling process in the literature.23,24 This study was done using the dynamic light scattering technique, which measures the hydrodynamic size of MION-Rh over time with a Zetasizer NanoS (Malvern Instruments, Malvern, UK). Characterization of the hydrodynamic size distribution was obtained at an angle of 173° in manual mode with the number of averages at 20. Measurements were performed in a fixed position and at 37°C with a 60-second equilibrium period. We used 2 mL of each culture medium at an iron concentration of 5, 20, 40, 80 and 100 μg/mL, and 2 mL of Milli-Q® water (EMD Millipore Corporation, Bedford, MA, USA) with an iron concentration of 100 μg/mL in the control group. Hydrodynamic size measurements were done at different time points over a 20-hour period. Analysis of hydrodynamic size was performed using the CONTIN algorithm.25
In vitro evaluation of labeled UC-MSC
UC-MSC labeling was carried out in three phases. First, we standardized the best MION-Rh concentration for labeling UC-MSC; second, we proceeded to the UC-MSC titration; and third, we evaluated the labeling intensity over time.
UC-MSC labeling with different MION-Rh concentrations in vitro
Approximately 105 UC-MSC were plated in 75 cm2 culture bottles. When the UC-MSC reached 80%–90% confluence, they were incubated overnight (for approximately 18 hours at 37°C, 5% CO2) in 10 mL of culture medium, with MION-Rh added at the following concentrations: 0, 10, 20, 40, 80, and 100 μg Fe/mL. After incubation, the culture medium solution was removed and the UC-MSC were washed twice with phosphate-buffered saline to remove extracellular MION-Rh. The labeled UC-MSC were treated with 0.25% Tryple Express, and then harvested and manually counted using 0.4% Trypan Blue (Gibco).
MION-Rh labeling with different UC-MSC concentrations
Different UC-MSC concentrations (104, 105, 5 × 10⁵, and 106 cells) were incubated overnight (for about 18 hours at 37°C, 5% CO2) in 10 mL of culture medium with a standardized concentration of 40 μg of MION-Rh. After incubation, the culture medium solution was removed and the UC-MSC were washed twice with phosphate-buffered saline to remove extracellular MION-Rh. The labeled UC-MSC were treated with 0.25% Tryple Express, and then harvested and manually counted using 0.4% Trypan Blue.
UC-MSC labeling with MION-Rh over time
UC-MSC at a standardized cell concentration (5 × 10⁵) were incubated overnight (for about 18 hours at 37°C, 5% CO2) in 10 mL of culture medium with 40 μg of MION-Rh. After incubation, the culture medium solution was removed and the UC-MSC were washed twice with phosphate-buffered saline to remove extracellular MION-Rh. The labeled UC-MSC were treated with 0.25% Tryple Express on days 2, 5, 7, 12, 15, and 19, and then harvested and manually counted using 0.4% Trypan Blue.
MRI phantom analyses
The agarose phantom assay was performed to study MRI detection sensitivity. To this end, samples from UC-MSC were labeled with different MION-Rh concentration, and the determined MION-Rh concentration was labeled with different amounts of UC-MSC. A control sample for each cell concentration, without labeling, was also tested. In addition, samples with the same amount of UC-MSC and MION-Rh were tested over time. All tests were performed in duplicate. Next, after being harvested as described above, these labeled cells were homogenously suspended in 2% UltraPureTM Agarose (Invitrogen Corporation).
Imaging sequence
The relaxometry characteristics of the phantom were evaluated by a whole-body 3-T MRI scanner with a wrist coil (Magnetom Vision®, Siemens, Erlangen, Germany), using the T2 multicontrast turbo-spin echo sequence with a TR of 1,700 msec, a TE of 8–256 msec, eight echos, field of view 300 mm, matrix 256 × 256, slice thickness 3.0 mm, and flip angle 180°. Except for the cultures with MION-Rh added, the control cells were processed identically. The MION-Rh relaxation times were measured for different samples. The T2 relaxation time of each nanoparticle sample was obtained by adjusting the decay curve using a monoexponential linear algorithm, ie, intensity = C1exp (−TE/T2). The magnetic resonance signal intensities from different areas were determined by measurement of regions of interest.
Quantification of MION-Rh internalized within UC-MSC by MRI
The internalized iron content in UC-MSC was quantified by MRI. In assays mentioned above, the in vitro evaluation by MRI of UC-MSC labeled with MION-Rh, is described. The average T2 values for labeled and unlabeled UC-MSC were calculated from the MRI images obtained by placing a circular region of interest in the sample measuring 2 mm2. The analysis was performed using routine computational MRI equipment. The iron content in the labeled UC-MSC was determined using the following equation:26,27
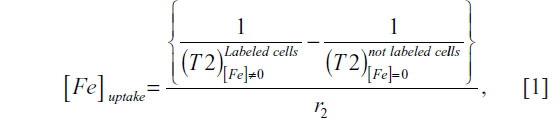
where [Fe]uptake is the concentration of intracellular iron on agarose gel, 1/T2 is the transverse relaxation rate proportional to the intracellular iron concentration, and r2 is the transverse relaxivity contrast agent determined by the slope of the linear fit of the transverse relaxation rate versus iron concentration. For the calculation of r2 concentrations of 1, 2.5, 5, 7.5, 10, 15, 20, 25, and 30 μg/mL of MION-Rh were used, which were dispersed in the agarose.28 The uncertainty of the iron concentration was determined by:
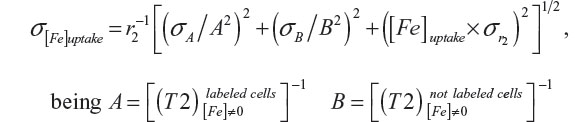
with their corresponding uncertainties σA and σB, and the uncertainty of r2 and  .
.
Intracellular detection of MION-Rh in labeled UC-MSC
The labeled UC-MSC were washed twice with phosphate-buffered saline and fixed with 4% paraformaldehyde. Next, the Prussian Blue method (Perls’ acid ferrocyanide) was used to detect iron within the labeled cells. The cells were treated with 5% potassium ferrocyanide (Sigma-Aldrich, St Louis, MO, USA), 5% hydrochloric acid (Merck, Darmstadt, Germany), and basic fuchsin (Sigma-Aldrich) for 5 minutes. This treatment induces reduction of ferric iron to the ferrous state with formation of a blue precipitate. The cells were then washed twice with phosphate-buffered saline and analyzed by light microscopy. Subsequently, fluorescence analysis was done using diamidino-2-phenylindole (DAPI, Sigma-Aldrich) to label the cell nuclei and an Rh-B filter (530 nm and 550 nm) to detect the MION-Rh. Both analyses were performed using a fluorescence microscope (IX51 Olympus, Tokyo, Japan).
Transmission electron microscopic analysis of MION-Rh-labeled UC-MSC
An ultrastructural analysis was performed to observe the subcellular localization of MION-Rh in UC-MSC. The pellets of labeled cells were fixed directly in 0.5% glutaraldehyde fixative solution, following the standard procedures used for transmission electron microscopy. The meshes were analyzed and photographed under a CM100 transmission electron microscope (Philips, Eindhoven, The Netherlands).
Kinetics of proliferation labeling with MION-Rh
Approximately 5 × 10⁴ UC-MSC labeled with MION-Rh were incubated in triplicate at iron concentrations of 10, 30, 50, 80, and 100 μg/mL, followed by two phosphate-buffered saline washes. The cells were kept in the incubator at 37°C and 5% CO2 for 5 days. Next, triplicates of each concentration were washed with phosphate-buffered saline and the labeled UC-MSC were harvested with 0.25% Tryple Express. The labeled UC-MSC were resuspended and quantified manually using Trypan Blue. Total of cells from each point in the curve was expressed by mean in triplicates.
Differentiation capacity of MION-Rh-labeled UC-MSC
To evaluate the differentiation ability of MION-Rh-labeled UC-MSC, the cells were subjected to adipogenic and osteogenic differentiation in vitro according to the method described by Sibov et al.22 Labeled cells were plated at a density of 104 cells/cm2 in a six-well culture plate. Eighty percent confluence was achieved in the induction medium (DMEM-LG), which was changed every other day until 21 days, for both differentiation assays. The adipogenic culture medium contained insulin 10 μg/mL (Sigma-Aldrich), indomethacin 100 μM (Sigma-Aldrich), dexamethasone 1 μM (Sigma-Aldrich), and 3-isobutyl-1-methyl-xanthine 100 μg/mL (Sigma-Aldrich) in Minimum Essential Medium Alpha Medium powder (Gibco/ Invitrogen) with 10% fetal bovine serum. The labeled cells were fixed with 4% paraformaldehyde and stained with 0.3% Oil-red-O (Sigma-Aldrich), according to the method described by Sibov et al.22 The osteogenic culture medium contained 1 μM dexamethasone (Sigma-Aldrich), 2 μg/mL ascorbic acid (Sigma-Aldrich), and 10 mM beta-glycerophosphate (Sigma-Aldrich). Thereafter, the cells were fixed with paraformaldehyde 4% and stained with Alizarin Red (Sigma-Aldrich), according to the method previously reported by Sibov et al.22 The morphology of the cells was imaged using an inverted microscope.
In vivo evaluation of labeled UC-MSC
A rodent model of Parkinson’s disease was established by creating a unilateral lesion by stereotaxic injection of 6-hydroxydopamine (Sigma-Aldrich). The stereotaxic surgery was conducted as described by Gomes et al.29 Wistar rats (200–240 g) were anesthetized with a solution of ketamine/xylazine (0.15 mL/100 g body weight of a solution containing ketamine 10% and 70 μL of xylazine 2%) and submitted to stereotaxic injections with 6-hydroxydopamine 16 μg in 3 μL (of saline containing 0.05% ascorbic acid) into the right medial forebrain bundle, according to the following coordinates: anteroposterior −4.4 mm, medial-lateral +1.2 mm, and dorsal-ventral −8.2 mm in relation to bregma.30 On day 28 after the stereotaxic procedure, the animals were injected with stem cells on the right side of the dorsolateral striatum, according to the following coordinates: anteroposterior +0.7 mm, medial-lateral +3.0 mm, and dorsal-ventral −4.5 mm in relation to bregma. The stem cells was slowly injected (0.2 μL per minute) unilaterally into the adult rat striatum using a 10 μL Hamilton syringe mounted on a stereotactic apparatus (David Kopf Instruments, Tujunga, CA, USA).
Results
Morphologic and immunophenotypic features of UC-MSC
UC-MSC were effectively isolated and expanded as primary cultures. The cells had a fibroblast-like or spindle-shaped morphology and reached 80%–90% confluence after 7 days of culture (Figure 1A and B). Immunophenotypic profiling of isolated UC-MSC showed that the cells expressed high levels of MSC markers (CD29, CD73, CD90, CD105, and CD166) and low levels or absence of hematopoietic markers (CD14, CD34, CD45) and human leukocyte antigens (HLA)-DR (Figure 1C), as already shown in earlier work by our group.21,22
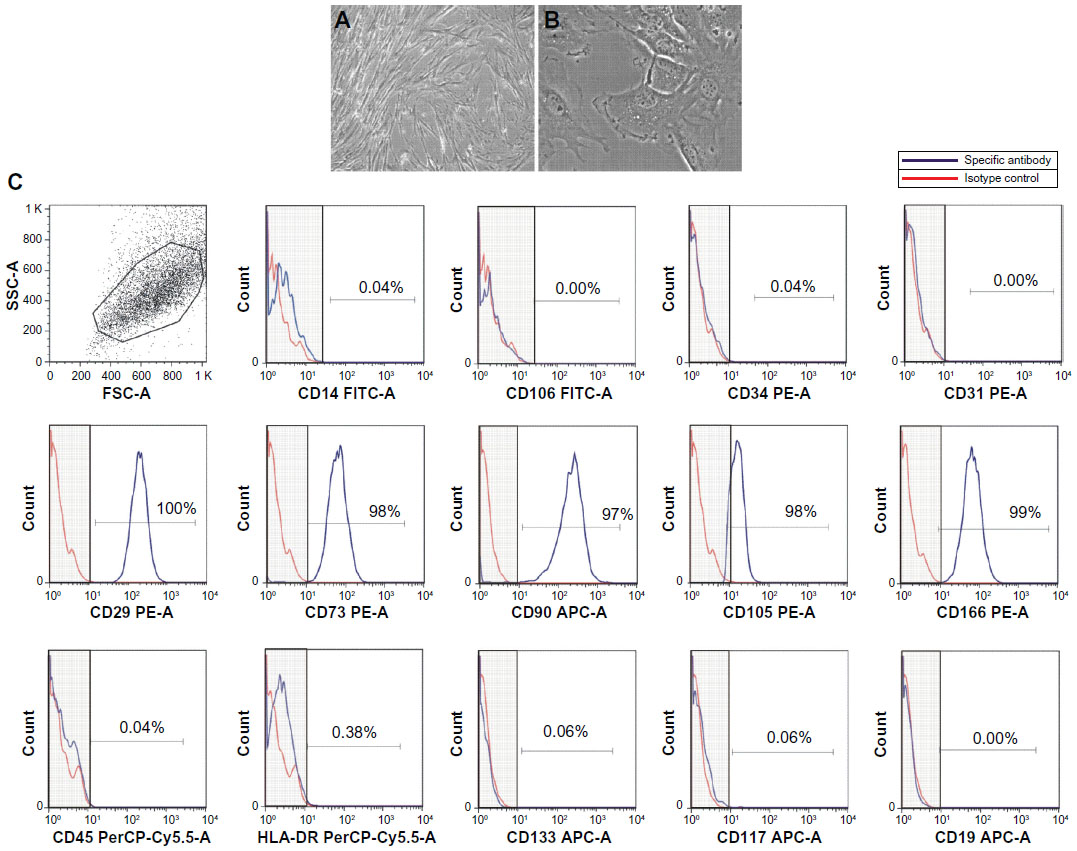 | Figure 1 Morphologic and immunophenotypic characterization of UC-MSC. (A and B) UC-MSC on the fourth passage with fibroblast-like spindle-shaped morphology, 80% confluent; 200× and 400×, respectively. (C) Immunophenotypic analyses showed that the UC-MSC expressed CD29, CD73, CD90, CD105, and CD166, did not express CD14, CD106, CD34, CD31, CD45, CD133, CD117, or CD19, and had low levels of HLA-DR. |
Stability of MION-Rh
Knowledge of the physicochemical characteristics of SPION is essential to increase the efficacy of SPION-based therapies. SPION uptake by cells may depend on the SPION coating, the surrounding medium, and SPION aggregation behavior. The colloidal stability of MION-Rh in two different environments was investigated by dynamic light scattering, which measures variation in hydrodynamic size over time. We identified that the agglomeration properties of MION-Rh were maintained over time, and that the hydrodynamic size was around 40 nm for all MION-Rh concentrations (5, 20, 40, 80, and 100 μg/mL) and for both types of culture medium tested (DMEM-LG and RPMI 1640 supplemented with 10% fetal bovine serum), as shown in Figure 2. MION-Rh suspended in water was used as a control sample.
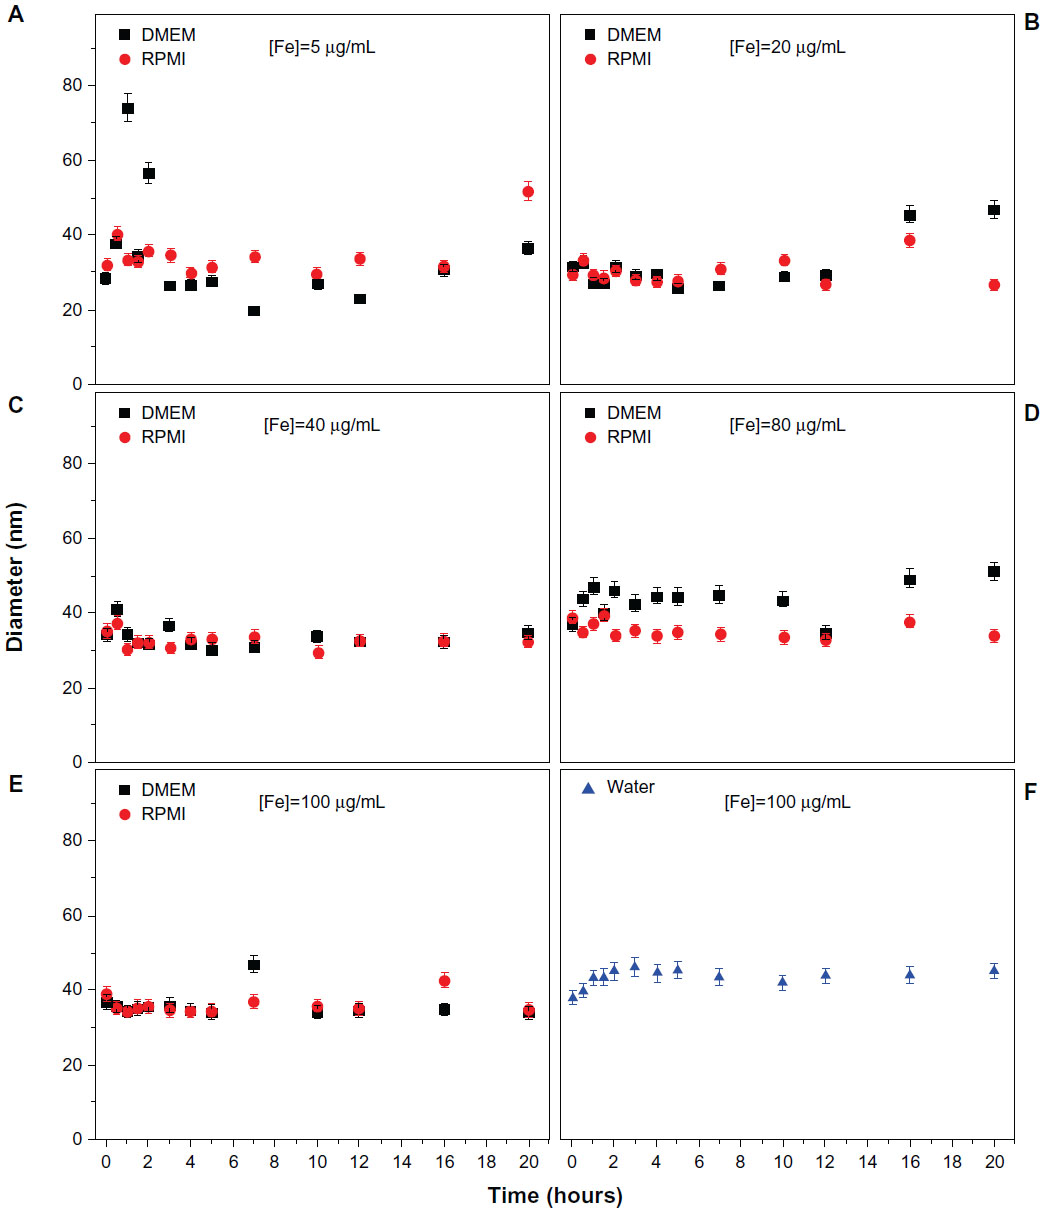 | Figure 2 Measures of hydrodynamic size variability of MION-Rh from 0 to 20 hours. MION-Rh dispersed in DMEM-LG and Roswell Park Memorial Institute (RPMI) 1640 culture medium at iron concentrations of (A) 5 μg/mL, (B) 20 μg/mL, (C) 40 μg/mL, (D) 80 μg/mL, and (E) 100 μg/mL. (F) MION-Rh suspended in water at an iron concentration of 100 μg/mL (control sample). |
Qualitative analysis and viability of MION-Rh labeled UC-MSC
A qualitative evaluation of the intracellular distribution of MION-Rh in UC-MSC was performed by cytochemical assessment using Prussian blue and light microscopy using basic fuchsin. We observed the internalized MION-Rh as blue granules with intracellular localization (Figure 3Ac, Ae, Ag, Ai, and Al), whereas the unlabeled cells (control) did not show the presence of intracellular blue granules (Figure 3Aa). The intracellular distribution of MION-Rh in UC-MSC was also observed by fluorescence assay, and small fluorescent red clusters colocalized with the blue granules were observed on cytochemical assessment (Figure 3Ad, Af, Ah, Aj, and Am). Ultrastructural analysis revealed the presence of electron-dense clusters on the surface of the UC-MSC labeled with MION-Rh (Figure 3Cb and Cc), that were also scattered in the cytoplasm (Figure 3Cb and Cc); these results were also observed on fluorescence microscopy (Figure 3Ce). Electron-dense clusters were not seen in the UC-MSC control, which did not receive the MION-Rh (Figure 3Ca). Figure 3Cd and Cf show the process of internalization of the UC-MSC labeled with MION-Rh, as well as invaginations of the plasma membrane and subsequent formation of pinocytic vesicles as a result of endocytosis. Labeled UC-MSC with MION-Rh viability was evaluated based on kinetics of cellular proliferation (Figure 3D). Cells labeled with MION-Rh at different concentrations did not differ from the control cells with regard to their proliferative capacity (Figure 3D).
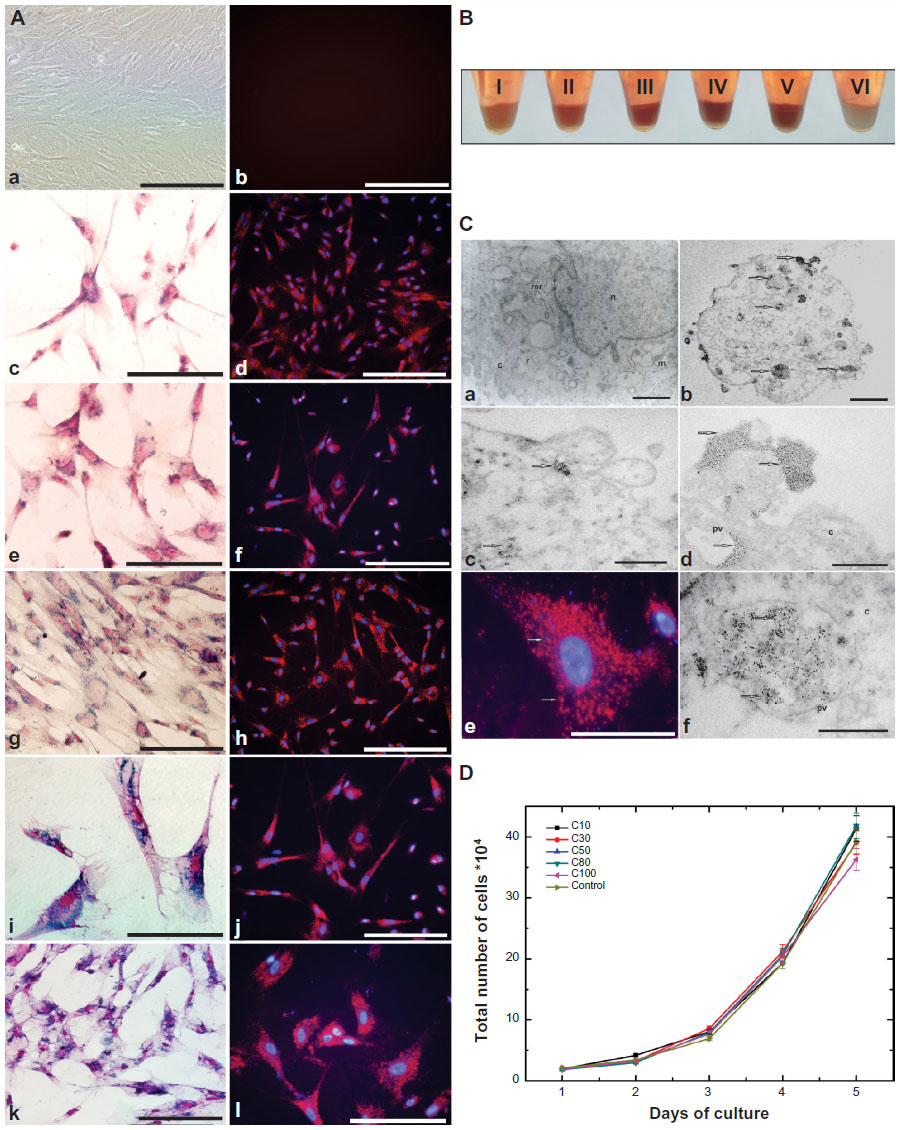 | Figure 3 (A) UC-MSC labeling with MION-Rh. (a) Without UC-MSC labeling (control sample) 100×; (b) Control of fluorescence microscopy; (c, e, g, i and j) Prussian Blue and basic fuchsin of UC-MSC labeling with MION-Rh at Rh-B concentrations of 10, 20, 40, 80, and 100 μg/mL, respectively (c) and (e) 200×; (g) and (k) 100×; (i) 400×. (d, f, h, j and l) Fluorescence microscopy and DAPI of UC-MSC labeling with MION-Rh at Rh-B concentrations of 10, 20, 40, 80, and 100 μg/mL, respectively. (d, f and h) 100×; (j and l) 200×. (a, b, d, e, f, g, h, j and k) scale bars, 400 μm. (c, i and l) scale bars, 800 μm. (B) Pellets of UC-MSC labeling with MION-Rh at Rh-B concentrations of 10 (I), 20 (II), 40 (III), 80 (IV), and 100 (V) μg/mL and unlabeled UC-MSC (control sample, VI). (C) Transmission electron microscopic analysis of UC-MSC labeling with MION-Rh. (a) UC-MSC of control group. (b, c and d) Scale bars, 0.5 μm. (f) Scale bars 1 μm. n, nucleus; mi, mitochondria; pv, pinocytic vesicle; rer, rough endoplasmic reticulum; arrow, electron-dense nanoparticles (MION-Rh). (D) Kinetic proliferation of labeled UC-MSC with MION-Rh. Proliferation curve of labeled cells in triplicate at iron concentrations of C10 (10 μg/mL), C30 (30 μg/mL), C50 (50 μg/mL), C80 (80 μg/mL), and C100 (100 μg/mL). |
In vitro assessment of optimal MION-Rh and cell concentration using MRI
The T2 proton relaxation times of labeled UC-MSC with different MION-Rh and cell concentrations were obtained by MRI. The intensity curves associated with the contrast of characteristic T2 images are shown in Figure 4A and B. The data obtained by MRI were consistent with the different iron concentrations of the MION-Rh (10, 20, 40, 80, and 100 μg/mL), which can also be observed in the pellets of the labeled cells (Figure 4A). We then chose the 40 μg/mL iron concentration, considering the curve intensity and the respective T2 values (Figure 4A). Subsequently, cells labeled with an iron concentration of 40 μg/mL were analyzed at different UC-MSC concentrations (104, 105, 5 × 10⁵, and 106). The 5 × 10⁵ cell concentration was selected due to its good contrast (Figure 4C). The T2 values obtained from fitting the experimental data to the characteristic functions and the relaxation rate (R2) are shown in Figure 4B and D.
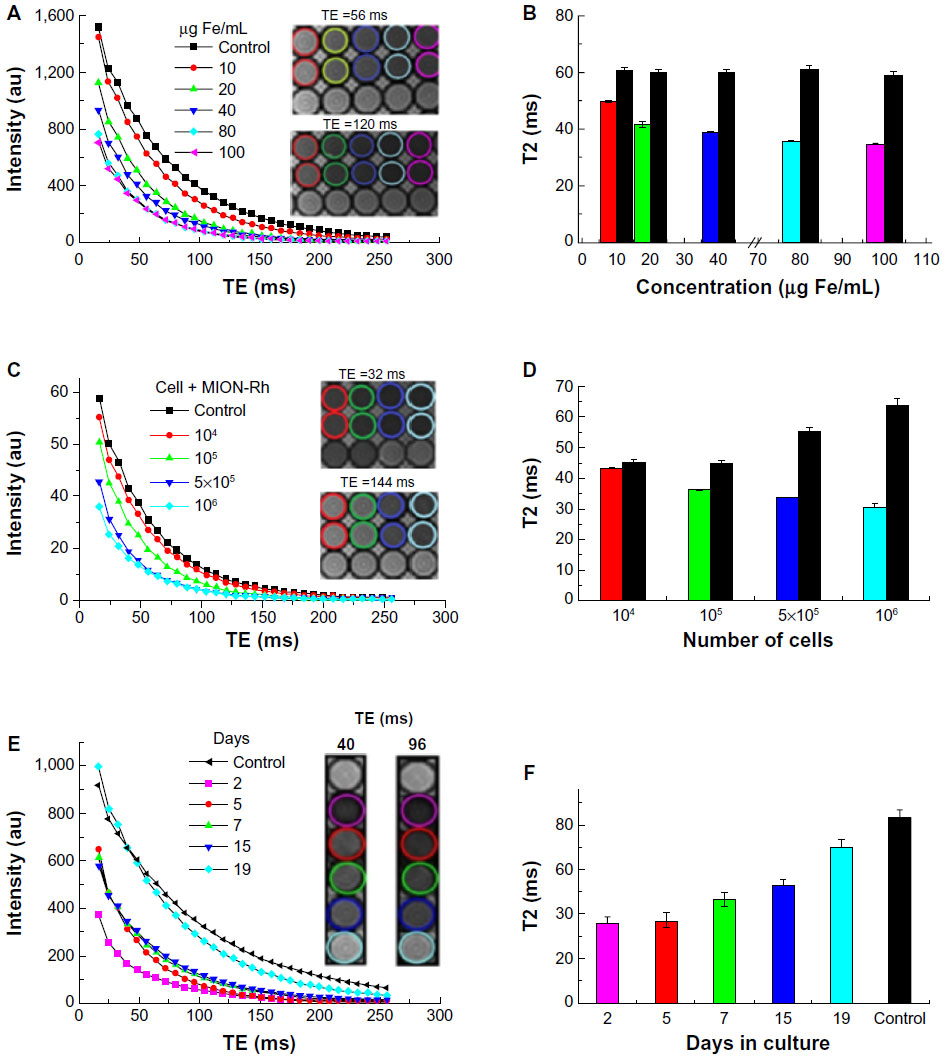 | Figure 4 (A) UC-MSC labeled with different concentrations of MION-Rh (10, 20, 40, 80, and 100 μg/mL). Intensity curves versus TE representative of the transverse relaxation obtained from the analysis of the phantom magnetic resonance images. The inset shows the T2-weighted phantom magnetic resonance image obtained by the se_mc sequence at a TR of 3,000 msec, a TE of 56 msec, and a TE of 120 msec. (B) T2 versus iron concentration of UC-MSC labeled with MION-Rh and unlabeled UC-MSC (control). The T2 times of each curve were calculated by fitting to the experimental data. (C) Different cellular concentrations: 104, 105, 5 × 10⁵, and 106 UC-MSC labeled with 40 μg/mL of MION-Rh. Intensity curves versus TE are representative of the transverse relaxation obtained from analysis of the phantom magnetic resonance images. The inset shows the T2-weighted phantom magnetic resonance image obtained by the se_mc sequence at a TR of 3,000 msec, a TE of 32 msec, and a TE of 144 msec. (D) T2 versus number of UC-MSC labeled with MION-Rh and unlabeled UC-MSC (control). The T2 times for each curve were calculated by fitting to the experimental data. (E) 5 × 10⁵ UC-MSC labeled with 40 μg/mL MION-Rh over 19 days. Intensity curves versus TE representative of the transverse relaxation obtained from analysis of the phantom magnetic resonance images. The inset shows the T2-weighted phantom magnetic resonance image obtained by the se_mc sequence at a TR of 3,000 msec, a TE of 40 msec, and a TE of 96 msec. (F) T2 versus days in culture for UC-MSC labeled with MION-Rh and unlabeled UC-MSC (control) over 19 days. The T2 times for each curve were calculated by fitting to the experimental data. |
Sensitivity evaluation by MRI of labeled cells over time: in vitro
UC-MSC (5 × 10⁵) labeled with a MION-Rh concentration containing 40 μg iron per mL were analyzed for their detection sensitivity by MRI over 2, 5, 7, 12, 15, and 19 days. The T2 proton relaxation times for the labeled UC-MSC were obtained by MRI analysis. The intensity curves of relaxation associated with images of cells labeled with MION-Rh obtained by MRI, decreased over days (shown in Figure 4E). Data obtained by MRI show that the T2 values gradually increased over 19 days of assay (Figure 4F) and thus the contrast decreased as shown in Figure 4E. We observed no significant changes in contrast between the second and fifth day of assay. Between days 5 and 19, we noticed a gradual decrease in contrast and an increase in T2 values. On day 19, there was a considerable loss of contrast compared with the control sample (Figure 4E), demonstrating the decrease in the amount of MION-Rh internalized into cells.
Quantification of MION-Rh in labeled cells
Quantification of magnetically labeled cells may be an effective and efficient method for monitoring and optimizing cellular therapies. In this part of the study, quantification of the MION-Rh internalized by UC-MSC was performed by relaxometry.
A quantitative study of the internalized MION-Rh according to concentration is shown in Figures 4A, B, 5A, and B, with calculations made from the respective relaxometry curves (Figure 4A) and the T2 values (Figure 4B). We observed that the highest concentration of MION-Rh used for labeling the UC-MSC had the lowest T2 value when compared with the corresponding control (Figure 4B).
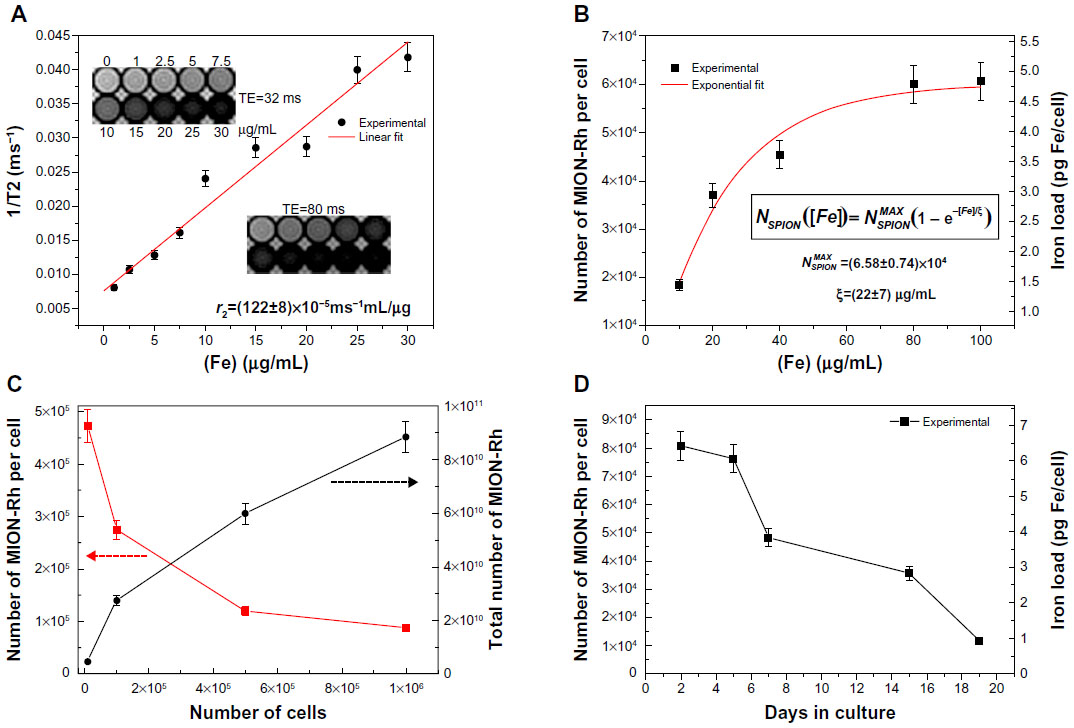 | Figure 5 (A) Representative graph for r2 calculation. (B) MION-Rh uptake per cell depending on total concentration of internalized iron. (C) Ratio of MION-Rh uptake per cell to total number of MION-Rh for the different cell concentrations. (D) MION-Rh uptake per cell according to the concentration of internalized iron over 19 days in culture. |
T2 values for unlabeled and labeled UC-MSC and the calculated r2 value (Figure 5A) were used to determine the number of MION-Rh per cell. UC-MSC showed uptake saturation when the iron concentration reached 100 μg/mL, ie, up to 6.06 × 10⁴ MION-Rh per cell (4.83 pg Fe per cell).
The load dependence of iron internalized into cells NSPION ([Fe]) according to iron concentration ([Fe]) is given by:31

where  is the maximum number of SPION that could be internalized by cells, and ξ is a constant characteristic of SPION incubation concentration and internalized SPION number, equivalent to 63% internalization of the maximum number of SPION. The exponential fit of the experimental data in Figure 5B using relationship [2] was = (6.58±0.74) × 104 and ξ =(22±7) μg/mL.
After the internalization study of MION-Rh, the MION-Rh intracellular internalization study was performed due to incubation concentration, according to the number of cells maintaining a constant MION-Rh concentration (40 μg Fe per mL), as seen in Figures 4C, 4D, and 5C.
Relaxometry curves (Figure 4C) were used to calculate the corresponding T2 values (Figure 4D). In Figure 5C, we can observe that the internalized number of MION-Rh per cell is inversely proportional to the labeled cells, and that the total number of internalized MION-Rh is directly proportional to the labeled cells. This is confirmed by the decrease in T2 values (Figure 4D) when compared with the control samples.
Figures 4E, F, and 5D show the intracellular labeling over time. T2 values obtained from the relaxation curves (Figure 4E) over the days in culture showed a temporary increase. Figure 5D indicates a decreasing number of MION-Rh (iron load) per cell over the days in culture, which was possibly associated with the proliferation and elimination of MION-Rh by the cells.15
Labeled cell differentiation
We assessed the differentiation potential of UC-MSC labeled with MION-Rh using culture medium containing adipogenic and osteogenic lineage-specific induction factors. The differentiation capacity of these cells was confirmed after 21 days in culture and could be demonstrated by the Oil Red and Alizarin Red cytochemical assays (Figure 6). Unlabeled cells were used as a control (Figure 6A and B). Labeled cells differentiated in adipocyte-like cells showed the presence of lipid droplets, shown in red in adipogenic differentiation, as observed by the Oil Red staining (Figure 6C), while non-differentiated labeled cells (negative control) did not show the presence of lipid droplets (Figure 6D). Unlabeled cells were used as a control (Figure 6E and F), and labeled cells differentiated into osteoblast-like cells showed calcium on the extracellular matrix, also in red, as observed by the Alizarin Red assay (Figure 6G), while non-differentiated labeled cells (negative control) did not show the presence of calcium (Figure 6H).
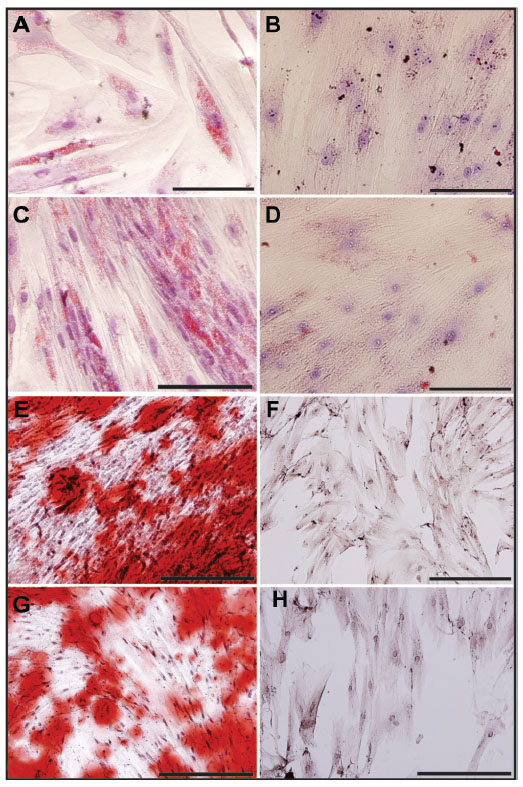 | Figure 6 Differentiation process of MION-Rh-labeled UC-MSC and nonlabeled UC-MSC. (A) Nonlabeled UC-MSC differentiated in adipocyte-like cells, 400×; (B) nondifferentiated nonlabeled cells (negative control), 400×; (C) labeled cells differentiated in adipocyte-like cells, 400×; (D) nondifferentiated labeled cells (negative control), Oil Red stained, 400×; (E) nonlabeled UC-MSC differentiated in osteoblast-like cells, 400×; (F) nondifferentiated nonlabeled cells (negative control), 400×; (G) labeled cells differentiated in osteoblast-like cells, 400×; and (H) nondifferentiated labeled in osteoblast-like cells (negative control), Alizarin red stained, 400×. Scale bars, 800 μm. |
UC-MSC labeled with MION-Rh tracking in an animal model using MRI
After establishing a protocol for efficient UC-MSC labeling, we analyzed whether UC-MSC labeled with MION-Rh could home to a brain-injured region in an animal model of Parkinson’s disease. A fraction of 5 × 10⁵ MION-Rh-labeled UC-MSC was slowly injected unilaterally into the striatum (Figure 7A–D and O) of an adult Wistar rat, which then migrated along the medial forebrain bundle (Figure 7E–H) to the substantia nigra (Figure 7I–M and Q). Immunofluorescence analyses performed on adjacent sections were confirmed by Prussian Blue staining (Figure 7D, H, and M). The contralateral area served as the negative control for the tracking study, since UC-MSC labeling with MION-Rh was not present. Fifteen days after MION-Rh-labeled UC-MSC implantation, cells were detectable at the injection sites (Figure 7N and O) and in the substantia nigra region (Figure 7P and Q) as hypointense spots on T2 MRI.
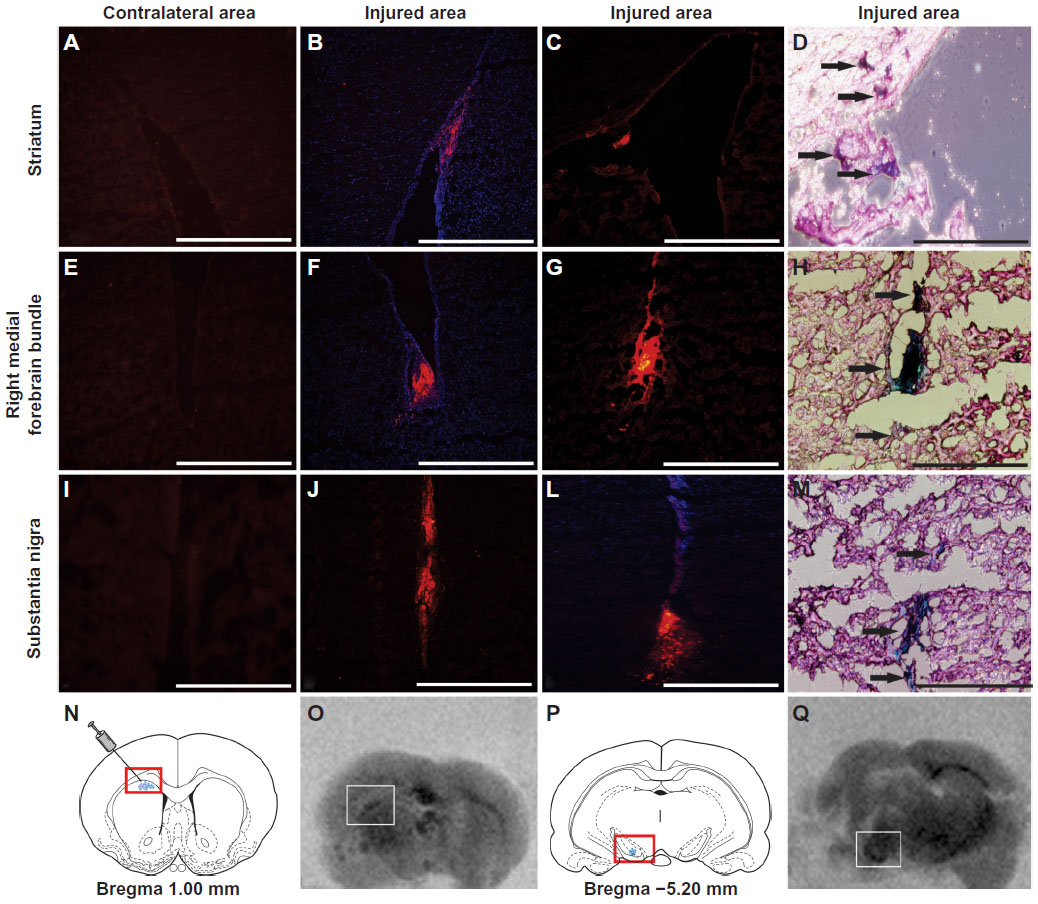 | Figure 7 Detecting the homing in vivo of MION-Rh labeled UC-MSC by immunofluorescence (A, B, C, E, F, G, I, J and L), Prussian Blue staining, (D, H and M) and magnetic resonance imaging (O and Q). MION-Rh labeled UC-MSC were detected within the striatum (A, B, C, D and O), medial forebrain bundle (E, F, G and H), and nigra substance region (I, J, L, M and Q). Immunofluorescence analysis performed on adjacent sections using an antibody against a human nuclear protein (A, B, C, E, F, G, I, J and L) confirmed by Prussian Blue staining (arrows; D, H and M). Schematic rat brain map of striatum (N) and nigra substance (P) region, modified from Paxinos and Watson, 1998.30 T2 weighted magnetic resonance imaging (MRI) images (O and Q) were performed at 39 days post injection. Scale bars, 800 μm. |
Discussion
UC-MSC can be isolated in high yields and expanded in vitro using simple protocols. The plasticity of these cells, as well as their multipotent and immunomodulatory properties, makes them an attractive cell source for stem cell-based therapy, although their biological mechanisms in vivo are as yet unclear.11 These cells may act via paracrine mechanisms and secrete multiple factors that can regulate endothelial and epithelial cell permeability, decrease inflammation, and enhance tissue repair.32 Hence, tracking UC-MSC in individuals with regard to cell distribution, migration, and differentiation is important for the development of therapeutic protocols.11
SPION are promising contrast agents for tracking stem cells by MRI in several types of diagnostics and therapy,33 and are suitable for labeling cells to allow them to be repeatedly imaged within the tissue by MRI after infusion.34 Commercially available SPION consist of particles coated with, for example, polyamines, polysaccharides, or polymers, with high negative charges that have been widely used to label cells.34 When used alone, however, SPION do not efficiently label nonphagocytic cells unless the surface charge on the SPION is modified. Therefore, polycationic transfection agents should be used to enhance membrane permeability.34 However, MION-Rh does not require a polycationic transfection agent to be internalized efficiently by UC-MSC,19 and does not affect the viability or proliferative capacity of UC-MSC, as shown in Figure 3.
The colloidal behavior of SPION in different types of culture medium is almost never considered to be related to particle-cell interactions.35 The study of SPION aggregation in different types of cell medium is important for evaluation of aggregate sizes that may influence the biological function of SPION in vitro36 and in vivo.37 Therefore, this study initially assessed the stability of MION-Rh in two different types of culture medium used for UC-MSC labeling (Figure 2). We found that MION-Rh showed no important agglomeration, and there was no change in the mean size of MION-Rh in either of the investigated types of culture medium (DMEM-LG and RPMI) over 20 hours (Figure 2). Accordingly, we suggest that MION-Rh dispersion has little influence on the stability of MION-RH in culture medium, where there is a slight imbalance of forces, such as attractive Van der Waals forces and repelling electrostatic and steric forces, which interact among MION-Rh,38 ensuring the uptake efficiency of MION-Rh.20 Thus, it seems likely that uptake of SPION depends on their size, and the aggregation resulting from the interacting forces between the SPION coating and the medium may determine the uptake efficiency.39 Here we evaluated the colloidal stability of MION-Rh in both DMEM-LG and RPMI 1640 because these particles remain stable in both types of medium; however, DMEM-LG is the most often cited in the literature, so we chose to continue the experiments using DMEM-LG.23–25
The labeling efficacy or “MION-Rh wrapping” by UC-MSC is highly dependent on interactions between SPION and cell membranes.40 These interactions can be influenced by targeting agents (eg, antibodies), cell receptors, coating properties (eg, charge and hydrophobicity/hydrophilicity), and a negative charge on the cell membrane.23 Furthermore, the physical and chemical properties of SPION, including particle size, surface charge, roughness, and surface curvature are involved in the endocytosis/labeling process.41
There are many distinct endocytic pathways in mammalian cells. These pathways are best defined according to their differential dependency on certain lipids and proteins, including clathrin, caveolin, flotillin 1, GRAF1 kinases, small G proteins, actin, and dynamin.42–45 Any endocytic mechanism requires the coordinated action of proteins that are capable of deforming the plasma membrane.23 Thus, the best understood mechanism is clathrin-mediated endocytosis, and this is the probable pathway used by UC-MSC to take up MION-Rh. Although caveolae have been extensively reported as endocytotic intermediates, their role in endocytosis is uncertain.46 After MION-Rh are taken up by UC-MSC, they appear to become localized within cytoplasmic endosomes surrounding the nucleus.19 We showed that this cellular labeling method does not affect the viability and proliferative capacity of UC-MSC (Figure 3D), or their morphologic (Figure 3A) and ultrastructural characteristics (Figure 3C).
The ability to monitor SPION by MRI has been demonstrated in animal models, as well as in the clinical setting to investigate the fate of labeled cells.19,39 The advantages of using MRI for cell tracking include a high spatial resolution with high anatomic background contrast, lack of exposure to ionizing radiation, and the ability to follow the cells for months at a time.39 SPION provide a strong change in signal per unit of metal, in particular on T2-weighted and T2*-weighted images.39
With regard to in vitro assessment by MRI of labeled UC-MSC phantoms, we observed a decrease in T2 values with increasing concentrations of MION-Rh and UC-MSC, generating a contrast increase detected by MRI (Figure 4A–D). Over 19 days in culture, these labeled cells demonstrated an increase in T2 values that generated a decrease in contrast (Figure 4E and F).
Quantification of the approximate number of magnetically labeled cells within a voxel may provide an effective and efficient method for monitoring and optimizing cell therapies.15 MRI in vitro evaluation of the MION-Rh internalization process by UC-MSC was performed through a study of quantification by relaxometry (Figure 5). Even using a long incubation period of approximately 18 hours, we achieved an efficient iron load without affecting cell viability (Figure 3C and D). T2 values of unlabeled and labeled UC-MSC and r2 values (Figure 5A) were used to determine the number of SPION per cell for each nanoparticle concentration (Figure 5).
We used a MION-Rh concentration of 40 μg/mL since the T2 value is different from the respective control (Figure 4B), and did not appear to be toxic to cells, as shown in the ultramicrographs (Figure 3C) and by the proliferation kinetics of MION/Rh-B labeled UC-MSC (Figure 3D). For this, the MION-Rh concentration was calculated as 4.5 × 10⁴ MION-Rh per cell (3.6 pg Fe per cell) and the threshold value was 6.0x10⁴ MION-Rh per cell (4.75 pg Fe per cell) as shown in Figure 5B. Already with the calculated values of T2 (Figure 4C) and maintaining a constant concentration of MION-Rh (40 μg/mL) for cell labeling, the number of MION-Rh per cell were quantified as shown in Figure 5C. The quantification was performed at different cell concentrations. We observed that, with an increasing number of labeled cells, there was a decrease in the number of MION-Rh per cell that was inversely proportional to the total number of MION-Rh (Figure 5C). As cells proliferated and the iron was divided symmetrically or asymmetrically between daughter cells, the number of SPION per cell decreased, as did the signal from each cell.15 Moreover, the iron from cells undergoing apoptosis or cell lysis can be internalized by resident macrophages in the local tissue, resulting in signal attributable to the cells.15 However, it has been shown that the amount of iron transferred from a labeled stem cell to activated macrophages is less than 10% of the total iron load injected into the tissue, and therefore may not contribute significantly to the R2* changes seen on MRI.47
We also demonstrated that labeled cells differentiated into adipocyte-like and osteoblast-like cells showing no cytotoxicity on labeling (Figure 6). We infused MION-Rh labeled UC-MSC into the striatum in an adult male rat model that mimicked late onset of Parkinson’s disease.29 Fifteen days later, we observed that these cells migrated along the medial forebrain bundle (Figure 7E–H) to the substantia nigra (Figure 7I–M and Q) as hypointense spots on T2 MRI. Our in vitro data defined the optimal conditions for labeling cells using MION-Rh, resulting in robust MION-Rh uptake and detectability by MRI. These data were supported by short-term MRI studies performed on isolated brains, showing that about 5 × 10⁵ cells could be efficiently detected in the short term following infusion (Figure 7O and Q).
Conclusion
In summary, this study describes stabilization of MION-Rh in different types of culture medium, their subsequent labeling, and assessment of their viability by proliferation kinetics and ultrastructural evaluation of labeled cells. Thus, MRI was used first to determine MION-Rh and adequate cell concentrations to follow the labeled cells over time. MRI was then used further to evaluate the tracking of labeled cells in the brain using a neurodegenerative disease model.
Acknowledgment
This work was supported by Instituto Israelita de Ensino e Pesquisa Albert Einstein, CNPq, FINEP/CAPES and FAPESP.
Disclosure
The authors report no conflicts of interest in this work.
References
Troyer DL, Weiss ML. Wharton’s jelly-derived cells are a primitive stromal cell population. Stem Cells. 2008;26(3):591–599. | |
Hu SL, Zhang JQ, Hu X, et al. In vitro labeling of human umbilical cord mesenchymal stem cells with superparamagnetic iron oxide nanoparticles. J Cell Biochem. 2009;108(2):529–535. | |
Karahuseyinoglu S, Cinar O, Kilic E, et al. Biology of stem cells in human umbilical cord stroma: in situ and in vivo surveys. Stem Cells. 2007;25(2):319–331. | |
Yang PL, He XJ, Li HP, et al. [Reactive astrocytes ans nestin expression in adult rats following spinal cord compression injury]. Nan Fang Yi Ke Da Xue Xue Bao. 2008;28(10):1752–1755. Chinese. | |
Jomura S, Uy M, Mitchell K, et al. Potential treatment of cerebral global ischemia with Oct-4 umbilical cord matrix cells. Stem Cells. 2007;25(1):98–106. | |
Weiss ML, Medicetty S, Bledsoe AR, et al. Human umbilical cord matrix stem cells: preliminary characterization and effect of transplantation in a rodent model of Parkinson’s disease. Stem Cells. 2006;24(3):781–792. | |
Takalo M, Salmien A, Soininen H, et al. Protein aggregation and degradation mechanisms in neurodegenerative diseases. Am J Neurodegener Dis. 2013;2(1):1–14. | |
Soto C. Unfolding the role of protein misfolding in neurodegenerative diseases. Nat Rev Neurosci. 2003;4(1):49–60. | |
Karussis D, Kassis I, Kurkalli BG, et al. Immunomodulation and neuroprotection with mesenchymal bone marrow stem cells (MSCs): a proposed treatment for multiple sclerosis and other neuroimmunological/ neurodegenative diseases. J Neurol Sci. 2008;265(1–2):131–135. | |
Guzman R, Bliss T, De Los Angeles A, et al. Neural progenitor cells transplanted into the uninjure brain undergo targeted migration after stroke onset. J Neurosci Res. 2007;86(4):873–882. | |
Ren ZH, Wang JY, Zou CL, et al. Labeling of cynomolgus monkey bone marrow-derived mesenchymal stem cells tracking by multimodality imaging. Sci China Life Sci. 2011;54(11):981–987. | |
Deddens LH, Van Tilborg GA, Mulder WJ, et al. Imaging neuroinflammation after stroke: current status of cellular and molecular MRI strategies. Cerebrovasc Dis. 2012;33(4):392–402. | |
Arbab AS, Bashaw LA, Miller BR, et al. Characterization of biophysical and metabolic properties of cells labeled with superparamagnetic iron oxide nanoparticles and transfection agent for cellular MR imaging. Radiology. 2003;229(3):838–846. | |
Chang NK, Jeong YY, Park JS, et al. Tracking of neural stem cells in rats with intracerebral hemorrhage by the use of 3T MRI. Korean J Radiol. 2008;9(3):196–204. | |
Liu W, Frank JA. Detection and quantification of magnetically labeled cells by cellular MRI. Eur J Radiol. 2009;70(2):258–264. | |
Lee DE, Koo H, Sun IC, et al. Multifunctional nanoparticles for multimodal imaging and theragnosis. Chem Soc Rev. 2012;41(7):2656–2672. | |
Berman SC, Galpoththawela C, Gilad AA, et al. Long-term MR cell tracking of neural stem cells grafted in immunocompetent versus immunodeficient mice reveals distinct differences in contrast between live and dead cells. Magn Reson Med. 2011;65(2):564–574. | |
Albukhaty S, Naderi-Manesh H, Tiraihi T. In vitro labeling of neural stem cells with poly-L-lysine coated super paramagnetic nanoparticles for Green fluorescent protein transfection. Iran Biomed J. 2013;17(2):71–76. | |
Addicott B, Willman M, Rodriquez J, et al. Mesenchymal stem cell labeling and in vivo MR characterization at 1.5 T of new SPIO contrast agent: Molday ION Rhodamine-B™. Contrast Media Mol Imaging. 2011;6(1):7–18. | |
Miyaki LA, Sibov TT, Pavon LF, et al. Study of internalization and viability of multimodal nanoparticles for labeling of human umbilical cord mesenchymal stem cells. Einstein (Sao Paulo). 2012;10(2):189–196. | |
Sibov TT, Pavon LF, Oliveira DM, et al. Characterization of adherent umbilical cord blood stromal cells regarding passage, cell number, and nano-biomarking utilization. Cell Reprogram. 2010;12(4):391–403. | |
Sibov TT, Severino P, Marti LC, et al. Mesenchymal stem cells from umbilical cord blood: parameters for isolation, characterization and adipogenic differentiation. Cytotechnology. 2012;64(5):511–521. | |
Mahmoudi M, Simchi A, Imani M, et al. A new approach for the in vitro identification of the cytotoxicity of superparamagnetic iron oxide nanoparticles. Colloids Surf B Biointerfaces. 2010;75(1):300–309. | |
Jiang J, Chen Y, Zhu Y, et al. Efficient in vitro labeling of human prostate cancer cells with superparamagnetic iron oxide nanoparticles. Cancer Biother Radiopharm. 2011;26(4):461–467. | |
Xia H, Pang RY, Zhang R, et al. Study of colloidal particle Brownian aggregation by low-coherence fiber optic dynamic light scattering. J Colloid Interface Sci. 2012;376(1):322–326. | |
Bulte JW, Kraitchman DL. Iron oxide MR contrast agents for molecular and cellular imaging. NMR Biomed. 2004;17(7):484–499. | |
Frank JA, Zywicke H, Jordan EK, et al. Magnetic intracellular labeling of mammalian cells by combining (FDA-approved) superparamagnetic iron oxide MR contrast agents and commonly used transfection agents. Acad Radiol. 2002;Suppl 2:S484–S487. | |
Billotey C, Wilhem C, Devaud M, et al. Cell internalization of anionic maghemite nanoparticles: quantitative effect on magnetic resonance imaging. Magn Reson Med. 2003;49(4):646–654. | |
Gomes MZ, Del-Bel EA. Effects of electrolytic and 6-hydroxydopamine lesions of rat nigrostriatal pathway on nitric oxide synthase and nicotinamide adenine dinucleotide phosphate diaphorase. Brain Res Bull. 2003;62(2):107–115. | |
Paxinos G, Watson C. The Rat Brain in Stereotaxic Coordinates. 4th ed. New York, NY, USA: Academic Press; 1998. | |
Gamarra LF, Pontuschka WM, Amaro E Jr, et al. Kinetics of elimination and distribution in blood and liver of biocompatible ferrofluids based on Fe3O4 nanoparticles: An EPR and XRF study. Mater Sci Eng C Mater Biol Appl. 2008;28(4):519–525. | |
Lee JW, Fang X, Krasnodembskaya A, et al. Concise review: mesenchymal stem cells for acute lung injury: role of paracrine soluble factors. Stem Cells. 2011;29(6):913–919. | |
Fan CG, Zhang QJ, Zhou JR. Therapeutic potentials of mesenchymal stem cells derived from human umbilical cord. Stem Cell Rev. 2011; 7(1):195–207. | |
Li XX, Li KA, Qin JB, et al. In vivo MRI tracking of iron oxide nanoparticle-labeled human mesenchymal stem cells in limb ischemia. Int J Nanomedicine. 2013;8:1063–1073. | |
Petri-Fink A, Steitz B, Finka A, et al. Effect of cell media on polymer coated superparamagnetic iron oxide nanoparticles (SPIONs): colloidal stability, cytotoxicity, and cellular uptake studies. Eur J Pharm Biopharm. 2008;68(1):129–137. | |
Vonarbourg A, Passirani C, Saulnier P, et al. Parameters influencing the stealthiness of colloidal drug delivery systems. Biomaterials. 2006; 27(24):4356–4373. | |
Galuppo LD, Kamau SW, Steitz B, et al. Gene expression in synovial membrane cells after intraarticular delivery of plasmid-linked superparamagnetic iron oxide particles – a preliminary study in sheep. J Nanosci Nanotechnol. 2006;6(9–10):2841–2852. | |
Myers D. Surfaces, Interfaces, and Colloids: Principles and Applications. New York, NY, USA: VCH Publishers; 1991. | |
Shan L. Multimodal, Rhodamine B isothiocyanate-incorporated, silica coated magnetic nanoparticle-labeled human cord blood-derived mesenchymal stem cells for cell tracking. Molecular Imaging and Contrast Agent Database. Bethesda, MD, USA: National Center for Biotechnology Information; 2009. | |
Nel AE, Mädler L, Velegol D, et al. Understanding biophysicochemical interactions at the nano-biointerface. Nat Mater. 2009;8(7):543–557. | |
Decuzzi P, Ferrari M. The role of specific and non-specific interactions in receptor-mediated endocytosis of nanoparticles. Biomaterials. 2007;28(18):2915–2922. | |
Howes MT, Kirkham M, Riches J, et al. Clathrin-independent carriers form a high capacity endocytic sorting at the leading edge of migrating cells. J Cell Biol. 2010;190(4):675–691. | |
Doherty GJ, McMahon HT. Mechanisms of endocytosis. Annu Rev Biochem. 2009;78:857–902. | |
Gillingham AK, Munro S. The small G proteins of the Arf family and their regulators. Annu Rev Cell Dev Biol. 2007;23:579–611. | |
Girao H, Geli MI, Idrissi FZ. Actin in the endocytic pathway: from yeast to mammals. FEBS Lett. 2008;582(14):2112–2119. | |
Gratton SE, Ropp PA, Pohlhaus PD, et al. The effect of particle design on cellular internalization pathways. Proc Natl Acad Sci U S A. 2008;105(33):11613–11618. | |
Pawelczyk E, Arbab AS, Chaudhry A, et al. In vitro model of bromodeoxyuridine or iron oxide nanoparticle uptake by activated macrophages from labeled stem cells: implications for cellular therapy. Stem Cells. 2008;26(5):1366–1375. |
 © 2014 The Author(s). This work is published and licensed by Dove Medical Press Limited. The
full terms of this license are available at https://www.dovepress.com/terms
and incorporate the Creative Commons Attribution
- Non Commercial (unported, 3.0) License.
By accessing the work you hereby accept the Terms. Non-commercial uses of the work are permitted
without any further permission from Dove Medical Press Limited, provided the work is properly
attributed. For permission for commercial use of this work, please see paragraphs 4.2 and 5 of our Terms.
© 2014 The Author(s). This work is published and licensed by Dove Medical Press Limited. The
full terms of this license are available at https://www.dovepress.com/terms
and incorporate the Creative Commons Attribution
- Non Commercial (unported, 3.0) License.
By accessing the work you hereby accept the Terms. Non-commercial uses of the work are permitted
without any further permission from Dove Medical Press Limited, provided the work is properly
attributed. For permission for commercial use of this work, please see paragraphs 4.2 and 5 of our Terms.