Back to Journals » Journal of Asthma and Allergy » Volume 13
Type 2 Inflammatory Biomarker Response After Exercise Challenge Testing
Authors Tufvesson E ![]() , Stenberg H
, Stenberg H ![]() , Ankerst J
, Ankerst J ![]() , Bjermer L
, Bjermer L ![]()
Received 16 April 2020
Accepted for publication 23 June 2020
Published 24 August 2020 Volume 2020:13 Pages 269—274
DOI https://doi.org/10.2147/JAA.S258561
Checked for plagiarism Yes
Review by Single anonymous peer review
Peer reviewer comments 2
Editor who approved publication: Dr Amrita Dosanjh
Ellen Tufvesson, Henning Stenberg, Jaro Ankerst, Leif Bjermer
Respiratory Medicine and Allergology, Department of Clinical Sciences Lund, Lund University, Lund, Sweden
Correspondence: Ellen Tufvesson Respiratory Medicine and Allergology, Department of Clinical Sciences Lund
Lund University, Lund 221 84, Sweden
Tel +46 736 401916
Email [email protected]
Introduction: Exercise-induced bronchoconstriction is due to osmotic stimulus of the airway epithelium and leads to a cascade of biomarker release from several inflammatory cells. Several type 2 (T2) mediators have been linked to exercise-induced bronchoconstriction, but the T2 response per se has not been described during exercise. The aim of this study was therefore to investigate T2 biomarkers in plasma and urine from subjects with asthma and healthy controls before and after an exercise challenge.
Methods: Twenty-two subjects with mild asthma and 18 healthy controls performed an exercise challenge test on a treadmill, and fractional exhaled NO (FeNO) was measured at baseline. Blood and urine samples were collected repeatedly during 60 min after the test and Interleukin-13 (IL-13), thymus and activation-related chemokine (TARC), periostin and leukotrienes were measured.
Results: Asthmatics and controls showed similar levels of IL-13, TARC, periostin and Cys-LT in plasma at baseline, and there were no differences in baseline levels between subjects with a negative and positive exercise challenge. After exercise, there was an overall increase in interleukin-13 (IL-13) in plasma in all subjects (p< 0.001), with a peak at 10 min after the exercise challenge in both the asthmatic and control group. An increase in TARC in plasma was also seen (p< 0.001), but only in the control subjects. In contrast, Cys-LT in plasma showed an overall decrease in all subjects (p< 0.001), while periostin in plasma did not change. In conjunction with plasma, the level of IL-13 was increased in urine 30 min after the exercise challenge (p=0.002) and decreased again at 60 min (p=0.004). Similarly, leukotriene E4 (LTE4) was increased in urine samples, with a peak at 60 min and most pronounced in asthmatic subjects (p< 0.001) but was seen also in controls (p=0.008).
Discussion: In conclusion, circulating levels of IL-13 are increased after exercise to the same extent in asthmatics and healthy control subjects, which indicates a physiological rather than a pathophysiological response. Also, the levels of TARC and leukotrienes were affected after exercise.
Keywords: asthma, biomarkers, exercise, inflammation
Introduction
During exercise-induced bronchoconstriction, an osmotic stimulus of the airway epithelium leads to a cascade of biomarker release from several inflammatory cells.1 Controversy remains about the causative mediators in the bronchoconstrictive response to exercise in asthma, but there is clear evidence for mast cell activation during exercise-induced bronchoconstriction in asthmatics.2 Mast cells and eosinophils release cysteinyl-leukotrienes (Cys-LT) and prostaglandins which are the most well-known mediators of exercise-induced bronchoconstriction.3 Increased level of leuktrieneE4 (LTE4) in urine has been shown in several studies4,5 and explains the protective role of montelukast against exercise-induced bronchoconstriction.6 Although the role of type 2 (T2) mediators in exercise-induced bronchoconstriction is not well characterized, it has been shown that sputum eosinophil percentage correlates to severity of exercise-induced bronchoconstriction,7 and that increased serum periostin level predicts a positive exercise challenge.8 In addition, polymorphism of the T2 cytokine IL-13 has shown to be associated to the severity of exercise-induced bronchoconstriction.9 Thymus and activation-regulated chemokine (TARC) is associated with the allergic inflammation of asthma and has shown an inverse correlation to FEV1 in children with a positive response to exercise.10
Even though several T2 biomarkers are known to be associated with exercise-induced bronchoconstriction, the T2 response per se has not been described during exercise. The aim of this study was therefore to investigate T2 biomarkers (IL-13, TARC, periostin and Cys-LT) in plasma and urine from subjects with asthma and healthy controls before and after an exercise challenge.
Methods
Subjects
Twenty-two subjects with mild asthma (according to Gina guidelines)11 and 18 healthy controls were investigated (see Table 1). The controls had no respiratory symptoms or diagnosed asthma. All subjects were non-smokers without respiratory tract infection within three weeks prior to the investigation. All asthmatic subjects refrained from using β2-agonists and inhaled corticosteroids for at least 48 h before the study. The study was conducted in accordance with the Declaration of Helsinki and the Regional Ethical Review board in Lund approved the study. All subjects gave informed consent.
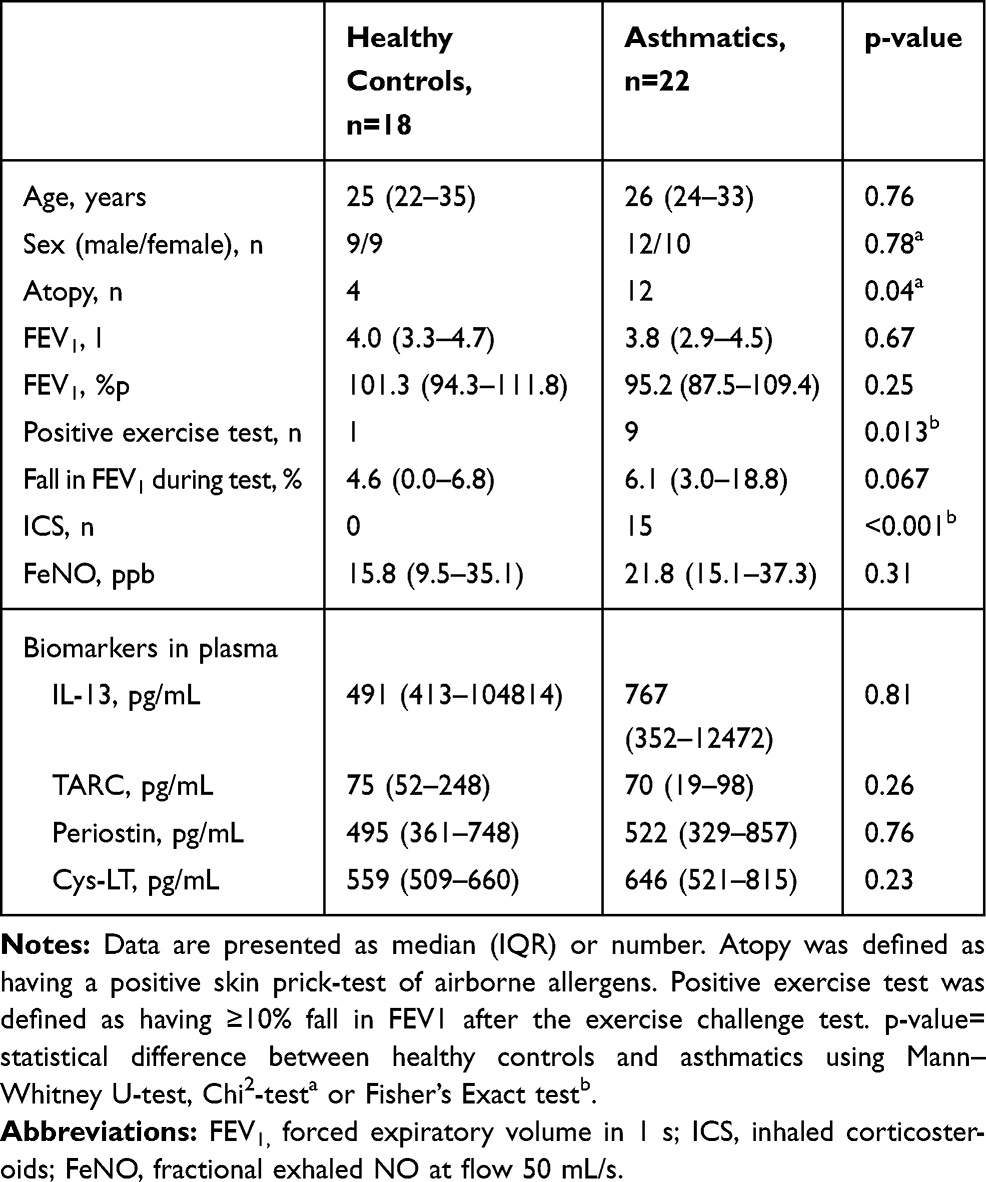 |
Table 1 Subject Characteristics and Baseline Biomarker Concentration in Plasma |
Study Design
At arrival in the clinic, participants emptied their bladder and drank a glass of water. Atopy was defined as having a positive skin prick test (ALK-Abello, Hørsholm, Denmark) of airborne allergens (including house dust mite (D. pteronyssinus and D. farinae), cat, horse, dog, A. alternata, C. herbarum, grass, birch and ragweed pollen). Thereafter, exhaled NO was measured, spirometry performed and blood and urine samples were taken just prior to the exercise test. An exercise challenge test was performed and thereafter the subjects were resting for 60 min while repeated spirometry was performed (at 5, 10, 15, 20, 30, 45 and 60 min after the end of the exercise challenge test) and blood and urine samples were collected repeatedly (plasma samples were collected after 10, 30, 45 and 60 min, and urine samples were collected after 30 and 60 min).
Exercise Challenge
The exercise challenge test was conducted (as previously described)12 on a treadmill: a) two minutes of running: speed and slope were set to increase the heart rate of the subject to approximately 90% of maximum capacity (defined as 220 beats per minute – age in years), b) four minutes of running: at about 90% of maximum capacity, c) two minutes of running: the speed and slope were increased to induce a maximum exertion. A positive exercise test was defined as having ≥10% fall in FEV1 after the exercise challenge test.
Forced expiratory volume in 1 second (FEV1) was measured using a flow-volume spirometry (Jaeger MasterScope, Würzburg, Germany) and FEV1% predicted (%p) was calculated according to Crapo.13
Fractional Exhaled Nitric Oxide (FeNO)
FeNO measurements were performed at baseline using a NIOX Flex (Aerocrine, AB, Stockholm, Sweden). Patients were comfortably seated; inhaled NO depleted ambient air and exhaled at a flow rate of 50 mL/s. The manoeuvre was performed 3–4 times.
Biomarker Analysis
For biomarker analyses, ELISA kits from R&D systems (Abingdon, UK) were used to measure IL-13 (DY213), TARC (DY364) and periostin (DY3548B) and kits from Cayman Chemicals (Ann Arbor, MI) were used to measure CysLT (500 390) and LTE4 (501 060). All urine samples were corrected for creatinine.
Statistical Analyses
All statistical calculations were performed using SPSS 25.0 for Windows (SPSS, Inc., Chicago, IL). Due to non-normally distributed data, all statistical analyses were done using non-parametric tests; Mann–Whitney U-test for unpaired data, Wilcoxon signed-rank test for paired data, Friedman test for repeated measures and correlations were calculated by Spearman correlation test. Chi square test was used for number comparisons, with Fisher’s correction when necessary. A p-value of <0.05 was considered statistically significant.
Results
Baseline Characteristics
Asthmatics and controls showed similar levels of IL-13, TARC, periostin and Cys-LT in plasma at baseline (Table 1). Similarly, there were no differences in baseline levels between subjects with a negative and positive exercise challenge, between atopic and non-atopic subjects, or between subjects with or without inhaled corticosteroid treatment.
Plasma T2 Biomarkers After Exercise Challenge
In plasma, there was an increase over time in interleukin-13 (IL-13) in all subjects (p<0.001) during the 60 min following the exercise challenge (Figure 1A), with a peak at 10 min after the exercise challenge in both the asthmatic and control group (p=0.05 from pre to 10 min) and thereafter a decrease back to baseline again (from 10 to 30 min: p=0.011, and from 30 to 60 min: p =0.065).
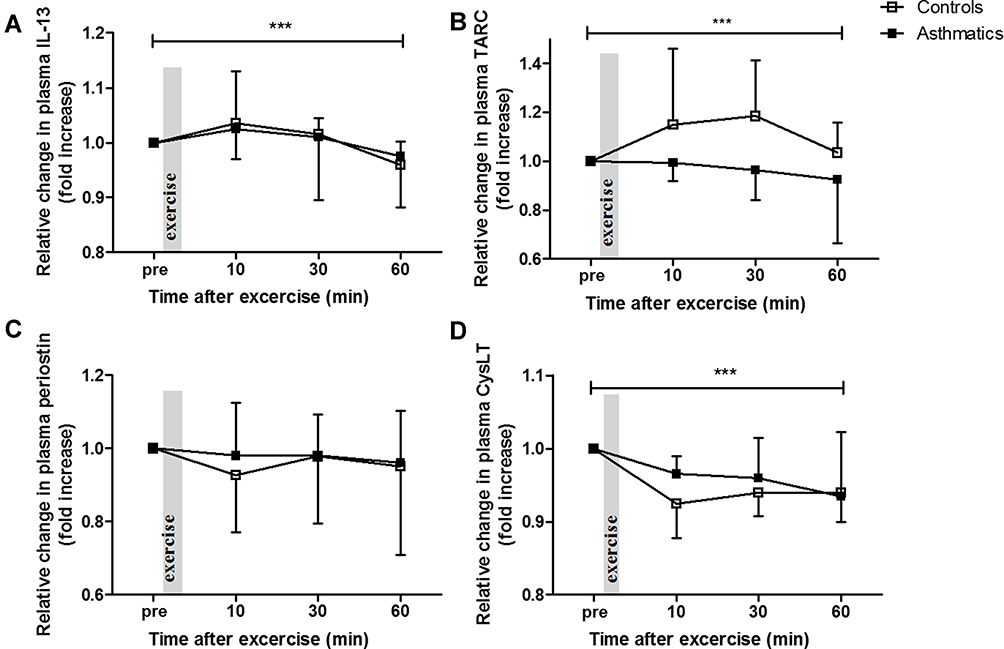 |
Figure 1 Relative change in plasma levels of IL-13 (A), TARC (B), periostin (C) and Cys-LT (D) before (pre) and 10, 30 and 60 min after an exercise challenge test in controls and asthmatics. Medians and interquartiles are presented. ***=significant change over all time points in all subjects with p<0.001 according to Friedman test. |
An increase in thymus and activation-related chemokine (TARC) in plasma was also seen over all time points (p<0.001), but only in the control subjects (Figure 1B). The increase in TARC in the control subjects peaked at 10–30 min after the exercise challenge, and the relative increase in TARC was significantly larger at both 10 and 30 min in the controls compared to the asthmatics (p=0.037 and 0.022, respectively).
Periostin in plasma did not change in either the asthmatics or in the controls after the exercise challenge (Figure 1C). In contrast, Cys-LT in plasma showed an overall decrease in all subjects (p<0.001) during the 60 min following the exercise challenge (Figure 1D), and this decrease was seen in both asthmatics (p=0.040) and controls (p<0.001).
Urine T2 Biomarkers After Exercise Challenge
In conjunction with plasma, the level of IL-13 was increased in urine 30 min after the exercise challenge (Figure 2A, p=0.002). This increase was uniform in all samples that had detectable levels at baseline (n=10: 6 controls and 4 asthmatics), and decreased again at 60 min compared to 30 min (p=0.004). Similarly, leukotriene E4 (LTE4) was increased in urine samples (all: p<0.001), with a peak at 60 min (Figure 2B). This increase was most pronounced in asthmatic subjects (p<0.001), but was seen also in controls (p=0.008). TARC was not detectable in urine in any of the subjects. Periostin was detectable in urine from only a few subjects (n=7) at different time points. Although a tendency towards a decrease over time was discerned in these individuals, the trend was not significant (data not shown).
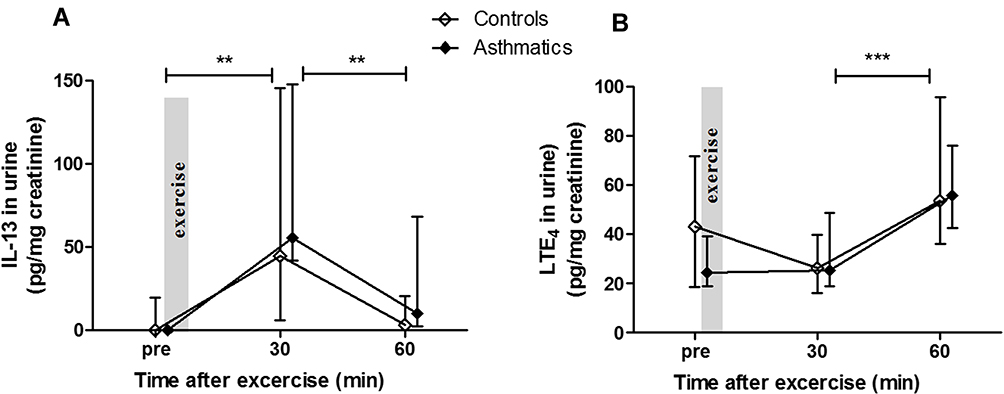 |
Figure 2 Urinary levels of IL-13 (A) and LTE4 (B) before (pre) and 30 and 60 min after an exercise challenge test in controls and asthmatics. Medians and interquartiles are presented and significant changes in all subjects are shown as **=p<0.01 and ***=p<0.001 according to Wilcoxon signed-rank test. |
Correlation Analyses of T2 Biomarkers
Baseline plasma levels of IL-13 correlated to baseline plasma levels of Cys-LT, TARC and periostin. In addition, baseline plasma levels of Cys-LT correlated to baseline plasma levels of TARC (see Table 2). These associations remained at 10, 30 and 60 min after the exercise challenge. In addition, baseline levels of IL-13 and LTE4 in urine correlated significantly (r=0.66, p=0.027).
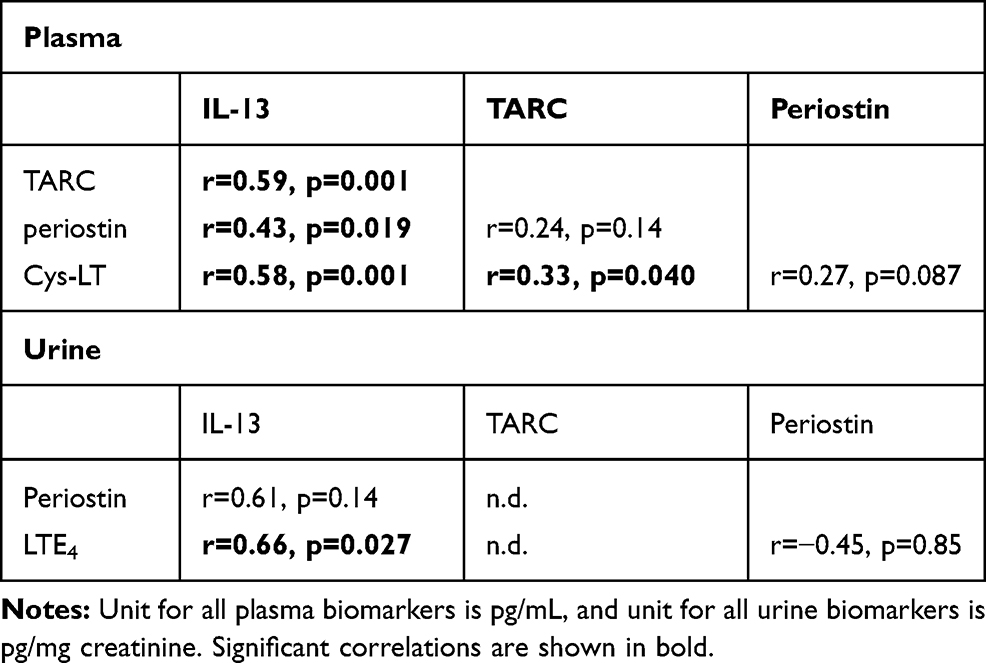 |
Table 2 Correlations Between Baseline Values of the Respective Biomarkers in Plasma or Urine |
In plasma, there was an inverse correlation between the change in TARC and the change in CysLT from baseline to 10 min after exercise (r=−0.47, p=0.050) within the healthy subjects (and almost significant from baseline to 30 min; r=−0.043, p=0.076) which was not seen within the asthmatics.
When investigating correlations between plasma and urine levels, there were no correlations between plasma and urine levels for any of the biomarkers during baseline. Though, after the exercise challenge test, IL-13 levels in plasma correlated at most time points to the post test levels of IL-13 in urine (r=0.77–0.81 and p=0.005–0.009).
There was no correlation between the levels of Club cell protein 16 (CC16), which are previously published,12 and IL-13.
FeNO in Relation to T2 Biomarkers
FeNO is a biomarker that most often reflects T2 status, and in this study a correlation between FeNO and baseline IL-13 concentrations in urine (r=0.68, p=0.029) was shown. This reflects to some extent a relationship between FeNO and T2 status, even though FeNO did not correlate to any of the other biomarker levels in plasma or urine at baseline. The levels of FeNO did however correlate clearly to urinary LTE4 at 60 min (r=0.57, p=0.001), and a non-significant tendency could be seen already at baseline and at 30 min.
There was no difference in FeNO between subjects with and without inhaled corticosteroids or between subjects with a positive and a negative exercise test.
Discussion
In both plasma and urine, there was an increase in IL-13 after the exercise challenge in both the asthmatic and control group. Our finding of a rapid increase in IL-13 after exercise in all subjects could be linked to an endothelial response due to the increased cardiac output, and/or an epithelial response due to osmotic stress. There was however no correlation between IL-13 and the levels of CC16 (from previous publication)12, which may suggest a different location of the response with a focus on the bronchial instead of bronchiolar segments. Seeing as IL-13 has previously been shown to be a mediator of normal epithelial repair,14 epithelial release of IL-13 in response to exercise-induced osmotic trauma could be a useful physiological response. Moreover, IL-13 levels in plasma after the exercise challenge test correlated at most time points to the post test levels of IL-13 in urine. This reflects a homogenous systemic increase, and might be due to a non-metabolized excretion of IL-13.
The correlations seen between most of the T2 biomarkers at both baseline and later time points suggest a uniform baseline T2 status in the individuals. In addition, correlations also after the exercise challenge imply a coherent increase in T2.
The increase in plasma TARC in healthy controls, but not in asthmatics, could suggest an inadequate T2 response due to exercise in asthmatics. Furthermore, the decrease in CysLT in response to exercise was evident in both healthy controls and asthmatics, even though it was most prominent in healthy controls. In addition, the inverse correlation between the change in TARC and change in CysLT during the first 10 min was present only in the healthy controls, suggesting a common T2 response to exercise that was maybe pathologically impaired in asthmatics. This was separated from the IL-13 response since no correlations were found between change in IL-13 and change in TARC or CysLT.
In urine, there was a distinct increase in LTE4 after 60 min, while the levels of CysLT in plasma decreased. In a previous publication,5 we have shown a small but significant decrease of LTE4 in urine in athletes after exercise, which can also be discerned in the healthy subjects in the present study. The decrease of CysLT after exercise seen in plasma in this study is in conjunction with the decrease of LTE4 seen in urine in that study.
The correlations between FeNO and leukotriene levels in urine suggest a common cellular source of FeNO and Cys-LT, tentatively the mast cells that are known to be involved in the process of exercise-induced bronchoconstriction.
When investigating all subjects, no differences were found between individuals with a negative and positive exercise challenge, between atopic and non-atopic subjects, or between subjects with or without inhaled corticosteroid treatment. If these analyses would have been investigated within an asthma group, there might have been other results. Unfortunately, we have too few subjects and do not have the power to do these sub-groupings.
Only mild asthmatics were included, which can explain the lack of any difference between asthmatics and controls and the response would maybe be different in a group of patients with more severe asthma. Many of the asthmatics were on daily treatment with mild/moderate dose of inhaled corticosteroids which might have impeded a T2 response in these asthmatics. There were though no difference in baseline levels or response to exercise in asthmatics with inhaled corticosteroids compared to without. Another limiting factor might be accuracy of the assays. For example, periostin has several isoforms that are involved in a variety of biological processes. A precise and well-characterized assay for detecting periostin is needed to be able to correctly analyze functional aspects of periostin, or the ability of periostin as potential biomarker in physiological and pathological conditions.15
In conclusion, circulating levels of IL-13 were increased after exercise to the same extent in asthmatics and healthy controls, which indicates a physiological rather than a pathophysiological response. In contrast, TARC in plasma was increased, but only in healthy controls, and CysLT in plasma was decreased after exercise, but increased in urine.
Disclosure
None of the authors have any conflicts of interest related to the manuscript content.
References
1. Couto M, Kurowski M, Moreira A, et al. Mechanisms of exercise-induced bronchoconstriction in athletes: current perspectives and future challenges. Allergy. 2018;73(1):8–16. doi:10.1111/all.13224
2. O’Sullivan S, Roquet A, Dahlén B, et al. Evidence for mast cell activation during exercise-induced bronchoconstriction. Eur Respir J. 1998;12(2):345–350. doi:10.1183/09031936.98.12020345
3. Kippelen P, Anderson SD, Hallstrand TS. Mechanisms and biomarkers of exercise-induced bronchoconstriction. Immunol Allergy Clin North Am. 2018;38(2):165–182. doi:10.1016/j.iac.2018.01.008
4. Baek H-S, Choi J-H, Oh J-W, Lee H-B. Leptin and urinary leukotriene E4 and 9α,11β-prostaglandin F2 release after exercise challenge. Ann Allergy Asthma Immunol. 2013;111(2):112–117. doi:10.1016/j.anai.2013.05.019
5. Romberg K, Bjermer L, Tufvesson E. Exercise but not mannitol provocation increases urinary Clara cell protein (CC16) in elite swimmers. Respir Med. 2011;105(1):31–36. doi:10.1016/j.rmed.2010.07.012
6. Reiss TF, Hill JB, Harman E, et al. Increased urinary excretion of LTE4 after exercise and attenuation of exercise-induced bronchospasm by montelukast, a cysteinyl leukotriene receptor antagonist. Thorax. 1997;52(12):1030–1035. doi:10.1136/thx.52.12.1030
7. Duong M, Subbarao P, Adelroth E, et al. Sputum eosinophils and the response of exercise-induced bronchoconstriction to corticosteroid in asthma. Chest. 2008;133(2):404–411. doi:10.1378/chest.07-2048
8. Cho JH, Kim K, Yoon JW, et al. Serum levels of periostin and exercise-induced bronchoconstriction in asthmatic children. World Allergy Organ J. 2019;12(1):100004. doi:10.1016/j.waojou.2018.11.004
9. Kang MJ, Lee SY, Kim HB, et al. Association of IL-13 polymorphisms with leukotriene receptor antagonist drug responsiveness in Korean children with exercise-induced bronchoconstriction. Pharmacogenet Genomics. 2008;18(7):551–558. doi:10.1097/FPC.0b013e3282fe94c5
10. Tahan F, Karaaslan C, Aslan A, Kiper N, Kalayci O. The role of chemokines in exercise-induced bronchoconstriction in asthma. Ann Allergy Asthma Immunol. 2006;96(6):819–825. doi:10.1016/S1081-1206(10)61344-0
11. Global Initiative for Asthma. Global strategy for asthma management and prevention; 2016. Available from: http://www.ginasthma.org.
12. Tufvesson E, Svensson H, Ankerst J, Bjermer L. Increase of club cell (Clara) protein (CC16) in plasma and urine after exercise challenge in asthmatics and healthy controls, and correlations to exhaled breath temperature and exhaled nitric oxide. Respir Med. 2013;107(11):1675–1681. doi:10.1016/j.rmed.2013.08.004
13. Crapo RO, Morris AH, Gardner RM. Reference spirometric values using techniques and equipment that meet ATS recommendations. Am Rev Respir Dis. 1981;123(6):659–664.
14. Allahverdian S, Harada N, Singhera GK, Knight DA, Dorscheid DR. Secretion of IL-13 by airway epithelial cells enhances epithelial repair via HB-EGF. Am J Respir Cell Mol Biol. 2008;38(2):153–160. doi:10.1165/rcmb.2007-0173OC
15. Gadermaier E, Tesarz M, Suciu AA, Wallwitz J, Berg G, Himmler G. Characterization of a sandwich ELISA for the quantification of all human periostin isoforms. J Clin Lab Anal. 2018;32:2. doi:10.1002/jcla.22252
 © 2020 The Author(s). This work is published and licensed by Dove Medical Press Limited. The
full terms of this license are available at https://www.dovepress.com/terms
and incorporate the Creative Commons Attribution
- Non Commercial (unported, 3.0) License.
By accessing the work you hereby accept the Terms. Non-commercial uses of the work are permitted
without any further permission from Dove Medical Press Limited, provided the work is properly
attributed. For permission for commercial use of this work, please see paragraphs 4.2 and 5 of our Terms.
© 2020 The Author(s). This work is published and licensed by Dove Medical Press Limited. The
full terms of this license are available at https://www.dovepress.com/terms
and incorporate the Creative Commons Attribution
- Non Commercial (unported, 3.0) License.
By accessing the work you hereby accept the Terms. Non-commercial uses of the work are permitted
without any further permission from Dove Medical Press Limited, provided the work is properly
attributed. For permission for commercial use of this work, please see paragraphs 4.2 and 5 of our Terms.