Back to Journals » Clinical Ophthalmology » Volume 14
Two Year Visual Acuity and Structural Outcomes in Patients with Diabetic Macular Oedema Treated with Intravitreal Aflibercept – A Retrospective Cohort Study
Authors Kern C ![]() , Schiefelbein J, Fu DJ, Schworm B
, Schiefelbein J, Fu DJ, Schworm B ![]() , Sim D
, Sim D ![]() , Herold T
, Herold T ![]() , Priglinger S, Kortuem K
, Priglinger S, Kortuem K ![]()
Received 6 November 2019
Accepted for publication 24 January 2020
Published 26 February 2020 Volume 2020:14 Pages 533—541
DOI https://doi.org/10.2147/OPTH.S237586
Checked for plagiarism Yes
Review by Single anonymous peer review
Peer reviewer comments 2
Editor who approved publication: Dr Scott Fraser
Christoph Kern, 1, 2 Johannes Schiefelbein, 1 Dun Jack Fu, 2 Benedikt Schworm, 1 Dawn Sim, 2 Tina Herold, 1 Siegfried Priglinger, 1 Karsten Kortuem 1, 2
1Department of Ophthalmology, University Hospital LMU, Munich, Germany; 2Moorfields Eye Hospital, London, UK
Correspondence: Christoph Kern
Department of Ophthalmology, University Hospital, LMU Munich, Mathildenstraße 8, Munich 80336, Germany
Tel +49 89 4400 53812
Email [email protected]
Purpose: To assess visual and anatomical outcomes of intravitreal aflibercept for clinically significant diabetic macular oedema (DME).
Methods: For this retrospective single-center cohort study at a tertiary referral center, we performed a data warehouse query to identify 117 treatment-naive patients (139 eyes) undergoing intravitreal treatment with aflibercept for DME between January 2014 and May 2018. Changes in best-corrected visual acuity (BCVA) values (as measured with ETDRS letters), central retinal thickness (CRT) and total macular volume (TVOL) are reported over a two-year period at various time-points.
Results: The total number of injections per study eye was 5.5 ± 1.4 after one and 8.7 ± 2.2 injections after two years. Baseline visual acuity (VA) was 60.1 ± 14.5 letters. A gain of 4.8 and 9.2 letters from baseline was observed after one and two years, respectively (both p ≤ 0.01). In comparison to the mean CRT at baseline (419 ± 174 μm), a CRT decrease was observed after one and two years of treatment (298 ± 115 μm and 319 ± 119 μm, respectively; both p ≤ 0.01). Similarly, TVOL decreased from 10.12 ± 2.05 mm 3 to 8.96 ± 0.96 mm 3 and 9.01 ± 1.29 mm 3 (both p ≤ 0.01).
Conclusion: This study demonstrates that treating DME with intravitreal aflibercept yields positive functional and structural outcomes over a two-year period. However, we observed fewer injection numbers, along with inferior VA and structural outcomes than has been reported in randomized clinical trials. Our results show similar results as in patients treated with ranibizumab due to DME in real-life settings.
Keywords: aflibercept, diabetic macular oedema, visual acuity, central retinal thickness
Introduction
In clinical settings, the frequency of anti–VEGF injections for diabetic macular oedema (DME) is less than in landmark studies.1–3 In light of this, there is increasing controversy regarding the extent to which this negatively impacts functional and anatomical outcomes in real-life cohorts.4
The worldwide prevalence of diabetes mellitus (DM) is expected to rise from 415 million in 2015 to 642 million in 2040.5 In conjunction with an increasing life expectancy of people with diabetes, diabetic retinopathy (DR) and its complications are an emergent cause of visual impairment.6 With 21 million patients worldwide, DME is the most common reason for moderate vision loss in patients with DM and expected to increase in the future.7
Visual prognosis was guarded in patients with DME prior to the introduction of anti–vascular endothelial growth factor (anti–VEGF).8 In DME, the superiority of an anti–VEGF agent (bevacizumab) over focal laser was shown in the BOLT study with a gain in visual acuity (VA) of 8.0 Early Treatment Diabetic Retinopathy Study (ETDRS) letters versus 0.5 ETDRS letters in the laser group following one-year treatment.9 The RESOLVE and RESTORE studies followed shortly, where efficacy and safety of ranibizumab treatment, as well as its superiority over laser treatment, was demonstrated.10,11 These results were confirmed by several other prospective clinical trials, such as the RISE and RIDE study.12 In 2014, aflibercept was shown to be superior to focal laser in DME in terms of functional and anatomical endpoints in the VISTA and VIVID trials.13 The effect of aflibercept in treating DME is not only based on VEGF inhibition alone but also on an anti–inflammatory mechanism of action, namely the inhibition of the recently described Placental growth factor (PlGF) and extracellular signal-regulated protein kinase (ERK) pathway.14 Notably, all the above-mentioned studies were prospective randomized clinical trials (RCT) and featured the same treatment regimen, i.e. intravitreal anti–VEGF injections were given in fixed intervals.
In comparison to these landmark RCTs, retrospective cohort studies performed in the UK, Denmark, France and Germany have reported considerably fewer injections per eye and worse visual outcomes.15–18 It is therefore pertinent to consider whether this disparity in visual outcomes between RCTs and real-life data is accounted for by fewer anti–VEGF treatments, as reflected in real-life settings. This retrospective cohort study investigates the visual and anatomical outcome of treatment-naive DME patients treated with intravitreal aflibercept over two years in a national tertiary referral center.
Methods
Study Setting and Design
This is a retrospective cohort study performed at the University Eye Hospital at the Ludwig-Maximilians University, Munich, Germany. This study was designed to report on real-life VA and structural outcomes including retinal volumetrics for DME patients treated with aflibercept at a tertiary referral center. Ethical approval for this study was obtained from the Institutional Review Board of the University Eye Hospital Munich in Germany. The study adheres to the Declaration of Helsinki. All data warehouse queries were approved by the local data protection officer. Written informed consent for the retrospective use of anonymized data was provided by all patients included in this study.
Data Source and Patient Characteristics
Clinical information was extracted from a data warehouse that has been active since 2012.19 It contains clinical findings from the patients’ electronic health record (EHR) and investigative results of more than 330,000 patients.20 This includes retinal thickness and volume values in the nine circular macular grids defined by the ETDRS study group obtained from optical coherence tomography (OCT) imaging (SPECTRALIS, Heidelberg Engineering, Heidelberg, Germany). Segmentation errors were manually verified in the Heidelberg Eye Explorer (SPECTRALIS viewing software).
Data warehouse queries with the following criteria were performed. Firstly, all eyes with the ICD-10 coded diagnosis of DM type one or two, and diabetic eye disease (ICD-10: E10.3 and E11.3) were identified (8084 eyes; 4072 patients).21 Only eyes that were anti–VEGF treatment naïve and received intravitreal injections with aflibercept from January 2014 to May 2018 were selected (139 eyes; 117 patients). Patients receiving intravitreal injections with other drugs (bevacizumab, ranibizumab, or steroids) were excluded from the study. Moreover, patients with other ophthalmic comorbidities like age-related macular degeneration [H35.3] and retinal vein occlusions [H34.8] were also excluded.
Treatment Regimen
Since approval by the European Medicines Agency (EMA) in 2014, aflibercept has been available as a first-line treatment for DME.22 Patients were initiated on a loading phase of three monthly intravitreal aflibercept injections, followed by injections if needed as per clinicians’ discretion.
Study Outcomes
The main study outcomes were change in mean best-corrected visual acuity (BCVA) and (central retinal thickness) CRT. The BCVA was defined as the VA value tested with correction of auto-refraction measurements (ARK-1s, Nidek, Gamagōri, Japan) using an ETDRS chart. If no ETDRS letter score was available, the decimal visual acuity was used for extrapolation to ETDRS letters. In these cases, the median ETDRS value of all eyes from this cohort within the same decimal visual acuity was chosen. CRT signifies the central foveal thickness in ETDRS grid I (as defined by the ETDRS study group) calculated by the SPECTRALIS OCT at a given visit. Secondary outcome measures were: the total macular volume (TVOL), the mean number of injections delivered per study eye; the proportion of eyes within a change in VA less than 10 and 15 ETDRS letters and gain or loss of ≥10 and ≥15 ETDRS letters, respectively. TVOL was defined as the total retinal volume within the macular ETDRS grid and reported in mm3. All outcomes were reported for baseline (measurements prior to the first injection), day 30, 60, 120, 150,180, 360, 540, and 720 following the first injection. Timepoints 360 and 720 were considered one-year and two-year outcomes. To unify checkpoints, values for the timepoints were generated by linear interpolation for each eye. That is, in the absence of a BCVA value at a given time-point (eg day 30), a value was extrapolated via linear interpolation from temporally proximal measurements (eg at day 21 and 35). If a patient missed the timepoint at all (eg measurements available at baseline and day 68), no data for the day 30 timepoint were interpolated and the patient was defined as lost-to-follow-up onwards in the analysis.
Statistical Methods
All statistical analysis was performed by using the programming language “R” (R Foundation for Statistical Computing, Vienna, Austria).23 The number of eyes eliminated from analyses was reduced by using a last-observation-carried-forward (LCOF) method for the two years observation timepoint. Mean values between two different timepoints were compared by Wilcoxon Rank-Sum test. Levene’s test was performed for all timepoints to assess the homogeneity of the variances. Calculated means in text and figures are expressed with ± error margin corresponding to the standard deviation, unless otherwise specified. A p-value < 0.05 was considered statistically significant. The Wilcoxon-Mann–Whitney test was used to compare outcomes between subgroups. Due to the diverging group size, p-values could not be reported.
Results
Patient Characteristics and Treatment Frequency
At baseline, 139 eyes of 117 patients were included in the analysis. The mean age was 62.2 ± 11.8 and 68% of the patients were female. 5.5 ± 1.4 and 8.7 ± 2.2 aflibercept injections were delivered per study eye in year one and year two, respectively (Table 1).
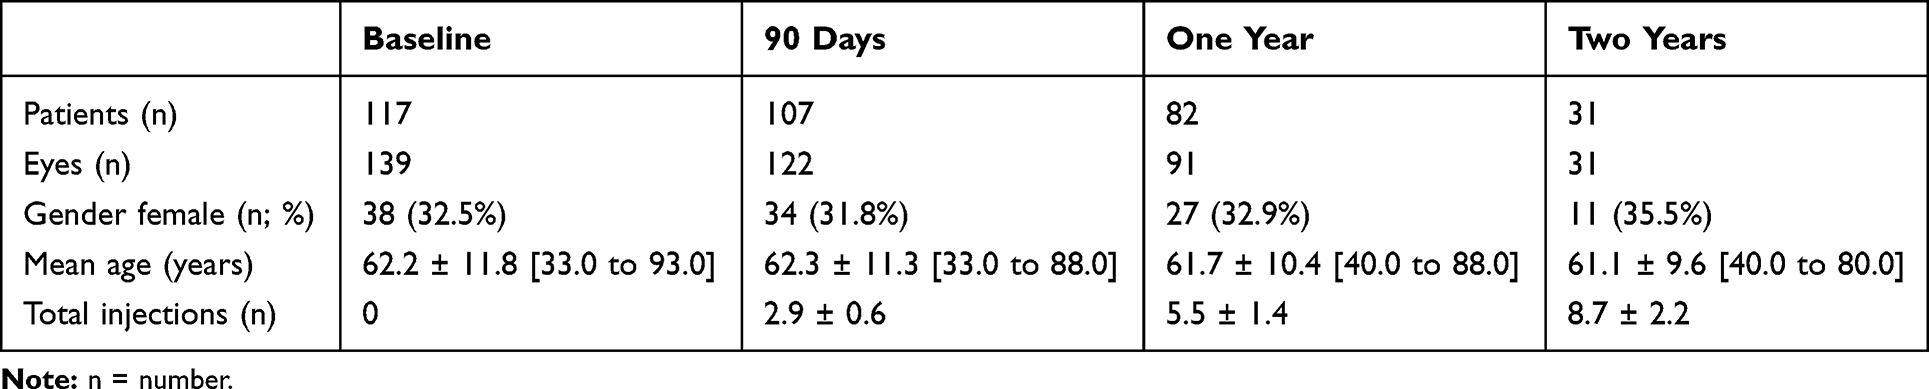 |
Table 1 Patient Characteristics |
Visual Acuity Outcomes
We observed an improvement of visual acuity over the observation period of two years (Figure 1; Supplemental Table 1). A statistically significant gain in mean VA was observed at each of the time-points from day 60 onwards. Mean VA at baseline was 60.1 ± 14.5 letters compared to 64.9 ±15.9 and 69.3 ±12.1 ETDRS letters after one and two years, respectively (both p≤ 0.01). At year one, the proportion of eyes gaining more than 10 and 15 letters (26.4% and 16.5%, respectively) was greater than those who lost more than 10 and 15 letters (2.2% and 6.6%). This trend was also observed after two years with 35.5% and 29.0% gaining more than 10 or 15 letters, whereas 3.2% and 0% lost the same number of letters, respectively (Figure 2; Supplemental Table 2).
 |
Figure 1 Mean change in visual acuity (VA; y-axis left) and central retinal thickness (CRT; y-axis right) from baseline over observation period. |
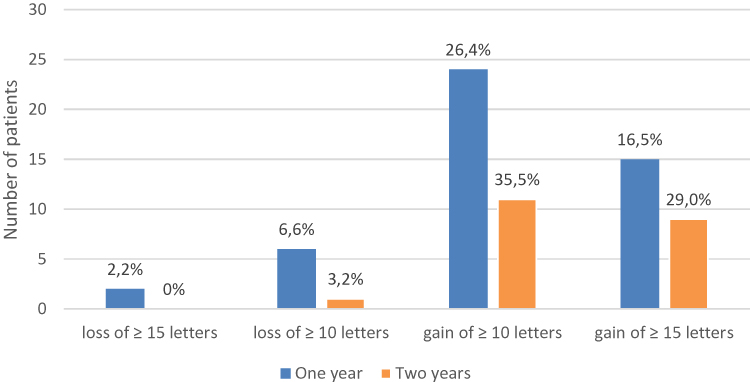 |
Figure 2 Change in visual acuity from baseline after one and two years of observation. Number of patients is provided on the y-axis. Bar figures indicate the number of patients (%) with a certain gain/loss of letters compared to all observed patients at this timepoint. |
Structural Outcomes
In comparison to baseline, a statistically significant decrease of CRT was observed for all time-points (Figure 1; Supplemental Table 1). Improvement was greatest at the first observational time-point (342 ± 115 µm at 30 days from 419 ± 174 µm at baseline; p=0.133) and decreased progressively up to a steady-state (approximately 300 µm) after 90 days (p=0.01) until the end of the observation period. Likewise, statistically significant improvement compared to baseline was observed for TVOL (Figure 3; Supplemental Table 1). Total macular volumes decreased from 10.12 ± 2.05 mm3 at baseline up to a plateau of approximately 9 mm3 after 180 days (p≤ 0.01).
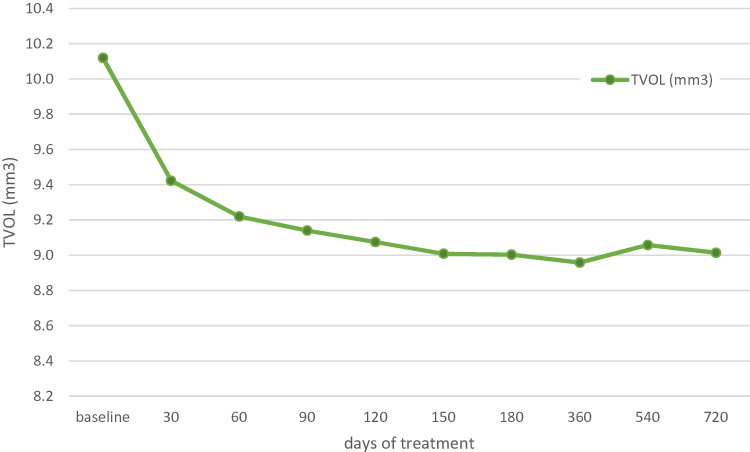 |
Figure 3 Total volume (TVOL) of the macular ETDRS grid during observation period. |
Outcomes Stratified by Baseline Visual Acuity
VA at baseline has previously been described as an independent predictor of visual and structural outcomes following treatment with anti-angiogenic therapy in DME.24 The median BCVA was 60 letters in this cohort. This cut off was used to stratify our results accordingly. Our data shows that gain in VA was higher in eyes with baseline VA < 60 letters compared to those ≥60 letters (Figure 4, Supplemental Table 3). Mean baseline VA of the cohort with a baseline VA < 60 letters were 47.1 ± 8.4 letters, which improved to 53.4 ± 14.3 and 63.1 ± 15.4 letters at years one and two, respectively (both, p≤ 0.01). This contrasts with eyes with a baseline VA ≥ 60 where the mean VA at baseline was 71.6 ± 7.3 compared to 73.4 ± 10.3 and 73.4 ± 7.6 after one (p=0.01) and two years (p=0.06), respectively. When compared to baseline, mean changes in VA were statistically significant for all timepoints in the <60 letters cohort. However, statistically significant differences in the ≥60 letters groups were only evident at 90, 180, and 540-day timepoints (Supplemental Table 3).
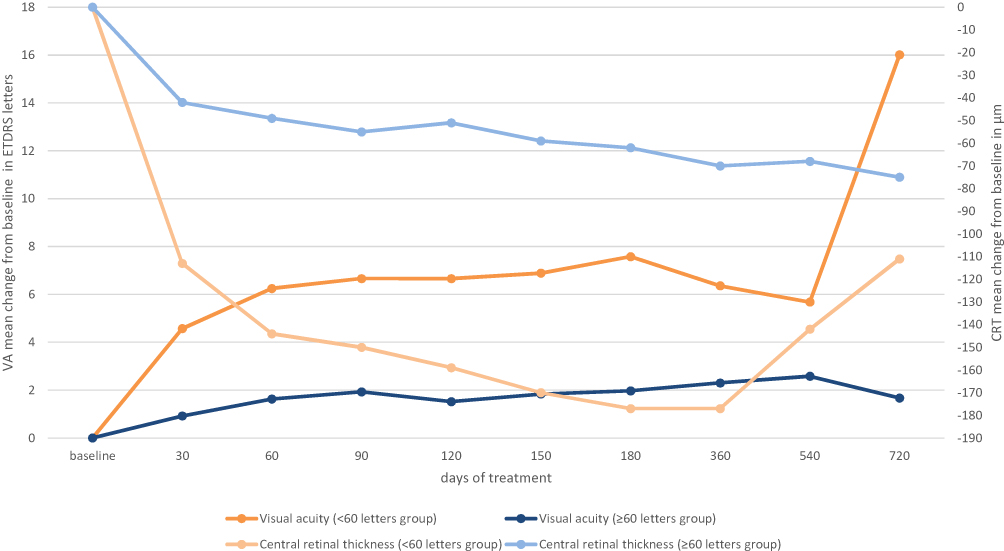 |
Figure 4 Change in visual acuity (y-axis left) and central retinal thickness (y-axis right) from baseline over observation period stratified by baseline visual acuity. |
A similar trend was observed for structural outcomes: Eyes with baseline VA ≥ 60 letters showed lower absolute CRT values than those <60 letters at year one (314 µm and 285 µm, respectively) and two (318 µm and 280 µm, respectively), but the cohort with baseline VA < 60 letters featured the greatest improvement of CRT (Figure 4, Supplemental Table 3). Improvement in CRT was statistically significant for both subgroups for all timepoints (p≤ 0.01).
Discussion
Main Findings
In DME patients treated with aflibercept only, we observed statistically significant improvements in VA and CRT after one and two years. Mean injections delivered per study eye over one and two years were 5.5 and 8.7, respectively. The lower amount of injections administered during the second year of treatment might be related to the disease-modifying character of anti–VEGF in DME.25 VA increased by 4.8 and 9.2 letters in years one and two when compared to baseline (60.1 ± 14.5 letters; p≤ 0.01). This functional improvement went along with a decrease in CRT from 419 µm to 298 µm after one year and to 319 µm after two years. From 139 eyes at baseline, treatment duration was less than the observation period in 48 (34.5%) and 108 (77.7%) eyes after year one and year two for reasons discussed later.
Clinical Outcomes in RCTs are Superior to Real-Life Data
In RCTs with fixed injection regimes of ranibizumab, the visual and structural outcomes were superior to our study results.12,13,26,27 This was likely achieved through higher treatment frequency with up to 12 and 22 injections after years one and two, respectively. Indeed, similar results are reported in RCTs assessing the efficacy of aflibercept therapy only, with again up to 12 delivered injections per study eye over one year.13,26 Throughout all RCTs cited above, the gain in VA was greater than what was observed in our real-life cohort study (4.8 letters after one year). A concomitant and similar trend in CRT is present, with the RCTs reporting a decrease of 169 µm to 195 µm at year one in contrast to 121 µm in this real-life cohort. In addition to higher injection numbers, stricter patient selection, exclusion of non-adherent patients, and early detection of complications may account for the difference in outcomes observed between cohorts in clinical trials and everyday clinic.28
Comparing Our Results to Published Real-Life Data
Several real-life studies have been published for ranibizumab in DME treatment.2,15,17,18,29-32 A commonality of these studies is that the number of injections, functional outcomes, and structural outcomes are comparatively worse than in the pivotal RCTs. Even though our study reports values that are consistent with the real-life data previously published for DME patients undergoing anti–VEGF treatment, direct comparison is impossible. The heterogeneity between the retrospective cohorts as well as treatment outcomes can be overseen in Table 2. A French study group reported a gain of 10.7 letters at 12 months from only 5.4 injections, which seems outstanding at the first glance. In fact, this above-average gain is resulting from the cohorts’ low baseline VA of only 48 letters, which has been described as an independent predictive factor in anti–VEGF treatment for DME.24 Our results fit into the decrease in CRT after one year, which ranges between 20% and 30% from baseline, independently of baseline thickness.2,15,17,29,32 Almost 90% of DME patients have a sponge-like structure on OCT which causes diffuse retinal swelling.33 Therefore, both CRT and TVOL should be considered when observing treatment outcomes in eyes with DME. Total macular volume in healthy eyes is reported to be around 8.5 mm3.34 We observed a TVOL of approximately 9 mm3 in DME patients undergoing intravitreal treatment after two years, which might suggest residual cystoid fluid within the macular area even after long-term treatment.
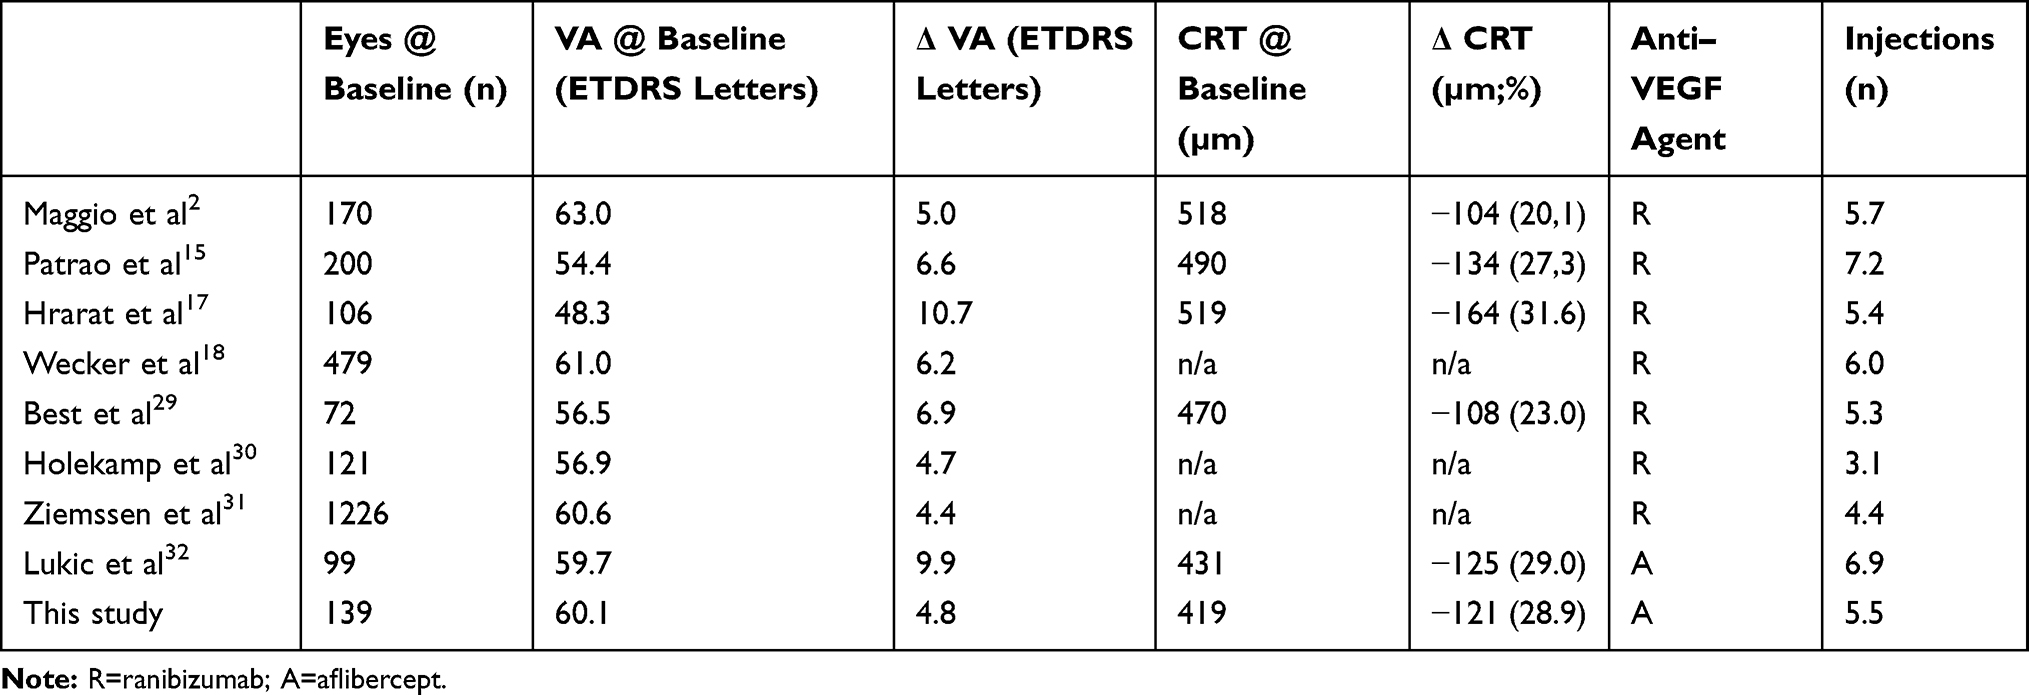 |
Table 2 Selected Retrospective Real-Life Results of Eyes Treated with Anti–VEGF for DME After 12 Months. For VA, CRT and Number of Injections Mean Values are Reported |
So far, real-life data on aflibercept treatment in eyes with DME is rare. A recently published study including 102 eyes from the United Kingdom describes a similar structural improvement in patients treated with aflibercept only as observed in this study.32 Interestingly, the one-year visual acuity gain was higher than in our cohort (+9.9 vs. +4.8 ETDRS letters). An explanation for this fact might be as published before, the struggle with low compliance and high non-adherence rates of our patients.28 This results in a lower amount of injections delivered per study eye (6.9 vs. 5.5), concomitantly resulting in a lower gain of VA in this cohort.
Reasons for Treatment Period Being Less Than Observation Period
Generally, a retrospective cohort study is more error-prone than a prospective observational study due to the high lost-to-follow-up rate.35 We report 34.5% (48 eyes) and 77.7% (108 eyes) not being observed further onward beyond year one and two, respectively. The main reason for this in our dataset is that the treatment duration of study eyes is less than the observation period. There are several reasons for treatment duration being less than observation period: (i) study eyes received an upload of three aflibercept injections before being referred to their private ophthalmologist for further treatment; (ii) intravitreal therapy has been finished successfully; (iii) real loss-to-follow up. In total 20 out of 139 eyes were discharged after an initial upload of 3 aflibercept injections to further care of a not hospital-based ophthalmologist. In 43 and 87 eyes respectivley, the therapy has been finished successfully before the observation point after one and two years was reached. Calculating the difference between eyes not being further observed and category (i) and (ii) leaves us with an estimated real loss-to-follow- up rate compared to a baseline of 3.5% (5 eyes) after year one and 13.7% (19 eyes) after year two. Poor compliance and treatment adherence are known explanations for lost-to-follow-up in patients treated for DME.28 We used appropriate statistical methods and a last-observation-carried-forward approach for the last observation point to minimize the bias resulting from eyes with observation time being less than study time. We are fulfilling the recommended follow-up threshold being above 60% for our one-year results.35
Implications for Practice and Research
This study implies that functional and structural outcomes achieved with aflibercept as a first-line agent for DME are comparable to the results achieved with ranibizumab in a real-life setting. Prospective multicenter studies comparing aflibercept and ranibizumab in a real-life setting are necessary to verify treatment outcomes, even though in the light of the high inconsistency of real-life cohorts (Table 2). Moreover, the comparability between available anti–VEGF agents should be addressed specifically to obtain results with a higher level of evidence.
Interestingly, each eye should have received eight injections within the first year if the treatment regimen (as according to the label) was followed strictly. This is 2.5 injections more than observed in this study with a mean number of 5.5 injections. Reasons for this mismatch include all, cancelled or not attended appointments from the patient side as well as holidays or administrative reasons such as capacity constraints. The identification of these reasons is an important aim for further studies. Improvement in treatment frequency can only be achieved if the limiting factors are well known. Two-year functional and structural outcomes provided by this study give an estimate about the therapeutic regime in DME patients when choosing aflibercept as a first-line anti–VEGF agent. Informing the patient about the probable number of delivered injections during year one and two of treatment may be beneficial for compliance and adherence.
Conclusion
Almost all RCTs report better functional and structural outcomes than real-life observations. The limited capacity of everyday practice and patient behavior (ie, missed and cancelled appointment) result in fewer injections and therefore worse outcomes in real-life cohorts. More than a third of eyes gained more than 10 ETDRS letters, compared to 3% of eyes losing the same number of letters for two years observation period. Here, we report outcomes consistent with previously reported real-life data in ranibizumab patients, thus providing further evidence that intravitreal aflibercept is an effective treatment for DME patients to achieve positive functional and structural outcomes over a minimum of two years.
Data Sharing Statement
The data described in this article are openly available in the Open Science Framework at DOI:10.17605/OSF.IO/TPA6U.
Acknowledgments
This study was funded by the Bayer AG, Leverkusen, Germany. We want to thank or statistician Dr. Michael Müller for his effort and expertise in analysing the data.
Disclosure
Christoph Kern reports grants from Zeiss Meditech; and speaking fees from Bayer AG, outside the submitted work. Benedikt Schworm reports personal fees from Novartis Pharma, personal fees from Topcon Corporation, outside the submitted work. Dawn Sim reports financial support from Bayer AG, Leverkusen, Germany; financial support from Novartis AG, Basel, Switzerland; being a consultant for Big Picture Eye Health, Australia; financial support from Allergan Inc, Dublin, Ireland; and financial support from Haag-Streit Holding, Köniz, Switzerland. Tina Herold reports speaking fees from Bayer AG, Leverkusen, Germany; Novartis AG, Basel, Switzerland; Allergan AG, Dublin, Ireland. Siegfried Priglinger reports speaking fees from Bayer AG, Leverkusen, Germany; Novartis AG, Basel, Switzerland; Allergan AG, Dublin, Ireland; Alcon, Fort Worth, USA; and Zeiss, Oberkochen, Germany. Karsten Kortuem repots grants from Alcon, Allergan, Bayer, and Heidelberg Engineering; Financial support from Bayer and Novartis; and was a consultant for Big Picture.
References
1. Kiss S, Liu Y, Brown J, et al. Clinical utilization of anti-vascular endothelial growth-factor agents and patient monitoring in retinal vein occlusion and diabetic macular edema. Clin Ophthalmol. 2014;8:1611–1621. doi:10.2147/OPTH
2. Maggio E, Sartore M, Attanasio M, et al. Anti-VEGF treatment for diabetic macular edema in a real-world clinical setting. Am J Ophthalmol. 2018;195:209–222. doi:10.1016/j.ajo.2018.08.004
3. Granstrom T, Forsman H, Lindholm Olinder A, et al. Patient-reported outcomes and visual acuity after 12months of anti-VEGF-treatment for sight-threatening diabetic macular edema in a real world setting. Diabetes Res Clin Pract. 2016;121:157–165. doi:10.1016/j.diabres.2016.09.015
4. Fong DS, Luong TQ, Contreras R, et al. Treatment patterns and 2-year vision outcomes with bevacizumab in diabetic macular edema: an analysis from a large U.S. integrated health care system. Retina. 2017.
5. Ogurtsova K, da Rocha Fernandes JD, Huang Y, et al. IDF diabetes atlas: global estimates for the prevalence of diabetes for 2015 and 2040. Diabetes Res Clin Pract. 2017;128:40–50. doi:10.1016/j.diabres.2017.03.024
6. Cheung N, Mitchell P, Wong TY. Diabetic retinopathy. Lancet. 2010;376(9735):124–136. doi:10.1016/S0140-6736(09)62124-3
7. Ding J, Wong TY. Current epidemiology of diabetic retinopathy and diabetic macular edema. Curr Diab Rep. 2012;12(4):346–354. doi:10.1007/s11892-012-0283-6
8. Ford JA, Lois N, Royle P, Clar C, Shyangdan D, Waugh N. Current treatments in diabetic macular oedema: systematic review and meta-analysis. BMJ Open. 2013;3(3):e002269. doi:10.1136/bmjopen-2012-002269
9. Michaelides M, Kaines A, Hamilton RD, et al. A prospective randomized trial of intravitreal bevacizumab or laser therapy in the management of diabetic macular edema (BOLT study) 12-month data: report 2. Ophthalmology. 2010;117(6):1078–1086 e1072. doi:10.1016/j.ophtha.2010.03.045
10. Massin P, Bandello F, Garweg JG, et al. Safety and efficacy of ranibizumab in diabetic macular edema (RESOLVE Study): a 12-month, randomized, controlled, double-masked, multicenter Phase II study. Diabetes Care. 2010;33(11):2399–2405. doi:10.2337/dc10-0493
11. Mitchell P, Bandello F, Schmidt-Erfurth U, et al. The RESTORE study: ranibizumab monotherapy or combined with laser versus laser monotherapy for diabetic macular edema. Ophthalmology. 2011;118(4):615–625. doi:10.1016/j.ophtha.2011.01.031
12. Nguyen QD, Brown DM, Marcus DM, et al. Ranibizumab for diabetic macular edema: results from 2 Phase III randomized trials: RISE and RIDE. Ophthalmology. 2012;119(4):789–801. doi:10.1016/j.ophtha.2011.12.039
13. Korobelnik JF, Do DV, Schmidt-Erfurth U, et al. Intravitreal aflibercept for diabetic macular edema. Ophthalmology. 2014;121(11):2247–2254. doi:10.1016/j.ophtha.2014.05.006
14. Lazzara F, Fidilio A, Platania CBM, et al. Aflibercept regulates retinal inflammation elicited by high glucose via the PlGF/ERK pathway. Biochem Pharmacol. 2019;168:341–351. doi:10.1016/j.bcp.2019.07.021
15. Patrao NV, Antao S, Egan C, et al. Real-world outcomes of ranibizumab treatment for diabetic macular edema in a United Kingdom National health service setting. Am J Ophthalmol. 2016;172:51–57. doi:10.1016/j.ajo.2016.09.002
16. Vorum H, Olesen TK, Zinck J, Storling Hedegaard M. Real world evidence of use of anti-VEGF therapy in Denmark. Curr Med Res Opin. 2016;32(12):1943–1950. doi:10.1080/03007995.2016.1221803
17. Hrarat L, Fajnkuchen F, Boubaya M, et al. Outcomes after a 1-year treatment with ranibizumab for diabetic macular edema in a clinical setting. Ophthalmologica. 2016;236(4):207–214. doi:10.1159/000453006
18. Wecker T, Ehlken C, Buhler A, et al. Five-year visual acuity outcomes and injection patterns in patients with pro-re-nata treatments for AMD, DME, RVO and myopic CNV. Br J Ophthalmol. 2017;101(3):353–359. doi:10.1136/bjophthalmol-2016-308668
19. Kortum K, Kern C, Meyer G, Priglinger S, Hirneiss C. [Required framework for the collection of real-life data: an example from University Eye Hospital Munich]. Klin Monbl Augenheilkd. 2017;234(12):1477–1482. doi:10.1055/s-0043-115900
20. Kortum KU, Muller M, Kern C, et al. Using electronic health records to build an ophthalmologic data warehouse and visualize patients’ data. Am J Ophthalmol. 2017;178:84–93. doi:10.1016/j.ajo.2017.03.026
21. Organization WH. International statistical classification of diseases and related health problems 10th revision; 2018. Available from: https://www.who.int/classifications/icd/icdonlineversions/en/.
22. Eylea (Aflibercept) - product information; 2018. Available from: https://www.ema.europa.eu/documents/product-information/eylea-epar-product-information_en.pdf.
23. Team RC. R: a language and environment for statistical computing; 2018. Available from: http://www.R-project.org.
24. Virgili G, Parravano M, Evans JR, Gordon I, Lucenteforte E. Anti-vascular endothelial growth factor for diabetic macular oedema: a network meta-analysis. Cochrane Database Syst Rev. 2018;10:Cd007419.
25. Bressler SB, Odia I, Glassman AR, et al. Changes in diabetic retinopathy severity when treating diabetic macular edema with ranibizumab: drcr.net Protocol I 5-year report. Retina. 2018;38(10):1896–1904. doi:10.1097/IAE.0000000000002302
26. Wells JA, Glassman AR, Ayala AR, et al. Aflibercept, bevacizumab, or ranibizumab for diabetic macular edema: two-year results from a comparative effectiveness randomized clinical Trial. Ophthalmology. 2016;123(6):1351–1359. doi:10.1016/j.ophtha.2016.02.022
27. Prunte C, Fajnkuchen F, Mahmood S, et al. Ranibizumab 0.5 mg treat-and-extend regimen for diabetic macular oedema: the Retain study. Br J Ophthalmol. 2016;100(6):787–795. doi:10.1136/bjophthalmol-2015-307249
28. Weiss M, Sim DA, Herold T. et al. Compliance and adherence of patients with diabetic macular edema to intravitreal anti-vascular endothelial growth factor therapy in daily practice. Retina. 2017:1. doi:10.1097/IAE.0000000000001892
29. Best AL, Fajnkuchen F, Nghiem-Buffet S, et al. Treatment efficacy and compliance in patients with diabetic macular edema treated with ranibizumab in a real-life setting. J Ophthalmol. 2018;2018:4610129.
30. Holekamp NM, Campbell J, Almony A, et al. Vision outcomes following anti-vascular endothelial growth factor treatment of diabetic macular edema in clinical practice. Am J Ophthalmol. 2018;191:83–91. doi:10.1016/j.ajo.2018.04.010
31. Ziemssen F, Wachtlin J, Kuehlewein L, et al. Intravitreal ranibizumab therapy for diabetic macular edema in routine practice: two-year real-life data from a non-interventional, multicenter study in Germany. Diabetes Ther. 2018;9(6):2271–2289. doi:10.1007/s13300-018-0513-2
32. Lukic M, Williams G, Shalchi Z, et al. Intravitreal aflibercept for diabetic macular oedema: moorfields’ real-world 12-month visual acuity and anatomical outcomes. Eur J Ophthalmol. 2019:1120672119833270.
33. Otani T, Kishi S, Maruyama Y. Patterns of diabetic macular edema with optical coherence tomography. Am J Ophthalmol. 1999;127(6):688–693. doi:10.1016/S0002-9394(99)00033-1
34. Pokharel A, Shrestha GS, Shrestha JB. Macular thickness and macular volume measurements using spectral domain optical coherence tomography in normal Nepalese eyes. Clin Ophthalmol. 2016;10:511–519. doi:10.2147/OPTH.S95956
35. Kristman V, Manno M, Côté P. Loss to follow-up in cohort studies: how much is too much? Eur J Epidemiol. 2004;19(8):751–760. doi:10.1023/B:EJEP.0000036568.02655.f8
 © 2020 The Author(s). This work is published and licensed by Dove Medical Press Limited. The
full terms of this license are available at https://www.dovepress.com/terms
and incorporate the Creative Commons Attribution
- Non Commercial (unported, 3.0) License.
By accessing the work you hereby accept the Terms. Non-commercial uses of the work are permitted
without any further permission from Dove Medical Press Limited, provided the work is properly
attributed. For permission for commercial use of this work, please see paragraphs 4.2 and 5 of our Terms.
© 2020 The Author(s). This work is published and licensed by Dove Medical Press Limited. The
full terms of this license are available at https://www.dovepress.com/terms
and incorporate the Creative Commons Attribution
- Non Commercial (unported, 3.0) License.
By accessing the work you hereby accept the Terms. Non-commercial uses of the work are permitted
without any further permission from Dove Medical Press Limited, provided the work is properly
attributed. For permission for commercial use of this work, please see paragraphs 4.2 and 5 of our Terms.