Back to Journals » Clinical Ophthalmology » Volume 13
Two-year analysis of changes in the optic nerve and retina following anti-VEGF treatments in diabetic macular edema patients
Authors Filek R, Hooper P, Sheidow TG ![]() , Gonder J, Chakrabarti S
, Gonder J, Chakrabarti S ![]() , Hutnik CML
, Hutnik CML ![]()
Received 28 December 2018
Accepted for publication 10 May 2019
Published 1 July 2019 Volume 2019:13 Pages 1087—1096
DOI https://doi.org/10.2147/OPTH.S199758
Checked for plagiarism Yes
Review by Single anonymous peer review
Peer reviewer comments 2
Editor who approved publication: Dr Scott Fraser
Richard Filek,1 Phil Hooper2,3 Tom G Sheidow2,3 John Gonder2,3 Subrata Chakrabarti,1 Cindy ML Hutnik1–3
1Department of Pathology and Laboratory Medicine, Western University, London, ON, Canada; 2Department of Ophthalmology, Western University, London, ON, Canada; 3Ivey Eye Institute, St. Joseph’s Health Care London, London, ON, Canada
Purpose: To evaluate long-term structural and functional changes that happen to the optic nerve and retina following ranibizumab (Lucentis) injections in diabetic macular edema (DME) patients.
Methods: Patients with clinically significant DME requiring anti-VEGF injections underwent pre-injection baseline, 6, 12, and 24 month follow-up tests. The tests performed were optical coherence tomography (OCT), best-corrected visual acuity (BCVA), and visual field (VF). Wide-field fluorescein angiogram (IVFA) was performed to monitor the progression of diabetic ischemia.
Results: A total of 30 patients requiring anti-VEGF injections and 21 control patients not requiring anti-VEGF injections were enrolled in the study. From baseline, the average macular thickness significantly decreased (p<0.0002) over the 24-month time period. Mean perfused ratio significantly increased (p<0.0005) at 6, 12, and 24 months. Cup volume and vertical cup-to-disk ratio significantly increased (p<0.0014) over the study period. This was verified by masked independent grading of patient optic nerve stereo-photographs by glaucoma specialists. BCVA significantly (p<0.0006) improved over the study period. VFs showed a non-significant trend of deteriorating peripheral vision at 12 and 24 months.
Conclusion: Clinically, anti-VEGF therapy appears to affect the optic nerve by increasing cup volume and increasing vertical cup/disk ratio over time. The results provide a cautionary note to monitor both the retina and optic nerve status in patients undergoing frequent injections.
Keywords: diabetic macular edema, retina, optic nerve, anti-VEGF, lucentis, ranibizumab
Introduction
Diabetic macular edema (DME) is a common complication of diabetic retinopathy (DR). During DR, chronic hyperglycemia results in enhanced production of VEGFs, advanced glycation end products, nitric oxide, oxidative stress, and inflammation.1 The aforementioned factors disrupt the blood retinal barrier, increasing permeability, causing interstitial fluid accumulation and the development of DME.2 Inhibition of these factors can reduce the development of fluid-filled cysts.3 At the present time, the gold standard first line of treatment clinically used to treat DME patients is intravitreal anti-VEGF injections.4
In the human body, the VEGF family consists of VEGF-A, -B, -C, -D and PlGF. VEGF-A is the key target in DME therapy since it is the major driver of increased endothelial permeability and angiogenesis.5 Anti-VEGF treatment is administered through a transcleral intravitreal injection in the office setting. The therapy aims to decrease macular swelling through inhibiting the actions of VEGF by preventing the binding of VEGF to its receptor. As the result of inhibition, vascular permeability, endothelial cell proliferation, and endothelial cell migration are significantly reduced.5,6
Over the past decade, there have been increased clinical reports of diabetic patients receiving anti-VEGFs developing signs of glaucoma and optic neuropathy. Diabetes is a risk factor for the development of glaucoma and the use of anti-VEGFs might augment the risk.7 Past studies have analyzed the safety of intravitreal anti-VEGF injections in age-related macular degeneration (AMD) and DME, but none have examined the effects of the treatments on the optic nerve.8–19 Studies have also reported a sustained increase in intraocular pressure (IOP) following intravitreal injections of anti-VEGFs in AMD patients.20–24 With the continued and increased use of anti-VEGF, numerous questions have been raised in regards to whether they have a role in increasing the risk of developing glaucoma and what are the long-term effects of the IOP spikes.20,25 The results of controlled trials that not only look at visual acuity and central macular thickness but also the optic nerve, are greatly needed to substantiate the safety and efficacy of anti-VEGF drugs for DME patients.
The purpose of the following study was to determine whether the use of ranibizumab (Lucentis), an anti-VEGF, results in structural and functional changes to the retina and optic nerve of DME patients over a 2-year time period. This is the first comprehensive study to investigate the long-term structural and functional effects of anti-VEGF treatments on the retina and optic nerve that involves the analysis of macular thickness, mean perfusion, vertical cup-to-disk (C/D) ratio, cup volume, stereo photos, IOP, visual acuity, and visual fields (VFs).
Methods
The prospective study was conducted at the Ivey Eye Institute in London, ON, Canada. Ivey Eye Institute is a tertiary care academic center. The study was approved by Health Sciences Research Ethics Board of Western University and complies with the Declaration of Helsinki. Prospective, treatment-naïve diabetic patients with at least one eye having clinically significant DME (central macular thickness >300 μm) according to the ETDRS guidelines and requiring intravitreal anti-VEGF injections were recruited into the study. Participants were over the age of 18 years. Participants were excluded from the study if they had prior intravitreal anti-VEGF injections, advanced lens opacity, cataracts that could affect diagnostic testing, history of glaucoma, any other disorder of the optic nerve (optic neuropathy, neuritis, uveitis or retinal degeneration), presence/development of proliferative disease, and prior retinal treatment (PRP, focal laser or surgery within 6 months of participation). All participants provided written informed consent. Diabetic patients who did not have clinically significant macular edema and did not require anti-VEGF treatment or other retinal treatments were chosen as control. Participants were evaluated at pre-injection baseline and at 6, 12, and 24 months post-baseline. During each study visit, participants underwent optical coherence tomography (OCT), VF, and intravenous fluorescein angiography (IVFA) testing as well as a standard ophthalmic exam which included Snellen best-corrected visual acuity (BCVA), intraocular measurement using Goldmann applanation tonometer, and slit lamp examination. Humphrey 24-2 SITA VF testing was performed with undilated eyes.
OCT
Measurement of the macula and optic nerve through the macular thickness, optic disc cube, and HD 5-line raster imaging tests were performed with OCT (Cirrus HD-OCT 4000, Carl Zeiss Meditech AG, Jena, Germany). The principles and protocol have been previously described in detail.26–28 OCT tests were performed at pre-injection baseline and at 6, 12, and 24 months post-baseline. The scan at each time of measurement was repeated three times to ensure highest signal strength.
Macular analysis was performed by 6×6 mm scans with a 512×128 resolution (128 horizontal scan lines consisting of 512 A-scans). Macular thickness was displayed as three concentric circles; a 1 mm diameter central circular subfield, a 3 mm diameter inner ring, and a 6 mm diameter outer ring. Each ring was divided into four quadrants; superior, inferior, nasal, and temporal.29 For the optic nerve scan, 768 A-scans were performed on a 3.4 mm diameter ring centered on the optic nerve.30,31 HD 5-line raster performed 4,096 A-scans in five planes to provide a highly detailed image of the retinal structure.31
Humphrey VF analyzer
To measure peripheral VFs, a standard Humphrey 24-2 SITA testing algorithm was performed on a Humphrey Field Analyzer, model 750i (Zeiss Humphrey Systems). In the Humphrey 24-2 SITA testing algorithm, 54 individual points are tested. The threshold values calculated from the individual points are then compared to a normative database for similar aged normal-sighted individuals.32 Participants that had false positive responses greater than 15%, fixation losses, and false negative responses greater than 20% were excluded from the study.33
Wide-field fluorescein angiogram and quantification of ischemia
Wide-field fluorescein angiography was performed on the Optos 200 Tx with an intravenous injection of 5 mL of 10% sodium fluorescein.34 IVFA photos and digital stereoscopic photographs were taken. To quantify the amount of ischemia in each patient, the best IVFA image obtained during the arteriovenous phase was used. For analysis, the uncompressed tiff images were transferred from the Optos V2 Vantage Review Software to Adobe software (Adobe Systems Incorporated, San Jose, CA, USA).
Two graders who were masked to the study quantified the amount of ischemia in each patient by using the concentric rings method which has been previously described in detail.35 In this method, the innermost circle was first centered on the optic nerve to be sized proportionately and then repositioned to be fovea-centered. The 12 segments in each of the rings were graded as, “perfused” or “non-perfused” if more than 50% of the segment showed either a perfused or non-perfused morphology. The classification of “non-perfused” and “perfused” morphology was taken from the SCORE study. In the control and anti-VEGF injected eyes, “non-perfused” was characterized by a darker appearance of the retina and pruned tree appearance (narrowed and difficult to see) of surrounding arterioles. “Perfused” morphology was characterized by its clear ground-glass opacity.36 Calculations of the mean perfused ratio were performed using the mean perfusion ratio = area perfused/(area perfused + non-perfused). Each segment in each of the rings was given a value of either 0 indicating non-perfused, or 1 indicating perfused retina.
Optic nerve grading
Stereoscopic photographs were taken with Optos 200 Tx at baseline, 6, 12, and 24 months post-baseline injection. Photographs were cropped to a size of 4×4 mm for optic nerve grading. Two glaucoma specialists independently graded the C/D ratio of the anti-VEGF injected eyes and control eyes of diabetic patients not requiring injections. The graders were masked to the type of patients and purpose of the study.
Ranibizumab (Lucentis) injections
During the induction phase, participants received monthly intravitreal injections of ranibizumab (Lucentis, 0.5 mg in 0.05 mL solution for injection; Novartis International AG, Basel, Switzerland) for 3 months. Post-3 months, participants received injections on an as-needed basis until they were clinically stable based on their OCT tests and clinical assessment. Ranibizumab treatment was reinitiated if BCVA decreased by five letters or if central macular thickness became greater than 300 μm.
Statistical analysis
Data were analyzed using GraphPad Prism 5 (GraphPad Software, Inc., La Jolla, CA, USA). Snellen BCVA measurements were converted to logMAR scores for statistical analysis. To compare the average age of the patients, an unpaired t-test was performed and to compare the percentage of female participants between control and anti-VEGF groups, a Fisher’s exact test was used. To statistically analyze the changes in measurements within the anti-VEGF and control groups at baseline, 6, 12, and 24 months, respectively, repeated measures ANOVA with a Bonferroni’s multiple comparisons test was used. All data were expressed as mean ± SD and accepted as statistically significant if p<0.05.
To calculate the sample size with an overall power of 80%, p<0.05 was used as an acceptable significance level. Using a two-tailed test, for a control with an optic nerve C/D ratio of 0.3 and an atrophy group of size 0.6, the effect size would be 0.3. Adding the values to the sample size calculation, it was calculated that 16 patients would be needed for an 80% power number. Thirty-six diabetic patients requiring anti-VEGF injections were recruited into the study but four were removed due to patient compliance and two for developing proliferative disease and requiring PRP treatment. Twenty-one patients were used as diabetic controls not requiring anti-VEGF injections. The diabetic control group did not have proliferative disease that developed during the 2-year study period. The control was included to ensure that the observed changes could be correlated with the anti-VEGF treatments and not due to diabetic disease itself.
Results
A single eye from each of the 30 patients requiring anti-VEGF injections and 21 control patients not requiring anti-VEGF injections, who were recruited between September 11, 2014 and July 23, 2015, was analyzed. The average age of patients was 67.7±7.5 years for the control group and 63.9±6.8 years for the anti-VEGF group. The average length of diabetes for the control group was 16.4±11.8 years and 15.5±10.5 years for the anti-VEGF group. The control group had 33.3% female participants while the anti-VEGF group had 43.3% female participants. The control and anti-VEGF groups did not significantly differ (p>0.05) in any of these categories (Table 1). None of the patients developed proliferative DR during the study. Patients received a mean ± SD of 9.6±5.3 injections ranging from 4–22 injections.
 |
Table 1 Demographics of patients involved in the study |
Following anti-VEGF treatment, the macular thickness (Figure 1A) significantly decreased by 27.9 µM at 6 months (313.60±39.87 µM, p=0.0002) relative to baseline (341.50±55.33 µM). The macular thickness further decreased to 309.80±33.80 µM at 12 months (p=0.0001) and 303.40±32.16 µM at 24 months (p=0.0001). Compared to baseline (287.70±29.36 µM), the control group showed no significant change in macular thickness at 6 months (286.70±27.83 µM, p=0.51), 12 months (289.40±31.84 µM, p=0.51), or 24 months (288.20±32.89 µM, p=0.84).
 |
Figure 1 Interval changes in (A) macular thickness, and (B) mean perfused ratio at baseline, 6, 12, and 24 months in the control and anti-VEGF groups. P-value: control group differences between baseline and follow-up measurements, paired t-test. P’-value: anti-VEGF group differences between baseline and follow-up measurements, paired t-test. |
The mean perfused ratio showed a significant improvement at 6 months (0.65±0.09, p=0.0005), 12 months (0.67±0.10, p=0.0001), and 24 months (0.67±0.09, p=0.0001) compared to baseline (0.62±0.09) for the anti-VEGF group (Figure 1B). There was no significant difference in the control group at 6 months (0.60±0.11, p=0.33), 12 months (0.60±0.11, p=0.33) or 24 months (0.60±0.11, p=0.86) compared to baseline (0.60±0.11).
Analysis of the optic nerve and the associated cup volume by OCT (Figure 2) showed a significant increase at 6 (0.094±0.10, p=0.02), 12 (0.096±0.10, p=0.007), and 24 months (0.095±0.10, p=0.03) compared to baseline (0.089±0.1). Cup volume remained consistent and showed no significant difference in the control group at 6 (0.110±0.13, p=0.09), 12 (0.111±0.13, p=0.56), and 24 months (0.116±0.13, p=0.86) compared to baseline (0.115±0.13).
 |
Figure 2 Interval changes in cup volume measured on optical coherence tomography (OCT) at baseline, 6, 12, and 24 months in the control and anti-VEGF groups. P-value: control group differences between baseline and follow-up measurements, paired t-test. P’-value: anti-VEGF group differences between baseline and follow-up measurements, paired t-test. |
Vertical C/D ratio by OCT (Figure 3) showed a significant increase at 6 months (0.42±0.20, p=0.0014), 12 months (0.43±0.19, p=0.0009), and 24 months (0.44±0.18, p=0.0009) compared to baseline (0.39±0.21). Vertical C/D ratio remained consistent in the control group, being 0.47±0.24 at baseline, 0.47±0.22 at 6 months (p=0.95), 0.47±0.22 at 12 months (p=0.92), and 0.54±0.23 at 24 months (p=0.86). When assessing participants receiving less than ten injections (n=15) and those who received ten or more injections (n=15), participants who received ten or more injections showed a significant increase in the vertical C/D ratio at 6 months (0.48±0.16, p=0.03), 12 months (0.49±0.14, p=0.01), and 24 months (0.50±0.14, p=0.002) compared to baseline (0.44±0.18) (Figure 4). Participants who received less than ten injections showed a non-significant increase in the vertical C/D ratio at 6 months (0.36±0.22, p=0.10), 12 months (0.37±0.22, p=0.08) or 24 months (0.38±0.21, p=0.07) compared to baseline (0.33±0.23).
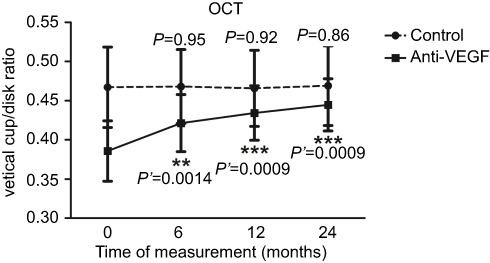 |
Figure 3 Interval changes in vertical cup/disk ratio measured on optical coherence tomography (OCT) at baseline, 6, 12, and 24 months in the control and anti-VEGF groups. P-value: control group differences between baseline and follow-up measurements, paired t-test. P’-value: anti-VEGF group differences between baseline and follow-up measurements, paired t-test. |
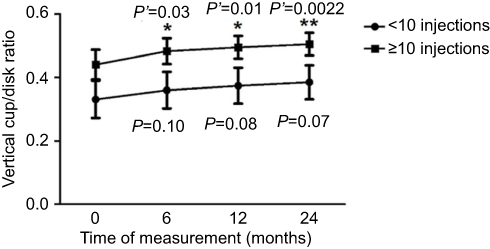 |
Figure 4 Interval changes in vertical cup/disk ratio measured on optical coherence tomography at baseline, 6, 12, and 24 months in participants receiving less than ten injections and ten or more injections. P-value: differences between baseline and follow-up measurements of participants receiving less than ten injections, paired t-test. P’-value: differences between baseline and follow-up measurements of participants receiving ten or more injections, paired t-test. |
Two glaucoma specialists were assigned to independently grade the vertical C/D ratios in the same eyes that received anti-VEGF injections using stereo-photographs (Figure 5A). Both grader 1 and 2 indicated there was a significant increase in the vertical C/D ratio over the course of 2 years. At baseline, the mean vertical C/D was 0.309±0.17 and grader 1 noted an increase at 6 months (0.320±0.16, p=0.06), with a further significant increase at 12 months (0.322±0.17, p=0.03) and 24 months (0.324±0.17, p=0.03). Grader 2 indicated baseline mean vertical C/D ratio of 0.309±0.11 and noted a significant increase at 6 months (0.338±0.11, p=0.02), with a further increase at 12 months (0.353±0.12, p=0.005) and 24 months (0.379±0.14, p=0.0006). The graders also graded control eyes of diabetic patients not requiring anti-VEGF treatment. Both grader 1 and 2 found that over 24 months, there was no significant difference (p≥0.17) (Figure 5B).
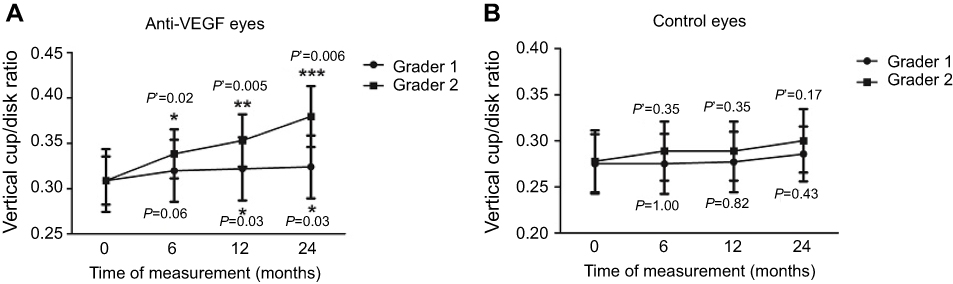 |
Figure 5 Interval changes in vertical cup/disk ratio measured by two masked glaucoma specialists using stereo-photographs at baseline, 6, 12, and 24 months in the (A) anti-VEGF group and the (B) control group. P-value: grader 1 differences between baseline and follow-up measurements, paired t-test. P’-value: grader 2 differences between baseline and follow-up measurements, paired t-test. |
VF tests had an average baseline mean deviation (MD) (Figure 6A) in the anti-VEGF group of −2.37±3.72 dB. MD improved at 6 months by 0.72 dB (−1.65±4.06 dB, p=0.052) but returned to baseline levels by 12 months (−2.40±4.42 dB, p=0.93) and worsened by 24 months (−3.01±4.50, p=0.10). The control group showed no significant differences in VF MD at baseline (−3.85±6.38 dB), 6 months (−3.65±5.52 dB, p=0.71), 12 months (−3.76±4.93 dB, p=0.89), and 24 months (−4.22±5.60 dB, p=0.54). Baseline mean BCVAs (Figure 6B) were 0.24±0.19 logMAR in the control group and 0.53±0.35 logMAR in the anti-VEGF group. Visual acuity significantly improved to 0.34±0.17 logMAR at 6 months (p=0.0006) and maintained this improvement, being 0.34±0.22 logMAR at 12 months (p=0.0001) and 0.33±0.15 logMAR at 24 months (p=0.0006). Visual acuity remained consistent in the control group, being 0.24±0.19 logMAR at baseline, 0.25±0.19 logMAR at 6 months (p=0.59), 0.24±0.19 logMAR at 12 months (p=0.69), and 0.25±0.20 logMAR at 24 months (p=0.45). The changes were not statistically significant.
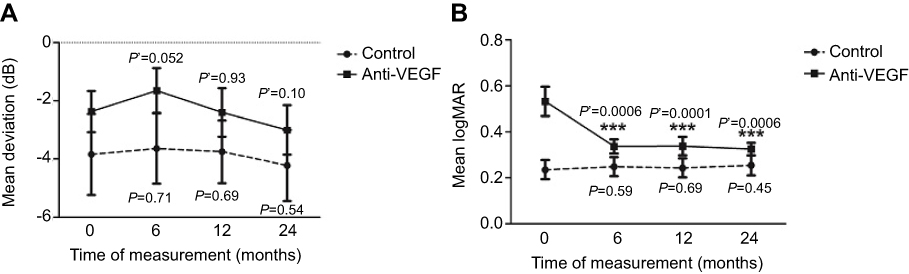 |
Figure 6 Interval changes in mean deviation measured on the (A) Humphrey Visual Field Analyzer and (B) visual acuity at baseline, 6, 12, and 24 months in the control and anti-VEGF groups. p-value: control group differences between baseline and follow-up measurements, paired t-test. p’-value: anti-VEGF group differences between baseline and follow-up measurements, paired t-test. |
In the anti-VEGF group, IOP remained consistent over the 2-year time period (Figure 7). At baseline, it was 16.57±2.89 mmHg and slightly decreased to 16.53±3.33 mmHg at 6 months (p=0.96). At 12 months (p=0.94), it was at 16.60±3.09 mmHg and remained constant by 24 months (16.63±3.09 mmHg, p=0.91). In the control group, IOP remained constant, being 16.67±2.87 mmHg at baseline, 16.52±3.19 mmHg at 6 months (p=0.82), 16.43±2.93 mmHg at 12 months (p=0.63), and 16.52±3.67 mmHg at 24 months (p=0.85). The changes were not statistically significant.
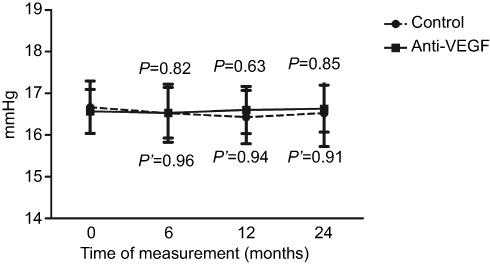 |
Figure 7 Interval changes in intraocular pressure at baseline, 6, 12, and 24 months in the control and anti-VEGF groups. P-value: control group differences between baseline and follow-up measurements, paired t-test. P’-value: anti-VEGF group differences between baseline and follow-up measurements, paired t-test. |
Discussion
The 24-month results from the study demonstrate that during anti-VEGF therapy, the macular thickness significantly decreased by 6 months and, while the patients were undergoing therapy, remained lowered over a 24-month time period. Mean BCVA improved by roughly four lines of vision at 6 months and the improvement was maintained over a 24-month time period. The results were expected and coincide with previously published anti-VEGF landmark studies.37–44 The RESTORE study demonstrated that ranibizumab monotherapy alone, or when combined with a laser treatment, is more effective in improving BCVA than only undergoing the laser treatment and, overall, the health-related quality of life is improved.42 The RISE and RIDE studies have shown that, compared to sham injections, intravitreal injections of ranibizumab (Lucentis) improve BCVA and decrease macular thickness caused by edema.44 The landmark studies have cemented anti-VEGF therapy as the standard of care for DME treatment.
To determine whether anti-VEGF therapy in DME patients results in retinal reperfusion, the amount of ischemia was quantified using the mean perfused ratio. According to the analysis of fluorescein angiography photographs from the RISE and RIDE trials, patients receiving sham injections, as compared to those receiving ranibizumab, had faster progression of retinal nonperfusion.45 The mean perfused ratio was calculated by the concentric rings method which has been previously utilized by Nicholson et al.35 Compared to the standard ischemic index method, wherein the grader draws the ratio of area perfused to the total area graded, the concentric rings method utilizes a set template. The method has a perfect agreement with the ischemic index method, a higher inter-grader agreement, and a shorter grading time.35 Using the concentric rings method, there was a significant increase in perfusion for patients in the anti-VEGF group up until 12 months. The increased level of perfusion remained unchanged when measured at 24 months. The control eyes showed no change in perfusion. These results correlate with those of a past study which examined anti-VEGF reperfusion in DR patients within 5 months of having an injection.46 That study used standard grading of the reperfusion which was quantified using ImageJ software. Roughly 75% of the patients demonstrated reperfusion.46 With a higher sample size, longer time-frame, and a different method of analyzing perfusion, our results verify the previous findings. The results suggest that although diabetes remains a contributing factor, the improvement in the degree of ischemia is most likely a result of the anti-VEGF treatment through the stabilization of blood vessels and other unknown mechanisms.
When analyzing the optic nerve with OCT, the cup volume significantly increased over a 24-month time period in DME patients undergoing anti-VEGF therapy. The vertical C/D ratio also significantly increased by +0.06 over the time period. This is the first study to analyze the effects of anti-VEGF therapy on the optic nerve. No optic nerve edema was present in any of the patients, as visualized by OCT. When assessing participants who received less than ten anti-VEGF injections and patients who received ten or more injections, participants who received ten or more injections showed a significant increase in the vertical C/D ratio by +0.064 over the 24-month time period. Participants who received less than ten injections had a non-significant increase of +0.054 in the vertical C/D ratio. There was no significant difference (p=0.16) in baseline vertical C/D ratios between the two groups despite the fact that participants who had less than ten injections had a mean baseline vertical C/D ratio of 0.33±0.23 and participants who had ten or more injections had a mean baseline vertical C/D ratio of 0.44±0.18.
To eliminate scanning error or results being influenced by the repeatability or reproducibility of the OCT, the vertical C/D ratios were graded by glaucoma specialists using stereo-photographs, which is the current gold standard for analyzing the optic nerve. Two glaucoma specialists, who were masked to the study, were assigned to grade the vertical C/D ratio in the same eyes following anti-VEGF treatment using stereo-photographs. Similar to the OCT results, both grader 1 and 2 indicated that there was a significant vertical C/D ratio increase over 12 months with grader 2 stating a further significant increase at 24 months. Grader 1 indicated there was a +0.02 increase in the vertical C/D ratio whereas, grader 2 indicated there was a +0.07 increase in the vertical C/D ratio over the course of 24 months. Even though there was a discrepancy in the grading method of the optic nerves by the two ophthalmologists, both graders indicated a significant increase in the C/D ratio during anti-VEGF therapy. Discrepancy has been observed in other studies of disc analysis suggesting that a more objective analysis is needed.47,48 To confirm that the observed changes were due to the anti-VEGF therapy and not the graders themselves, the graders also assessed control eyes of diabetic patients not requiring anti-VEGF treatment. Both grader 1 and 2 have found that over 24 months, there was no significant difference in the C/D ratios. The data combined with OCT results suggest that there are morphological changes that happen to the optic nerve in DME patients under anti-VEGF therapy which are not caused by glaucoma.
Overall, in regards to IOP results, there was no significant difference that occurred in patients over a 24-month treatment time frame. Mean IOP at baseline was 16.57 mmHg and 16.63 mmHg at 24 months. Past studies have shown conflicting results on whether or not long-term anti-VEGF usage results in sustained increase in IOP.49,50 In the current study that examined DME patients undergoing ranibizumab treatment for 24 months, no sustained increase in IOP was observed. Functionally, looking at the effects of anti-VEGF therapy on peripheral vision, VF testing showed no significant difference. It is important to note from baseline to 6 months, VFs slightly improved by 0.72 dB but from 6 months to 24 months, peripheral vision declined by −1.36 dB.
This is the first study to analyze long-term structural and functional changes to the retina and optic nerve in DME patients undergoing anti-VEGF therapy. As such, the current study sought to obtain comprehensive results. The analyses of the optic nerve included both structural and functional tests, and grading of stereo-photographs by glaucoma specialists to detect any early changes in the optic nerve in patients starting anti-VEGF treatments.
In conclusion, anti-VEGF therapy appears to affect the optic nerve by increasing cup volume and increasing vertical CD ratio over time, as measured on OCT and through grading of stereo-photographs by glaucoma specialists. Patients who received ten or more injections had a significant increase in the vertical C/D ratios compared to the patients who received less than ten injections. Despite an improvement in peripheral perfusion, there was a slight decline of peripheral VFs from 6–24 months in DME patients undergoing anti-VEGF therapy. The results provide a cautionary note to monitor both the retina and optic nerve status in patients undergoing frequent anti-VEGF injections.
Acknowledgments
We thank the Ivey Eye Institute, Western University – Department of Pathology and Laboratory Medicine, Lawson Health Research Institute, and the Schulich School of Medicine and Dentistry for their support. We would like to thank Dr. Devesh Varma and Dr. Lisa Heckler for grading our photos. We would like to thank Dr. William Hodge for his assistance in statistical analyses. We thank all of the secretaries, staff, and technicians at the Ivey Eye Institute for their assistance and support in this study.
This paper was presented at the ARVO 2017 Annual Meeting (Baltimore, Maryland) - Platform presentation 2017/05/07–2017/05/11. It was selected by the Annual Meeting Program Committee as a “Hot Topic”, representing the newest and most innovative research being conducted in various specialties. This distinction was awarded to just over 2% of all 2017 Annual Meeting abstracts. It was also presented at the 2017 COS Annual Meeting & Exhibition (Montreal, Canada) - Platform presentation 2017/06/15–2017/06/18.
Disclosure
The authors report no conflicts of interest in this work.
References
1. Kaur C, Foulds W, Ling E. Blood-retinal barrier in hypoxic ischaemic conditions: basic concepts, clinical features and management. Progress In Retinal And Eye Research. 2008;27(6):622–647. doi:10.1016/j.preteyeres.2008.09.003
2. Porte D, Sherwin RS, Baron A, Ellenberg M, Rifkin H. Ellenberg & Rifkins Diabetes Mellitus. New York: McGraw-Hill, Medical Pub. Division; 2003.
3. Platania CB, Giurdanella G, Paola LD, et al. P2X7 receptor antagonism: implications in diabetic retinopathy. Biochemical Pharmacology. 2017;138:130–139. doi:10.1016/j.bcp.2017.05.001
4. Holt RIG, Cockram CS, Flyvbjerg A, Goldstein BJ. Textbook of Diabetes.
5. Papadopoulos N, Martin J, Ruan Q, et al. Binding and neutralization of vascular endothelial growth factor (VEGF) and related ligands by VEGF Trap, ranibizumab and bevacizumab. Angiogenesis. 2012;15(2):171–185. doi:10.1007/s10456-011-9249-6
6. Ferrara N, Gerber HP, LeCouter J. The biology of VEGF and its receptors. Nat Med. 2003;9:669–676. doi:10.1038/nm0603-669
7. Diabetes and Your Eyesight. Diabetes and Your Eyesight | glaucoma Research Foundation. 2017. Available from: http://www.glaucoma.org/glaucoma/diabetes-and-your-eyesight.php.
8. Cunningham ET
9. Chun DW, Heier JS, Topping TM, Duker JS, Bankert JM. A pilot study of multiple intravitreal injections of ranibizumab in patients with center-involving clinically significant diabetic macular edema. Ophthalmology. 2006;113:1706–1712.
10. Nguyen QD, Tatlipinar S, Shah SM, Haller JA, Quinlan E, Sung J. Vascular endothelial growth factor is a critical stimulus for diabetic macular edema. American Journal of Ophthalmology. 2006;142(6):961–969. doi:10.1016/j.ajo.2006.06.068
11. Haritoglou C, Kook D, Neubauer A, Wolf A, Priglinger S, Strauss R. Intravitreal bevacizumab (Avastin) therapy for persistent diffuse diabetic macular edema. Retina. 2006;26(9):999–1005. doi:10.1097/01.iae.0000247165.38655.bf
12. Arevalo JF1, Fromow-Guerra J, Quiroz-Mercado H, et al. Primary intravitreal bevacizumab (Avastin) for diabetic macular edema: results from the Pan-American Collaborative Retina Study Group at 6-month follow-up. Ophthalmology. 2007;114(4):743–750. doi:10.1016/j.ophtha.2006.12.028
13. Diabetic Retinopathy Clinical Research Network, Scott IU, Edwards AR, Beck RW, et al. A Phase II randomized clinical trial of intravitreal bevacizumab for diabetic macular edema. Ophthalmology. 2007;114(10):1860–1867. doi:10.1016/j.ophtha.2007.05.062
14. Ahmadieh H, Ramezani A, Shoeibi N, et al. Intravitreal bevacizumab with or without triamcinolone for refractory diabetic macular edema; a placebo-controlled, randomized clinical trial. Graefes Arch Clin Exp Ophthalmol. 2008;246(4):483–489. doi:10.1007/s00417-007-0688-0
15. Kumar A, Sinha S. Intravitreal bevacizumab (Avastin) treatment of diffuse diabetic macular edema in an Indian population. Indian J Ophthalmol. 2007;55:451–455.
16. Gragoudas ES, Adamis AP, Cunningham ET, Feinsod M, Guyer DR. Pegaptamib for neovascular age-related macular degeneration. N Engl J Med. 2004;351:2805–2816. doi:10.1056/NEJMoa042760
17. Rosenfeld PJ, Brown DM, Heier JS, et al. Ranibizumab for neovascular age-related macular degeneration. N Engl J Med. 2006;355(4):1419–1431. doi:10.1056/NEJMoa054481
18. Brown DM, Kaiser PK, Michels M, et al. Ranibizumab versus verteporfin for neovascular age-related macular degeneration. N Engl J Med. 2006;355(14):1432–1444. doi:10.1056/NEJMoa062655
19. Heier JS, Boyer DS, Ciulla TA, et al. Ranibizumab combined with verteporfin photodynamic therapy in neovascular age-related macular degeneration. Arch Ophthalmol. 2006;124(11):1532–1542. doi:10.1001/archopht.124.11.1532
20. Mathalone N, Arodi-Golan A, Sar S, et al. Sustained elevation of intraocular pressure after intravitreal injections of bevacizumab in eyes with neovascular age-related macular degeneration. Graefes Arch Clin Exp Ophthalmol. 2012;250(10):1435–1440. doi:10.1007/s00417-012-1981-0
21. Arikan G, Saatci AO, Oner FH. Immediate intraocular pressure rise after intravitreal injection of ranibizumab and two doses of triamcinolone acetonide. Int J Ophthalmol. 2011;4(4):402. doi:10.3980/j.issn.2222-3959.2011.03.10
22. Good TJ, Kimura AE, Mandava N, Kahook MY. Sustained elevation of intraocular pressure after intravitreal injections of anti-VEGF agents. Br J Ophthalmol. 2011;95(8):1111–1114. doi:10.1136/bjo.2010.180729
23. Tseng J, Vance S, Della Torre K, Mendonca L, Cooney M, Klancnik J. Sustained increased intraocular pressure related to intravitreal antivascular endothelial growth factor therapy for neovascular age-related macular degeneration. J Glaucoma. 2012;21(4):241–247. doi:10.1097/IJG.0b013e31820d7d19
24. Bakri S, Moshfeghi D, Francom S, Rundle A, Reshef D, Lee P. Intraocular pressure in eyes receiving monthly ranibizumab in 2 pivotal age-related macular degeneration clinical trials. Ophthalmology. 2014;121(5):1102–1108. doi:10.1016/j.ophtha.2013.11.029
25. Singh R, Kim J. Ocular hypertension following intravitreal anti-vascular endothelial growth factor agents. Drugs Aging. 2012;29(12):949–956. doi:10.1007/s40266-012-0031-2
26. Fujimoto JG. Optical Coherence Tomography of Ocular Diseases.
27. Mwanza J-C, Oakley JD, Budenz DL, Anderson DR. Ability of cirrus HD-OCT optic nerve head parameters to discriminate normal from glaucomatous eyes. Ophthalmology. 2011;118(2):241–248. doi:10.1016/j.ophtha.2010.06.036
28. Foo -L-L, Perera SA, Cheung CY, et al. Comparison of scanning laser ophthalmoscopy and high-definition optical coherence tomography measurements of optic disc parameters. Br J Ophthalmol. 2012;96(4):576–580. doi:10.1136/bjophthalmol-2011-300835
29. Muqit MMK, Marcellino GR, Henson DB, Fenerty CH, Stanga PE. Randomized clinical trial to evaluate the effects of pascal panretinal photocoagulation on macular nerve fiber layer. Retina. 2011;31(8):1699–1707. doi:10.1097/IAE.0b013e318207d188
30. Meditec CZ. Stratus OCT User’s Manual. Dublin (CA): Carl Zeiss Meditec; 2003.
31. Vizzeri G, Balasubramanian M, Bowd C, Weinreb RN, Medeiros FA, Zangwill LM. Spectral domain-optical coherence tomography to detect localized retinal nerve fiber layer defects in glaucomatous eyes. Opt Express. 2009;17(5):4004. doi:10.1364/OE.17.004004
32. Kummet CM, Zamba KD, Doyle CK, Johnson CA, Wall M. Refinement of pointwise linear regression criteria for determining glaucoma progression. Invest Ophthalmol Vis Sci. 2013;54(9):6234. doi:10.1167/iovs.13-11680
33. Alencar LM, Bowd C, Weinreb RN, Zangwill LM, Sample PA, Medeiros FA. Comparison of HRT-3 glaucoma probability score and subjective stereophotograph assessment for prediction of progression in glaucoma. Invest Ophthalmol Vis Sci. 2008;49(5):1898. doi:10.1167/iovs.07-0624
34. Wessel MM, Aaker GD, Parlitsis G, Cho M, Dʼamico DJ, Kiss S. Ultra–wide-field angiography improves the detection and classification of diabetic retinopathy. Retina. 2012;32(4):785–791. doi:10.1097/IAE.0b013e3182278b64
35. Nicholson L, Vazquez-Alfageme C, Ramu J, et al. Validation of concentric rings method as a topographic measure of retinal nonperfusion in ultra-widefield fluorescein angiography. Am J Ophthalmol. 2015;160(6):1217–1225. doi:10.1016/j.ajo.2015.09.003
36. Blodi BA, Domalpally A, Scott IU, et al. Standard Care vs Corticosteroid for Retinal Vein Occlusion (SCORE) Study system for evaluation of stereoscopic color fundus photographs and fluorescein angiograms: SCORE Study Report 9. Arch Ophthalmol. 2010;128(9):1140–1145. doi:10.1001/archophthalmol.2010.193
37. Nguyen QD, Shah SM, Heier JS, et al. Primary end point (six months) results of the ranibizumab for edema of the macula in diabetes (READ-2) study. Ophthalmology. 2009;116(11):2175–2181.e1. doi:10.1016/j.ophtha.2009.04.023
38. Nguyen QD, Shah SM, Khwaja AA, et al. Two-year outcomes of the ranibizumab for edema of the macula in diabetes (READ-2) study. Ophthalmology. 2010;117(11):2146–2151. doi:10.1016/j.ophtha.2010.08.016
39. Do DV, Nguyen QD, Khwaja AA, et al. Ranibizumab for edema of the macula in diabetes study. JAMA Ophthalmol. 2013;131(2):139–145. doi:10.1001/2013.jamaophthalmol.91
40. Do DV, Sepah YJ, Boyer D, et al. Month-6 primary outcomes of the READ-3 study (Ranibizumab for Edema of the mAcula in Diabetes—Protocol 3 with high dose). Eye (Lond). 2015;29(12):1538–1544. doi:10.1038/eye.2015.142
41. Massin P, Bandello F, Garweg JG, et al. Safety and efficacy of ranibizumab in diabetic macular edema (RESOLVE Study): a 12-month, randomized, controlled, double-masked, multicenter phase II study. Diabetes Care. 2010;33(11):2399–2405. doi:10.2337/dc10-0493
42. Mitchell P, Bandello F, Schmidt-Erfurth U, et al. The RESTORE study: ranibizumab monotherapy or combined with laser versus laser monotherapy for diabetic macular edema. Ophthalmology. 2011;118(4):615–625. doi:10.1016/j.ophtha.2011.01.031
43. Ishibashi T, Li X, Koh A, et al. The REVEAL Study: ranibizumab monotherapy or combined with laser versus laser monotherapy in Asian patients with diabetic macular edema. Ophthalmology. 2015;122(7):1402–1415. doi:10.1016/j.ophtha.2015.02.006
44. Brown DM, Nguyen QD, Marcus DM, et al. Long-term outcomes of ranibizumab therapy for diabetic macular edema: the 36-month results from two Phase III trials. Ophthalmology. 2013;120(10):2013–2022. doi:10.1016/j.ophtha.2013.02.034
45. Campochiaro PA, Wykoff CC, Shapiro H, Rubio RG, Ehrlich JS. Neutralization of vascular endothelial growth factor slows progression of retinal nonperfusion in patients with diabetic macular edema. Ophthalmology. 2014;121(9):1783–1789. doi:10.1016/j.ophtha.2014.03.021
46. Levin A, Rusu I, Orlin A, et al. Retinal reperfusion in diabetic retinopathy following treatment with anti-VEGF intravitreal injections. Clin Ophthalmol. 2017;11:193–200. doi:10.2147/OPTH.S118807
47. Lim MC. Effect of diabetic retinopathy and panretinal photocoagulation on retinal nerve fiber layer and optic nerve appearance. Arch Ophthalmol. 2009;127(7):857–862. doi:10.1001/archophthalmol.2009.135
48. Chauhan BC, Burgoyne CF. From clinical examination of the optic disc to clinical assessment of the optic nerve head: a paradigm change. Am J Ophthalmol. 2013;156(2):218–227. doi:10.1016/j.ajo.2013.04.016
49. Hariprasad S, Nariani A, Williams B. Long-term effect of anti-vascular endothelial growth factor injections on intraocular pressure. Indian J Ophthalmol. 2016;64(9):643. doi:10.4103/0301-4738.194329
50. Baek SU, Park IW, Suh W. Long-term intraocular pressure changes after intravitreal injection of bevacizumab. Cutan Ocul Toxicol. 2016;35(4):310–314. doi:10.3109/15569527.2015.1124886
 © 2019 The Author(s). This work is published and licensed by Dove Medical Press Limited. The
full terms of this license are available at https://www.dovepress.com/terms
and incorporate the Creative Commons Attribution
- Non Commercial (unported, 3.0) License.
By accessing the work you hereby accept the Terms. Non-commercial uses of the work are permitted
without any further permission from Dove Medical Press Limited, provided the work is properly
attributed. For permission for commercial use of this work, please see paragraphs 4.2 and 5 of our Terms.
© 2019 The Author(s). This work is published and licensed by Dove Medical Press Limited. The
full terms of this license are available at https://www.dovepress.com/terms
and incorporate the Creative Commons Attribution
- Non Commercial (unported, 3.0) License.
By accessing the work you hereby accept the Terms. Non-commercial uses of the work are permitted
without any further permission from Dove Medical Press Limited, provided the work is properly
attributed. For permission for commercial use of this work, please see paragraphs 4.2 and 5 of our Terms.