Back to Journals » Patient Preference and Adherence » Volume 10
Twenty-four-week effects of liraglutide on body composition, adherence to appetite, and lipid profile in overweight and obese patients with type 2 diabetes mellitus
Authors Rondanelli M, Perna S, Astrone P, Grugnetti A, Solerte SB, Guido D
Received 29 September 2015
Accepted for publication 19 January 2016
Published 24 March 2016 Volume 2016:10 Pages 407—413
DOI https://doi.org/10.2147/PPA.S97383
Checked for plagiarism Yes
Review by Single anonymous peer review
Peer reviewer comments 2
Editor who approved publication: Dr Johnny Chen
Mariangela Rondanelli,1 Simone Perna,1 Paolo Astrone,2 Annalisa Grugnetti,2 Sebastiano Bruno Solerte,2 Davide Guido3,4
1Endocrinology and Nutrition Unit, Section of Human Nutrition, Department of Public Health, Experimental and Forensic Medicine, Agency for Elderly People Services, Santa Margherita Hospital, University of Pavia, Pavia, Italy; 2Section of Geriatrics and Gerontology, Department of Internal Medicine, Agency for Elderly People Services, Santa Margherita Hospital, University of Pavia, Pavia, Italy; 3Medical and Genomics Statistics Unit, Department of Brain and Behavioral Sciences, University of Pavia, Pavia, Italy; 4Biostatistics and Clinical Epidemiology Unit, Department of Public Health, Experimental and Forensic Medicine, University of Pavia, Pavia, Italy
Background: Liraglutide has well-known effects on glucose patterns. However, its several other metabolic properties are still controversial. Given this background, the aims of the present study are to evaluate the effects of 24-week liraglutide treatment on body composition, appetite, and lipid profile in overweight and obese type 2 diabetes mellitus (T2DM) patients.
Methods: A cohort study was carried out on overweight and obese T2DM patients with glycosylated hemoglobin A1c equal to 6% (42 mmol/mol)-10% (86 mmol/mol), under a 3-month treatment (at least) with maximal dose of metformin as stable regime, by adding liraglutide at doses up to 3 mg/d. Body composition markers were measured by dual-energy X-ray densitometry at baseline and after 24 weeks of liraglutide treatment. Glucose control was monitored by glucose, glycosylated hemoglobin A1c, insulin, and homeostasis model assessment. Finally, the appetite sensation and plasma lipids were also evaluated.
Results: Twenty-eight subjects (male/female: 16/12, mean age: 58.75±9.33 years, body mass index: 34.13±5.46 kg/m2) were evaluated. Accounting for the adjustment for age, sex, and duration of diabetes, we noted significant decreases in body mass index (-0.86 kg/m2, P=0.024), fat mass (-2.01 kg, P=0.015), fat mass index (-0.71 kg/m2, P=0.014), android fat (-1.72%, P=0.022), trunk fat (-1.52%, P=0.016), and waist circumference (-6.86 cm, P<0.001) from the baseline values. Haber score was increased by 3.82 units (P=0.009), and the number of metabolic syndrome risk factors was decreased (-0.69 units, P=0.012). The glucose control variables and total cholesterol/high-density lipoprotein cholesterol ratio also showed significant decreases from baseline values.
Conclusion: The 24-week liraglutide treatment leads to the reduction of fat mass, android fat, trunk fat, and appetite by improving the lipid profile, glucose control, and insulin sensitivity.
Keywords: liraglutide, weight loss, body composition, fat mass, type 2 diabetes mellitus, appetite
Background
The World Health Organization estimated that 2.3 billion adults would be overweight and that more than 700 million would be obese by 2015; this is largely due to dietary and other lifestyle factors.1 The incidence of type 2 diabetes mellitus (T2DM) and insulin resistance (IR) are associated with obesity. In particular, T2DM is closely linked to “android obesity”, characterized by abdominal visceral fat accumulation.2,3 In addition, morbid obesity, dyslipidemia, and hypertension place T2DM patients at strong risk of cardiovascular (CVD) disease, related to morbidity and mortality.4
In this sense, it is necessary to develop an effective and efficient therapeutic target strategy for both T2DM and obesity. Liraglutide, a glucagon-like peptide-1 (GLP-1) analog, is a member of the new classes of antidiabetic agents, and it is characterized by its ability to induce insulin secretion only during hyperglycemia (as an incretin effect).5
Liraglutide has the ability to decrease blood glucose without causing hypoglycemia, and, at the same time, it has several other metabolic properties: 1) promoting and maintaining a substantial weight loss;6–8 2) deceleration of the gastric emptying; and 3) inducing satiety, decreasing energy intake.9,10
Niswender et al11 investigated the weight change in subjects with T2DM treated with liraglutide compared to those treated with other diabetes therapies. They showed that the weight loss was greater in subjects treated with GLP-1 receptor than those in the active comparator-treated group.
However, the various metabolic activities of liraglutide in addition to glycemic control are still controversial. In particular, few studies evaluated the body composition changes associated with weight loss in liraglutide-treated subjects, by correlating with appetite sensation and other metabolic alterations.
Given this background, the primary aim of this study was to assess the effect of the 24-week liraglutide treatment, at doses up to 3 mg/d, on body composition in overweight and obese individuals with T2DM. Liraglutide treatment effects on appetite sensation, lipid profile, and IR were also investigated as secondary objectives.
Methods
Study participants
The cohort study was performed following the approval of the Ethics Committee of the Department of Internal Medicine and Medical Therapy of the University of Pavia. Written informed consent was obtained from all patients for participation in the study.
We evaluated white male and female subjects with T2DM admitted to the outpatient setting of the Agency for Elderly People Services, Santa Margherita Hospital in Pavia, between September 2012 and June 2014.
The inclusion criteria were: 1) overweight or obese subjects (body mass index [BMI] ≥25 kg/m2); 2) glycosylated hemoglobin A1c (HbA1c) =6% (42 mmol/mol)−10% (86 mmol/mol); 3) metformin treatment at maximal dose and stable regime since 3 months (at least); 4) liraglutide treatment initiated at 1.2 mg once daily, titrated to 3 mg once daily after 1 week; 5) duration of diabetes between 1 and 19 years; and 6) subjects ≥18 years of age.
Body composition, nutritional status and food intake
Body composition was measured by dual-energy X-ray densitometry (DXA) using a Lunar Prodigy DXA (GE Medical Systems, Waukesha, WI, USA). The in vivo coefficients of variation were 0.89% and 0.48% for fat and muscle mass, respectively. Fat mass and muscle mass were evaluated by whole body scan. Fat mass index (FMI) was derived as fat mass (kg) divided by the square of the height (m2), and free fat mass index (FFMI) as free fat mass (kg) divided by the square of the height (m2). The relative skeletal muscle mass was derived as the sum of fat-free soft tissue mass of arms and legs, as described by Janssen et al.12
Body weight was measured to the nearest 0.1 kg by using a precision scale, with the subjects wearing light clothing and without shoes, using standardized technique.13
BMI and waist circumference were also calculated.
Patients ate five meals daily: breakfast between 7 and 8 am, a snack between 10 and 10.30 am, lunch between 12 am and 2 pm, a snack between 4 and 4.30 pm, and dinner between 7 and 8 pm. Individual diet plans were drawn up for each subject by the research dietitian. The energy content and macronutrient composition of the diets adhered to the nutritional recommendations of the American Diabetes Association.14,15
To optimize compliance, dietary instructions were reinforced weekly by the same research dietitian. Each consultation included a nutritional assessment and weighing. A 3-day weighed-food record of 2 weekdays and 1 weekend day was prepared before the study and during the last week of intervention. Individual diet plans and dietary records were analyzed using a food-nutrient database (Rational Diet, Milan, Italy).
Rating of appetite
Visual analog scales were used to assess appetite sensations. Satiety was numerically assessed using a scoring system graded from −10, to represent extreme hunger, to +10, to represent extreme satiety. The scale with 21 graduations, characterized by items that describe the various degrees of hunger or satiety, was shown to all subjects. They were free to choose any point along the scale in relation to their hunger or satiety sensations. The point chosen was defined as the Haber score.16
Biochemical analyses
Blood samples were obtained from subjects in the fasted state before and after 6-month liraglutide treatment. The blood samples were taken, immediately cooled and centrifuged at 4°C, and then stored at −80°C until analysis.
HbA1c was analyzed using a high-performance liquid chromatography, ion-exchange chromatography assay (HLC-723G7, TOSOH, Tokyo, Japan). Serum concentrations of insulin and C-peptide were analyzed by enzyme-linked immunosorbent assay methods. Serum glucose, lipid profiles, and liver biochemistry were determined by using the Hitachi 7070 automatic biochemical analyzer (Hitachi Ltd, Tokyo, Japan).
A1c-derived average glucose (ADAG) was calculated.17 IR was evaluated by the homeostasis model assessment (HOMA),18 using the following formula: HOMA-IR = ([fasting insulin, μU/mL] × [plasma glucose, mmol/L])/22.5.
Definition of metabolic syndrome
The metabolic syndrome (MetS) was identified based on The National Cholesterol Education Program’s Adult Treatment Panel III report (ATP III).19
Statistical analysis
Data were expressed as mean ± standard deviation. Linear mixed models (LMM) for repeated measures20 were applied in order to assess the differences in blood, body composition and appetite sensation variables, among individuals at pre- and post-treatment (post – pre). These data were presented as mean differences with 95% confidence intervals. Nonnormally distributed data were checked by Shapiro–Wilk test and log-transformed for parametric statistics. Therefore, for each outcome, we fit an LMM where age, sex, duration of diabetes, and time (pre =0, post =1) were the explanatory variables. A random effect was used to adjust the models for intrasubject variability products by two different measurements carried out on the same patients (n=28, ×2=56 observations, but only 28 independents). The time LMM parameters were interpreted as adjusted mean changes (Δ-changes) from baseline (t0). We carried out two-tailed t-tests (and 95% confidence interval) to evaluate statistical significance on model parameters. P-values <0.05 were considered significant. Thus, a Pearson correlation analysis was used to assess the pairwise relationships among the Δ-changes in body composition markers, and with Δ-changes in glucose control variables, lipid profile, and Haber score. The analysis was performed on R 2.15.3 using the R/nlme21 and R/stats packages (R Foundation for Statistical Computing, Vienna, Austria).22
Results
Table 1 lists the baseline characteristics of the 28 subjects (male: 16, female: 12) at admission. The mean age was 58.75±9.33 years, the mean BMI was 34.13±5.46 kg/m2, while the mean of the FMI and FFMI were 13.01±4.14 and 20.01±2.51 kg/m2, respectively. Considering the lipid profile, the mean triglycerides was 1.93±1.06 mmol/L and the mean total cholesterol was 5.23±1.14 mmol/L. The average values of android to gynoid fat ratio (1.23±0.25 units), glycated hemoglobin (HbA1c =8.2% [66 mmol/mol] ±1.5%), and ADAG (10.57±2.40 mmol/L) indicated that the enrolled subjects had severe abdominal obesity and poor glycemic control. The baseline prevalence of MetS was 89.3%.
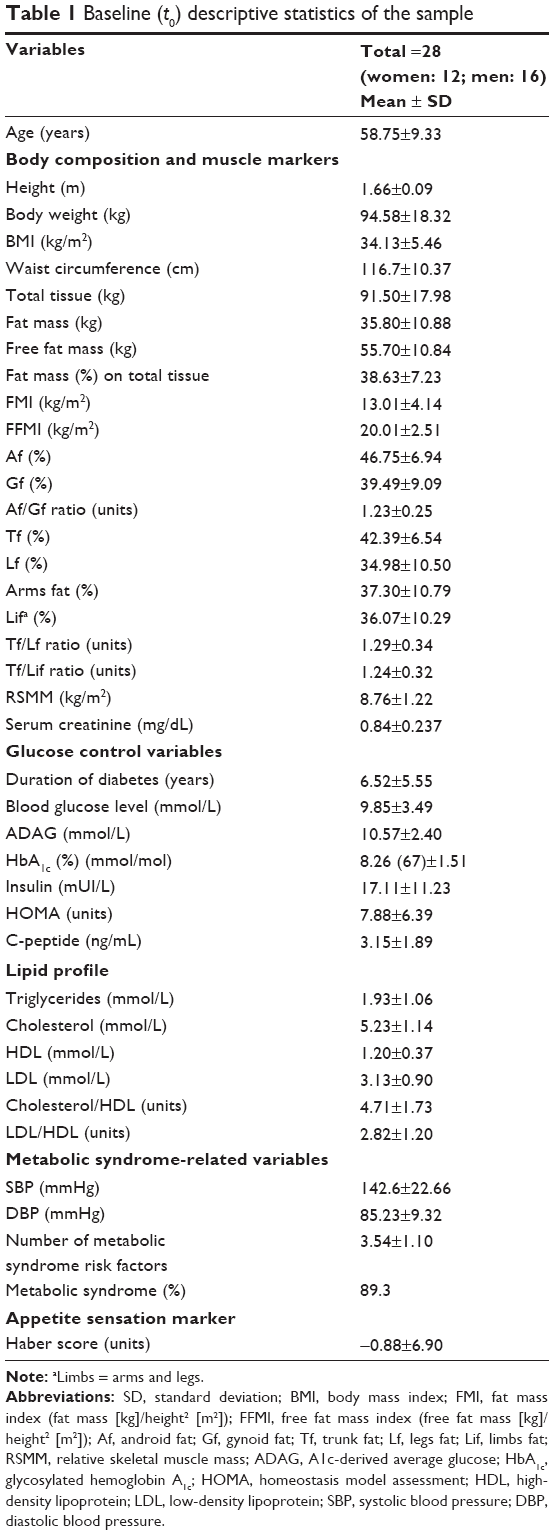 | Table 1 Baseline (t0) descriptive statistics of the sample |
Table 2 lists, for all the outcomes, mean changes from baseline values, by LMM analysis, adjusting for age, sex, and duration of diabetes. There were significant reductions from baseline. Concerning the changes of body composition markers, significant decreases were found in body weight (−2.45 kg, P=0.026), BMI (−0.86 kg/m2, P=0.024), and total tissue (−2.40 kg, P=0.028). Fat mass and FMI were significantly reduced by 2.01 kg (P=0.015) and 0.71 kg/m2 (P=0.014) from baseline. Free fat mass and FFMI were also decreased by 0.39 kg and 0.13 kg/m2, but these were not significant (P=0.403 and P=0.407). Average percentage of fat mass on tissue was decreased by 1.45% (P=0.009). In addition, android fat, trunk fat, and waist circumference decreased by 1.72% (P=0.022), 1.52% (P=0.016), and 6.86 cm (P<0.001), respectively.
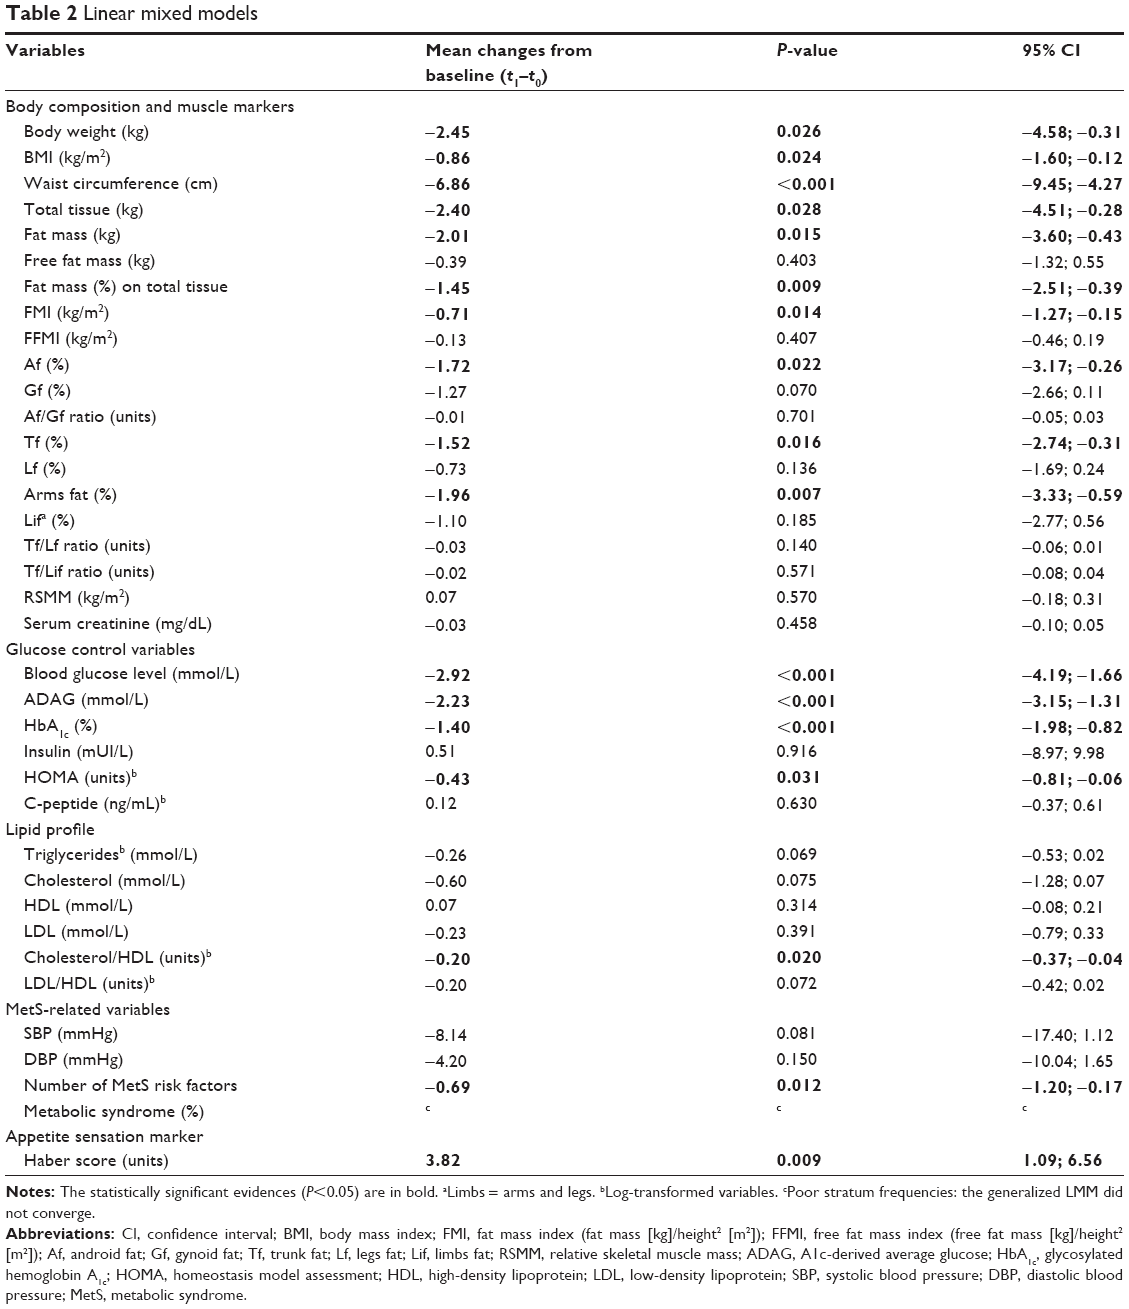 | Table 2 Linear mixed models |
Contextually, Haber score was increased by 3.82 units (P=0.009) and the number of MetS risk factors was averagely decreased (−0.69 unit, P=0.012). Also glucose control variables, such as blood glucose level (mmol/L), ADAG (mmol/L), HbA1c (%), and log-HOMA (log[units]), showed significant decreases from baseline values, by 2.92 mmol/L (P<0.001), 2.23 mmol/L (P<0.001), 1.40% (P<0.001), and 0.43 log(units) (P=0.031), respectively.
Finally, concerning biochemical markers, total cholesterol- high-density lipoprotein cholesterol ratio (log) showed a significant decrease (−0.20 log[units], P=0.020). In addition, cholesterol (−0.60 mmol/L, P=0.075), triglycerides (−0.26 log[mmol/L], P=0.069), and low-density lipoprotein (LDL)–high-density lipoprotein (HDL) ratio (−0.20 log[units], P=0.072) showed suggestive but not significant evidences (0.05<P<0.10) of negative variations.
Regarding Pearson correlation analysis of the Δ-changes (t1–t0) in body composition and muscle markers, except waist circumference, a number of indicators were significantly correlated (the Pearson correlation equal to 0.37 is the cutoff that returns a P=0.05 from a two-sided test with sample size of the current study, n=28). It is to be noted that the correlations between FMI and total mass and tissue markers, ie, BMI (0.90, P<0.001) and total tissue (0.90, P<0.001) are higher than analog correlations with FFMI (0.70, P<0.001 in both cases). In particular, total tissue changes were significantly correlated with gynoid fat (0.71, P<0.001), leg fat (0.54, P=0.003), android fat (0.49, P=0.009), and trunk fat (0.48, P=0.009).
Finally, concerning the correlations with the Δ changes of the glucose control variables, lipid profile, and Haber score, the latter showed a significant and inverse correlations with gynoid fat (−0.42, P=0.026) and leg fat (−0.45, P=0.016), while HbA1c showed a positive correlation with waist circumference (0.42, P=0.026) and negative correlations with android fat (−0.39, P=0.039) and android/gynoid fat ratio (−0.42, P=0.026).
Discussion
This study shows that the treatment with liraglutide (3 mg) over 24 weeks helps patients obtain good glycemic control (HbA1c =−1.40%, ADAG =−2.23 mmol/L, HOMA =−0.43 log[units]) and leads to a mean weight loss of 2.45 kg, specifically in fat mass (−2.01 kg and −0.71 kg/m2), android fat (−1.72%) and trunk fat (−1.52%), in Italian overweight and obese T2DM patients. Another interesting finding is related to the variation of the lipid profile, with the significant decrease of total cholesterol-HDL cholesterol ratio (−0.20 log[units]). Notably, changes in plasma levels of total cholesterol (−0.60 mmol/L) and triglycerides (−0.26 log[mmol/L]) were almost significant (0.05<P<0.10).
After 24 weeks of liraglutide therapy, a significant decrease of 1.40% in HbA1c from baseline was detected. This is a good result when compared with other studies where the HbA1c reductions were 0.8%, 0.33%, and 0.77%, respectively.23–25 Considering that in our study the patients had medium–high baseline HbA1c, the decrease obtained is important for the metabolic control of the disease. This result was partially expected, because liraglutide, a GLP-1 analog, is a member of the newest class of T2DM therapies currently available, which improves hyperglycemia by increasing insulin secretion and reducing glucagon secretion.26
The most important result of this study is the confirmation that the weight loss caused by liraglutide is primarily originated from reduction in fat mass rather than lean tissue mass. As a matter of fact, in our study, we found a significant decrease in fat mass and fat mass index (2.01 kg and 0.71 kg/m2, respectively), android fat (1.72%), and trunk fat (1.52%). Furthermore, we might hypothesize that the reduction of abdominal visceral fat tissues is greater than that of subcutaneous fat tissues, as already demonstrated by Jendle et al,27 Inoue et al,28 Nauck et al,29 and Li et al.30
Previous studies have shown that liraglutide treatment produced sustained improvements in glycemic control, with a concomitant sustained weight loss.25,29,31–33 Nowadays, only few studies have evaluated the body composition by dual-energy X-ray absorptiometry,27–30 as was done in our study. Hence, it is interesting to go beyond the assessment of weight and studying the body composition (fat mass, muscle mass, and distribution of fat mass) of these patients, also considering the risk of CVD and its correlation with android fat. Therefore, liraglutide might be a promising new agent for the treatment of T2DM and abdominal obesity linked to high risk of CVD.
It is important to note that the weight loss and changes in body composition obtained in this study were not consciously wanted by patients, who did not also follow a low-calorie diet. Customized nutritional advice, but not a low-calorie diet, was given to the patients. Furthermore, the subjects were all sedentary and did not change their lifestyle during the research. Finally, it is necessary to consider the ethnic background. Our study confirms the major results in terms of weight loss and adiposity performed on Asian subjects.30
Thus, the unplanned weight loss achieved during the study has been probably due to the decrease of appetite sensation, as already demonstrated in previous studies:32,34,35 Haber score is significantly increased by 3.82 units. However, the mechanism involved in the action of GLP-1 in controlling appetite and body weight is still unknown.36
Moreover, GLP-1 induces deceleration of gastric emptying and its anorexic actions appear to be mediated by the direct activation of the GLP-1 receptor in the central nervous system. GLP-1 also promotes the activation of the vagal nerve.37,38
Concerning the interpretation of the lipid profile data, the beneficial effects of liraglutide treatment were also demonstrated in lipid metabolism disorders.32,39–41 In accordance with those previous studies, we observed that the treatment with liraglutide significantly improved CVD risk factors, including total cholesterol/HDL cholesterol ratio, but not triglycerides and LDL cholesterol.
Other studies found that LDL cholesterol level was significantly reduced at 6 and 12 months, while HDL cholesterol tended to increase.42 For these reasons, the treatment effect of liraglutide on the lipid profile should be further studied in depth.
Furthermore, in our study, we demonstrated that the number of factors identified by ATP III MetS significantly decreased.
Finally, another important key factor is the mean age of the subjects. In this regard, our study had a sample with age (58.75±9.33 years) greater than the age of sample subjects in other previous studies.
Overall, liraglutide was well tolerated and no safety concerns were identified. Occasionally, gastrointestinal disorders (nausea mainly) of mild severity were reported in two patients.
Concerning the limitations of the study, what can be the potential confounders of this study? It is possible that liraglutide is more effective in obese than in overweight or normal subjects, and in men compared to women. Accounting for this, we did not carry out a stratified analysis, but we just included adjustment covariates as sex, age and duration of diabetes.
Conclusion
In conclusion, 24-week treatment with 3 mg liraglutide is safe, well tolerated, and facilitates fat mass loss. In particular, it decreases the android and trunk fat and it improves lipid profile and glucose control in patients with T2DM. Our data support the rationale of other studies that investigated GLP-1 analogs in overweight and obesity patients having T2DM and dyslipidemia.
Disclosure
The authors report no conflicts of interest in this work.
References
Chilton R, Wyatt J, Nandish S, Oliveros R, Lujan M. Cardiovascular comorbidities of type 2 diabetes mellitus: defining the potential of glucagons-like peptide-1-based therapies. Am J Med. 2011;124:S35–S53. | ||
Frühbeck G. Overview of adipose tissue and its role in obesity and metabolic disorders. Methods Mol Biol. 2008;456:1–22. | ||
Hansen E, Jajri T, Abdumrad NN. Is all fat the same? The role of fat in the pathogenesis of the metabolic syndrome and type 2 diabetes mellitus. Surgery. 2006;139:711–716. | ||
Lorber D. GLP-1 receptor agonists: effects on cardiovascular risk reduction. Cardiovasc Ther. 2013;31:238–249. | ||
Blonde L, Russell-Jones D. The safety and efficacy of liraglutide with or without oral antidiabetic drug therapy in type 2 diabetes: an overview of the LEAD 1–5 studies. Diabetes Obes Metab. 2009;3:26–34. | ||
Han TS, Wu FC, Lean ME. Obesity and weight management in the elderly: a focus on men. Best Pract Res Clin Endocrinol Metab. 2013;27:509–525. | ||
Kaur P, Mishra SK, Mithal A, Saxena M, Makkar A, Sharma P. Clinical experience with liraglutide in 196 patients with type 2 diabetes from a tertiary care center in India. Indian J Endocrinol Metab. 2014;18:77–82. | ||
Astrup A, Rössner S, Van Gaal L, et al. Effects of liraglutide in the treatment of obesity: a randomised, double-blind, placebo-controlled study. Lancet. 2009;374:1606–1616. | ||
Flint A, Raben A, Astrup A, Holst JJ. Glucagon-like peptide 1 promotes satiety and suppresses energy intake in humans. J Clin Invest. 1998;101:515–520. | ||
Verdich C, Flint A, Gutzwiller JP, et al. A meta-analysis of the effect of glucagon-like peptide-1 (7–36) amide on ad libitum energy intake in humans. J Clin Endocrinol Metab. 2001;86:4382–4389. | ||
Niswender K, Pi-Sunyer X, Buse J, et al. Weight change with liraglutide and comparator therapies: an analysis of seven phase 3 trials from the liraglutide diabetes development programme. Diabetes Obes Metab. 2013;15:42–54. | ||
Janssen I, Baumgartner RN, Ross R, Rosenberg IH, Roubenoff R. Skeletal muscle cutpoints associated with elevated physical disability risk in older men and women. Am J Epidemiol. 2004;159:413–421. | ||
Frisancho AR. New standards of weight and body composition by frame size and height for assessment of nutritional status of adults and the elderly. Am J Clin Nutr. 1984;40:808–819. | ||
American Diabetes Association, Bantle JP, Wylie-Rosett J, Albright AL, et al. Nutrition recommendations and interventions for diabetes: a position statement of the American Diabetes Association. Diabetes Care. 2008;31:S61–S78. | ||
Davis NJ, Emerenini A, Wylie-Rosett J. Obesity management: physician practice patterns and patient preference. Diabetes Educ. 2006;32:557–561. | ||
Haber GB, Heaton KW, Murphy D, Burroughs LF. Depletion and disruption of dietary fibre. Effects on satiety, plasma-glucose, and serum-insulin. Lancet. 1977;2:679–682. | ||
Nathan DM, Kuenen J, Borg R, Zheng H, Schoenfeld D, Heine RJ; A1c-Derived Average Glucose Study Group. Translating the A1C assay into estimated average glucose values. Translating the A1C assay into estimated average glucose values. Diabetes Care. 2008;31:1473–1478. | ||
Haffner SM, Kennedy E, Gonzalez C, Stern MP, Miettinen H. A prospective analysis of the HOMA model. The Mexico City Diabetes Study. Diabetes Care. 1996;19:1138–1141. | ||
National Cholesterol Education Program (NCEP) Expert Panel on Detection, Evaluation, and Treatment of High Blood Cholesterol in Adults (Adult Treatment Panel III). Third report of the National Cholesterol Education Program (NCEP) Expert Panel on Detection, Evaluation, and Treatment of High Blood Cholesterol in Adults (Adult Treatment Panel III): final report. Circulation. 2002;106:3143–3421. | ||
Fitzmaurice GM, Laird NM, Ware JH. Applied Longitudinal Analysis. Hoboken, NJ: Wiley-Interscience; 2004. | ||
Pinheiro J, Bates D, DebRoy S, Sarkar D; R Development Core Team. nlme: Linear and Nonlinear Mixed Effects Models. R package version 3; 2013:1–108. | ||
Development Core Team. R: A Language and Environment for Statistical Computing. Vienna, Austria: R Foundation for Statistical Computing; 2012. | ||
Chang AM, Jakobsen G, Sturis J, et al. The GLP-1 derivative NN2211 restores beta-cell sensitivity to glucose in type 2 diabetic patients after a single dose. Diabetes. 2003;52:1786–1791. | ||
Harder H, Nielsen L, Tu DT, Astrup A. The effect of liraglutide, a longacting glucagon-like peptide 1 derivative, on glycaemic control, body composition, and 24-h energy expenditure in patients with type 2 diabetes. Diabetes Care. 2004;27:1915–1921. | ||
De Wit HM, Vervoort GM, Jansen HJ, de Grauw WJ, de Galan BE, Tack CJ. Liraglutide reverses pronounced insulin-associated weight gain, improves glycaemic control and decreases insulin dose in patients with type 2 diabetes: a 26 week, randomised clinical trial (ELEGANT). Diabetologia. 2014;57:1812–1819. | ||
Flint A, Kapitza C, Hindsberger C, Zdravkovic M. The once-daily human glucagon-like peptide-1 (GLP-1) analog liraglutide improves postprandial glucose levels in type 2 diabetes patients. Adv Ther. 2011;28:213–226. | ||
Jendle J, Nauck MA, Matthews DR, et al. Weight loss with liraglutide, a once-daily human glucagon-like peptide-1 analogue for type 2 diabetes treatment as monotherapy or added to metformin, is primarily as a result of a reduction in fat tissue. Diabetes Obes Metab. 2009;11:1163–1172. | ||
Inoue K, Maeda N, Kashine S, et al. Short-term effects of liraglutide on visceral fat adiposity, appetite, and food preference: a pilot study of obese Japanese patients with type 2 diabetes. Cardiovasc Diabetol. 2011;10:109. | ||
Nauck M, Frid A, Hermansen K, et al. Efficacy and safety comparison of liraglutide, glimepiride, and placebo, all in combination with metformin, in type 2 diabetes: the LEAD (liraglutide effect and action in diabetes)-2 study. Diabetes Care. 2009;32:84–90. | ||
Li CJ, Yu Q, Yu P, et al. Changes in liraglutide-induced body composition are related to modifications in plasma cardiac natriuretic peptides levels in obese type 2 diabetic patients. Cardiovasc Diabetol. 2014;13:36. | ||
Garber A, Henry R, Ratner R, et al. Liraglutide versus glimepiride monotherapy for type 2 diabetes (LEAD-3 mono): a randomised, 52-week, phase III, double-blind, parallel-treatment trial. Lancet. 2009;373:473–481. | ||
Fujishima Y, Maeda N, Inoue K, et al. Efficacy of liraglutide, a glucagon-like peptide-1 (GLP-1) analogue, on body weight, eating behavior, and glycemic control, in Japanese obese type 2 diabetes. Cardiovasc Diabetol. 2012;11:107. | ||
Kuhadiya ND, Malik R, Bellini NJ, et al. Liraglutide as additional treatment to insulin in obese patients with type 1 diabetes mellitus. Endocr Pract. 2013;19:963–967. | ||
Flint A, Kapitza C, Zdravkovic M. The once-daily human GLP-1 analogue liraglutide impacts appetite and energy intake in patients with type 2 diabetes after short-term treatment. Diabetes Obes Metab. 2013;15:958–962. | ||
Horowitz M, Flint A, Jones KL, et al. Effect of the once-daily human GLP-1 analogue liraglutide on appetite, energy intake, energy expenditure and gastric emptying in type 2 diabetes. Diabetes Res Clin Pract. 2012;97:258–266. | ||
Rodriquez de Fonseca F, Navarro M, Alvarez E, et al. Peripheral versus central effects of glucagon-like peptide-1 receptor agonists on satiety and body weight loss in Zucker obese rats. Metabolism. 2000;49:709–717. | ||
Van Bloemendaal L, Ten Kulve JS, la Fleur SE, Ijzerman RG, Diamant M. Effects of glucagon-like peptide 1 on appetite and body weight: focus on the CNS. J Endocrinol. 2014;221:T1–T16. | ||
Abbott CR, Monteiro M, Small CJ, et al. The inhibitory effects of peripheral administration of peptide YY(3-36) and glucagon-like peptide-1 on food intake are attenuated by ablation of the vagal-brainstem-hypothalamic pathway. Brain Res. 2005;1044:127–131. | ||
Piotrowski K, Becker M, Zugwurst J, et al. Circulating concentrations of GLP-1 are associated with coronary atherosclerosis in humans. Cardiovasc Diabetol. 2013;12:117. | ||
Plutzky J, Garber AJ, Falahati A, Toft AD, Poulter NR. The once-daily human GLP-1 analogue, liraglutide, significantly reduces markers of cardiovascular risk in type 2 diabetes: a meta-analysis of six clinical trials. Eur Heart. 2009;30:917. | ||
Ponzani P. Long-term effectiveness and safety of liraglutide in clinical practice. Minerva Endocrinol. 2013;38:103–112. | ||
Inoue K, Maeda N, Fujishima Y, et al. Long-term impact of liraglutide, a glucagon-like peptide-1 (GLP-1) analogue, on body weight and glycemic control in Japanese type 2 diabetes: an observational study. Diabetol Metab Syndr. 2014;6:95. |
 © 2016 The Author(s). This work is published and licensed by Dove Medical Press Limited. The
full terms of this license are available at https://www.dovepress.com/terms
and incorporate the Creative Commons Attribution
- Non Commercial (unported, 3.0) License.
By accessing the work you hereby accept the Terms. Non-commercial uses of the work are permitted
without any further permission from Dove Medical Press Limited, provided the work is properly
attributed. For permission for commercial use of this work, please see paragraphs 4.2 and 5 of our Terms.
© 2016 The Author(s). This work is published and licensed by Dove Medical Press Limited. The
full terms of this license are available at https://www.dovepress.com/terms
and incorporate the Creative Commons Attribution
- Non Commercial (unported, 3.0) License.
By accessing the work you hereby accept the Terms. Non-commercial uses of the work are permitted
without any further permission from Dove Medical Press Limited, provided the work is properly
attributed. For permission for commercial use of this work, please see paragraphs 4.2 and 5 of our Terms.