Back to Journals » Clinical, Cosmetic and Investigational Dermatology » Volume 19
Trichoscopic Features, Clinical Correlates, and Risk Prediction in Female Pattern Hair Loss: A Retrospective Case-Control Study
Authors Long B, Long Q, Pan W, Chen S, Ye Z ![]() , Guo H
, Guo H
Received 30 November 2025
Accepted for publication 24 January 2026
Published 10 February 2026 Volume 2026:19 585446
DOI https://doi.org/10.2147/CCID.S585446
Checked for plagiarism Yes
Review by Single anonymous peer review
Peer reviewer comments 4
Editor who approved publication: Prof. Dr. Rungsima Wanitphakdeedecha
Boquan Long,1 Qi Long,1 Weitian Pan,2 Siqi Chen,1 Zhiming Ye,1 Hongwei Guo3
1Department of Dermatology, The second Affiliated Hospital of Guangdong Medical University, Zhanjiang, Guangdong, People’s Republic of China; 2The First Clinical College, Guangdong Medical University, Zhanjiang, Guangdong, People’s Republic of China; 3Department of Dermatology, Zhanjiang Central Hospital, Guangdong Medical University (Central People’s Hospital of Zhanjiang), Zhanjiang, Guangdong, People’s Republic of China
Correspondence:Hongwei Guo, Department of Dermatology, Zhanjiang Central Hospital, Guangdong Medical University (Central People’s Hospital of Zhanjiang), The 236th Yuanzhu Road, Chikan District, Zhanjiang, Guangdong, 524003, People’s Republic of China, Tel +86-13922087317, Email [email protected]
Background: Female Pattern Hair Loss (FPHL) is often confused with another condition called Chronic telogen effluvium (CTE). Trichoscopy plays an increasingly prominent role in the diagnosis and prognosis of hair disorders.
Objective: This study investigated the clinical manifestations and trichoscopic features of FPHL to identify correlations and to develop a nomogram model to predict the risk of FPHL.
Methods: A retrospective case-control study was conducted, including 151 FPHL patients (cases) and 151 CTE patients (controls). Clinical and trichoscopic data were analyzed to identify independent risk factors for FPHL and to establish a predictive nomogram model.
Results: The findings suggested that AGA family history (P< 0.05) and earlier onset of hair loss (P< 0.01) were more common in FPHL than CTE, suggesting that genetic background underlies early onset FPHL. Trichoscopic characteristics for FPHL differentiate from CTE and varied with the stage and severity of FPHL, while brown or white peripilar signs, white spot sign, yellow spot sign, scalp pigmentation, focal atrichia, hair shaft thickness heterogeneity > 10%, capillary dilatation, increased vellus hair, single hair were more predominantly observed in FPHL patients and positively correlated with disease severity (P< 0.05), implying that these trichoscopic signs could be poor prognosis indicators for FPHL. Logistic regression analysis identified multiple independent risk factors for FPHL, with the strongest being a family history of AGA (OR=4.26), followed by acne (OR=2.86), seborrheic dermatitis (OR=2.82), menstrual disorders (OR=2.23), a high-sugar and high-fat diet (OR=2.20), poor sleep quality (OR=2.06), and stress (OR=1.86).
Conclusion: The nomogram model based on our data is effective in predicting FPHL risk, which could help optimize disease management.
Keywords: female pattern hair loss, trichoscopy, risk factors, nomogram model
Introduction
Female pattern hair loss (FPHL), the most common type of diffuse alopecia of scalp in women, is characterized with an insidious onset, gradual progression, and non-scarring alopecia, presented with progressive loss of terminal hair in the frontal and parietal regions of the scalp, with reduced hair density and receding frontal hairline. The prevalence of FPHL was as high as 19% in Caucasians,1 and Chinese have a lower prevalence (about 3.1% to 6.0%) than Caucasians.2,3 Androgens and related hormone pathways play a decisive role in male androgenetic alopecia (M-AGA), accumulating studies suggested that the pathogenesis of M-AGA and FPHL are not identical, though the final pathological manifestations of M-AGA and FPHL are similar.4
Chronic telogen effluvium (CTE), also a common type of alopecia in women, characterized by diffuse, non-scarring shedding of hair, often shares clinical manifestations with FPHL and may coexist with it, thus it is often difficult to differentiate between the two when FPHL has not presented the typical hair loss pattern at early stage. It is important to note that increased hair shedding can precede the patterned hair loss of FPHL, which further complicates the clinical distinction from CTE. CTE is a self-limiting process and almost never causes obvious baldness, whereas FPHL progresses in time in certain patterns, leading to a significant reduction in hair density.5
Trichoscopy is considered as an important means of hair loss diseases differentiation, but a common standard has not been determined.6 It should be emphasized that the diagnosis of FPHL remains primarily clinical, and trichoscopy serves as a valuable supportive tool to aid differentiation, not a standalone diagnostic method. Nevertheless, elucidating the implications of trichoscopic findings in different hair loss conditions is of great significance for clinical practice. Here, through comparing the epidemiological features, clinical and trichoscopic manifestations between FPHL and CTE, and constructing a nomogram model for predicting FPHL development risk, we aimed to investigate the risk factors of FPHL and reveal the relationship between trichoscopic findings and disease type and severity, so as to optimize the disease management and to provide a more evidence-based foundation for future in-depth studies.
Methods
Study Population
One hundred and fifty-one FPHL and 151 CTE patients were enrolled in the Second Affiliated Hospital of Guangdong Medical University from October 2022 to March 2024. Inclusion criteria: all subjects gave informed consent to participate in the study. FPHL: patients falling under Sinclair scale grade 1–5. Stage 1 is normal. Stage 2 shows widening of the central part. Stage 3 shows widening of the central part and loss of volume lateral to the part line. Stage 4 shows the development of an anterior bald spot. Stage 5 shows advanced hair loss.7 CTE: persistent diffuse alopecia of more than 6 months, with or without a positive light hair-pulling test (>6 hair/test), but with a normal appearance of the scalp as a whole, without hair diameter reduction.5 Exclusion criteria: patients were excluded if they had hair loss from other conditions (such as fungal infection, alopecia areata, or scarring alopecia) or if they had received any topical including but not limited to minoxidil or systemic treatment for hair loss within the past 6 months.
Procedure
Clinical data collection: age, age of onset, disease duration, family history, menstruation and comorbidities were gathered. Sinclair grading method8 was applied to categorize the severity of FPHL. Non-contact polarised light dermoscopy (Dermlite, model DL3, 3Gen America Inc.) was employed to observe the scalp of all subjects including FPHL or CTE patients. Trichoscopic images were evaluated for established diagnostic and severity-related features, including brown peripilar sign (BPPS), white peripilar sign (WPPS), white spot sign, yellow spot sign, scalp pigmentation, focal atrichia, hair shaft thickness heterogeneity (HSTH), capillary dilatation, increased vellus hair, single hair, and scalp scales.6 The presence or absence of each feature was systematically documented for statistical analysis.
Statistical Analysis
Statistical tests were performed using SPSS 24.0. The rank sum test and the chi-square test were applied to assess measurement data and count data respectively. Correlation analyses were performed using the Spearman correlation test. Logistic regression equations were used for univariate and multivariate regression analyses. R3.5.3 and the rms package were used to build a nomogram model.9 The predictive efficacy of the model was assessed using calibration curves, ROC curves and decision curves.
Results
Sinclair Classification in FPHL Patients
The 151 FPHL patients fell into 5 subgroups based on the Sinclair grading method: the Sinclair stage I group (21 cases, 13.9%) (Figure 1a), Sinclair stage II group (80 cases, 53.0%) (Figure 1b), Sinclair stage III group (41 cases, 27.1%) (Figure 1c), Sinclair stage IV group (8 cases, 5.3%) (Figure 1d), and the Sinclair stage V group (1 case, 0.7%) (Figure 1e). Also, the 151 FPHL patients were categorized into 3 subgroups according to their onset age: ≤25 years old (77cases, 51.00%), 25–50 years old (72 cases, 47.68%), and >50 years old (2 cases, 1.32%).
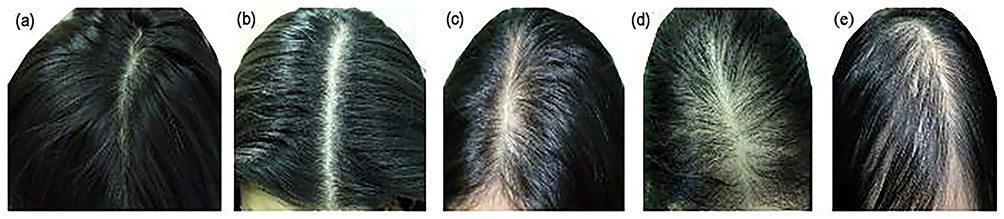 |
Figure 1 Clinical presentation of FPHL patients: (a) Sinclair stage I patients with no hair loss; (b) Sinclair stage II patients with widening of the midline on the top of the head; (c) Sinclair stage III patients with further widening of the midline on the top of the head and loss of hair volume on both sides of the midline; (d) Sinclair stage IV patients with diffuse alopecia on the top of the head; (e) Sinclair stage V patients with severe alopecia. |
The prevalence of AGA family history in the FPHL group was markedly greater than that in the CTE group (60.93% vs 27.15%, P<0.05). A statistically significant but weak positive association existed between the progression of FPHL patients and Sinclair grade (r=0.205, P=0.011) (Table 1). The average onset age of patients with AGA family history (21.57±7.78) was significantly earlier than that of patients without AGA family history (29.35±10.88) (P<0.001) (Table 2). The prevalence of AGA family history varied significantly across different FPHL onset age subgroups (P<0.001) (Table 3). The positive rate for the patients aged from 25ys to 50ys was 26.39%, while patients under 25ys exhibited the highest positive rate (61.04%). Whereas the positive rate for patients over 50ys was 0. There was also a notable association between AGA family history and Sinclair grading in FPHL patients (P<0.001) (Table 4). Significant disparities were observed in the distribution of Sinclair classification among onset age subgroups (P=0.016): Sinclair Grades III, IV, and V were the predominant classifications among patients aged ≤25 years (80.49%, 62.50%, and 100.00%, respectively), while Sinclair Grade II was the most prevalent in patients aged 25–50 years (55.0%) (Table 5).
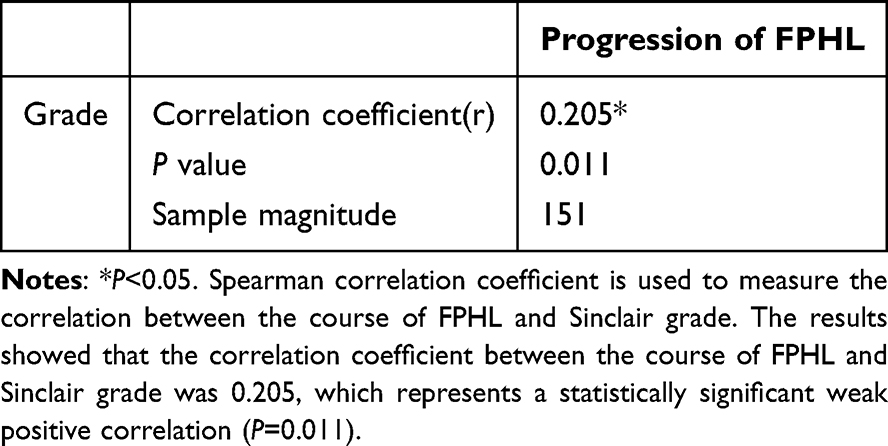 |
Table 1 Correlation Analysis Between the Progression of FPHL and Sinclair Grade |
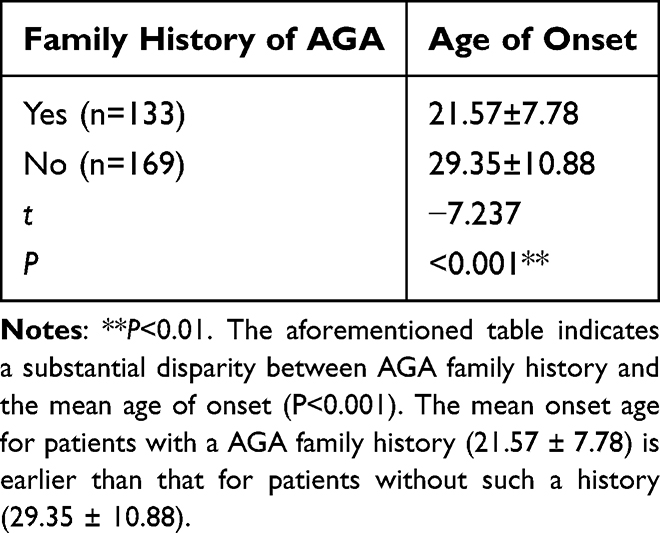 |
Table 2 Comparison of Age of Onset Between Patients with and Without a Family History of AGA |
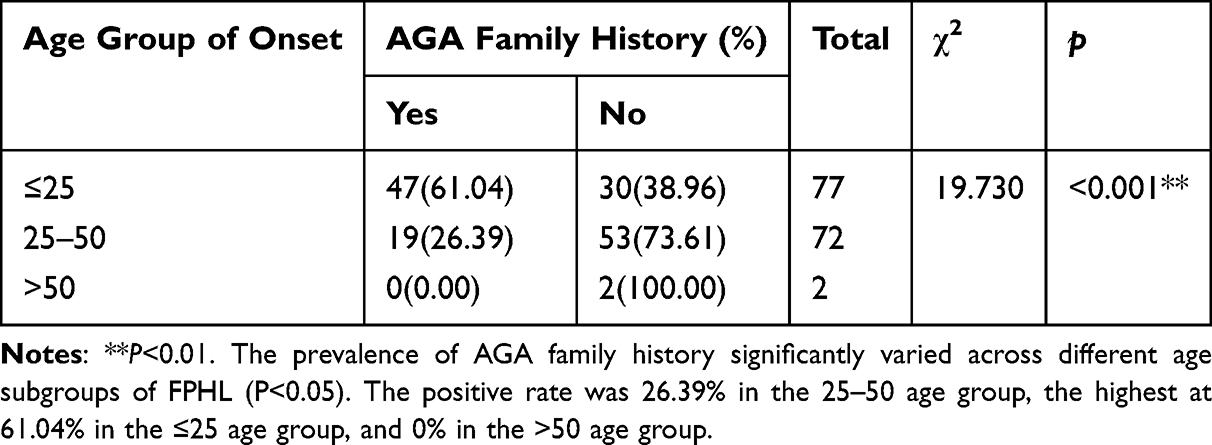 |
Table 3 Relationship Between the Positive Rate of AGA Family History and the Subgroup of Age Onset of FPHL |
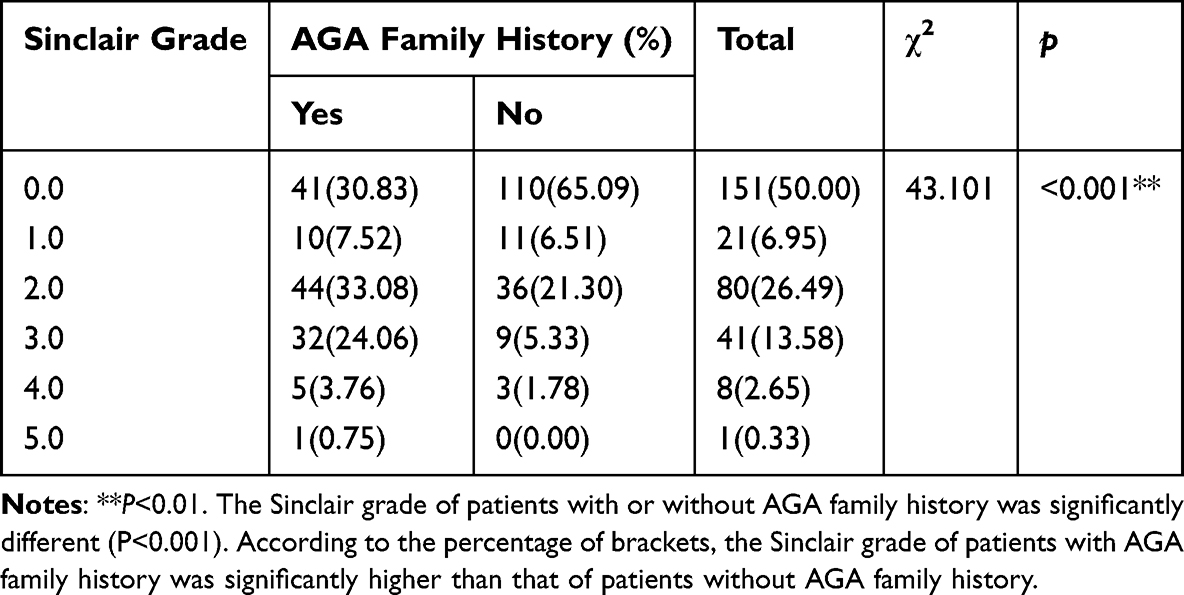 |
Table 4 Correlation Between AGA Family History and Sinclair Grade |
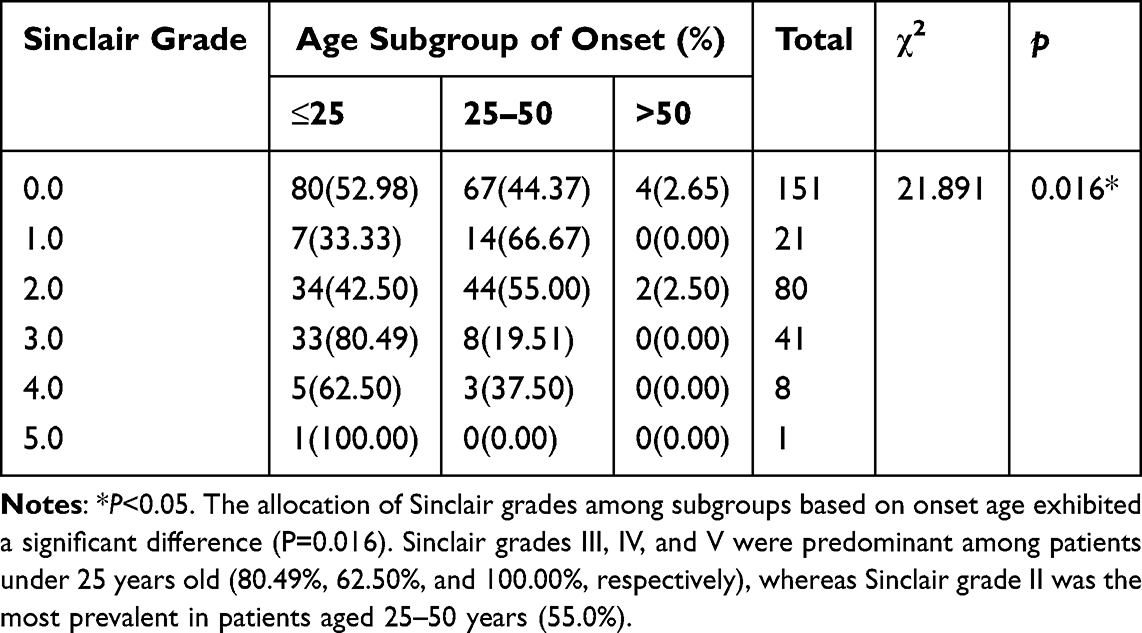 |
Table 5 Correlation Analysis Between Sinclair Grade and Age Subgroup of Onset |
Scalp Trichoscopic Features
Comparison Between the FPHL and TE Cohorts
Trichoscopic features were prevalent in FPHL but largely absent in CTE. In FPHL patients, the most common features were capillary dilatation (135, 89.40%), HSTH>10% (117, 77.48%), and increased vellus hair (116, 76.82%). BPPS (104, 68.87%), scalp scales (92, 60.93%), scalp pigmentation (88, 58.28%), single hair (79, 52.32%), yellow spot sign (62, 41.06%), focal atrichia (61, 40.40%), white spot sign (55, 36.42%), and WPPS (45, 29.80%) were also frequently observed (Figure 2a–d). In contrast, only focal atrichia (9, 6.0%) and yellow spot sign (8, 5.3%) were present at low rates in CTE. Notably, pestle hair and hypopigmentation of the hair shaft near the skin surface were observed exclusively in CTE (45, 29.8%, Figure 2e). The prevalence of white spot sign and scalp pigmentation did not differ significantly between the two groups (P>0.05, Figure 3).
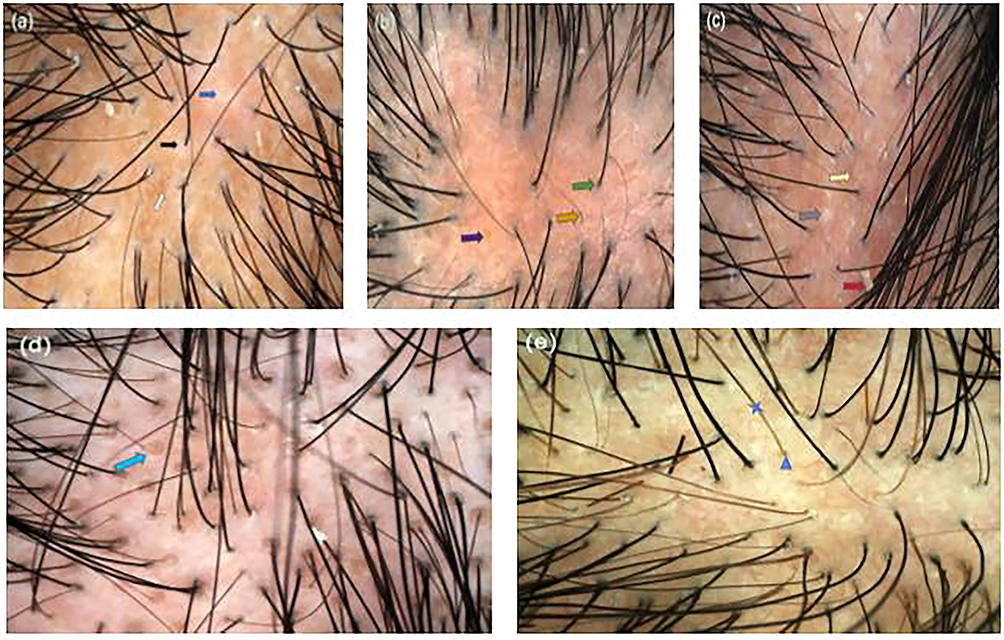 |
Figure 2 Representative trichoscopic features in FPHL. (a) White peripilar sign (WPPS, black arrow), scalp pigmentation (white arrow), and focal atrichia (blue arrow). (b) Yellow spot sign (purple arrow), increased vellus hair (Orange arrow), and single hair (green arrow). (c) White spot sign (grey arrow), scalp scales (red arrow), and capillary dilatation (golden arrow). (d) Brown peripilar sign (BPPS, light blue arrow). (e) pestle hair (blue triangle) and hypopigmentation of the hair shaft near the skin surface (blue star). |
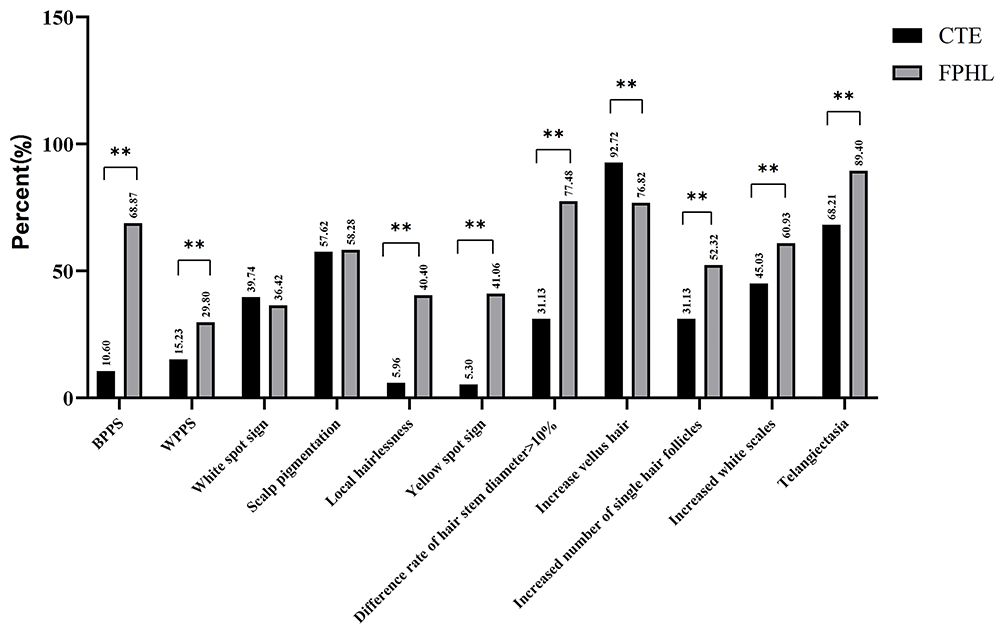 |
Figure 3 Comparison of scalp trichoscopic features between FPHL and CTE. Note: **P<0.01 when comparing the two groups. |
Comparison Among Subgroups of FPHL Patients
Scalp trichoscopic findings revealed that BPPS, WPPS, white spot sign, yellow spot sign, scalp pigmentation, focal atrichia, HSTH >10%, capillary dilatation, increased vellus hair and single hair were more common in severe FPHL with Sinclair stage IV and V than mild FPHL with Sinclair stage I (P<0.05), therefore were positively correlated with severe FPHL with Sinclair stage IV and V (P<0.05). In addition, the difference in the positive rate of WPPS was also statistically significant between FPHL with Sinclair stage III and IV (P<0.05). However, the difference in the increased scalp scales was not statistically significant between the FPHL subgroups with different Sinclair stage (P>0.05) (Figure 4).
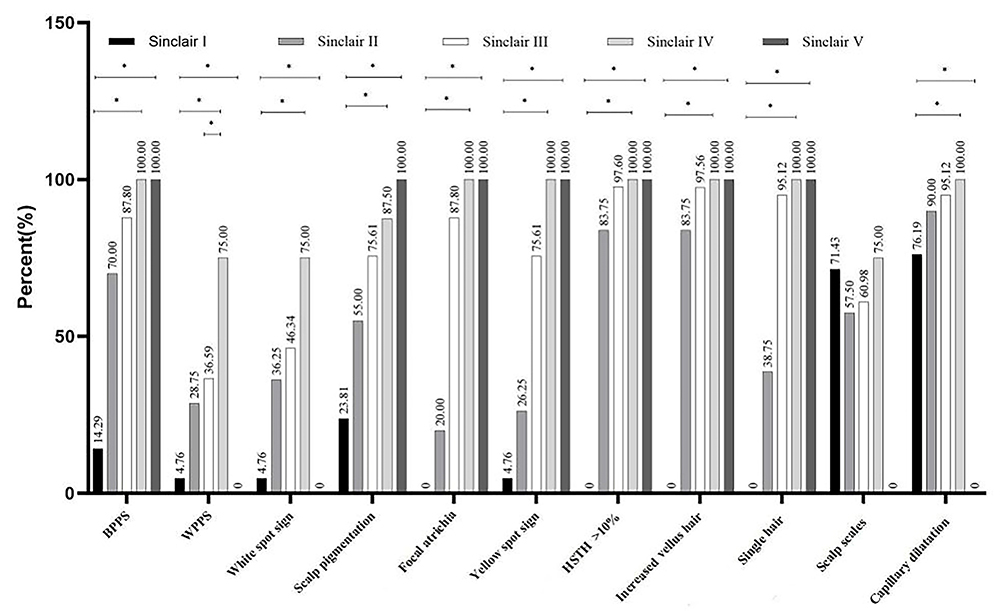 |
Figure 4 The scalp trichoscopic features in FPHL with different Sinclair grades. Note: *P<0.05 when comparing the two groups. |
Comorbidities in the FPHL and CTE Cohorts
The comparative examination of the overall data across the two cohorts revealed that significant disparities were observed in AGA family history, menstrual disorders, poor sleep quality, stress, high-sugar and high-fat diet, acne, and seborrheic dermatitis between the two groups (P<0.05). There were no significant differences in age, age of onset, perimenopausal and menopausal period, pregnancy, hirsutism, obesity, diabetes, heart disease, and polycystic ovary syndrome between the two groups (P>0.05) (Table 6). The occurrence of FPHL served as the dependent variable, while indicators with a P-value less than 0.1 from the two groups of differential comorbidities were utilized for multifactorial logistic regression analysis. The results showed that the AGA family history (OR=4.26, 95% CI=2.50–7.25), menstrual disorders (OR=2.23, 95% CI=1.20–4.14), poor sleep quality (OR=2.06, 95% CI=1.21–3.52), stress (OR=1.86, 95% CI=1.10–3.15), high-sugar and high-fat diet (OR=2.20, 95% CI=1.26–3.83), acne (OR=2.86, 95% CI=1.33–6.15), seborrheic dermatitis (OR=2.82, 95% CI=1.52–5.21) was significantly positively correlated with the occurrence of FPHL, representing independent risk factors for this condition (Table 7).
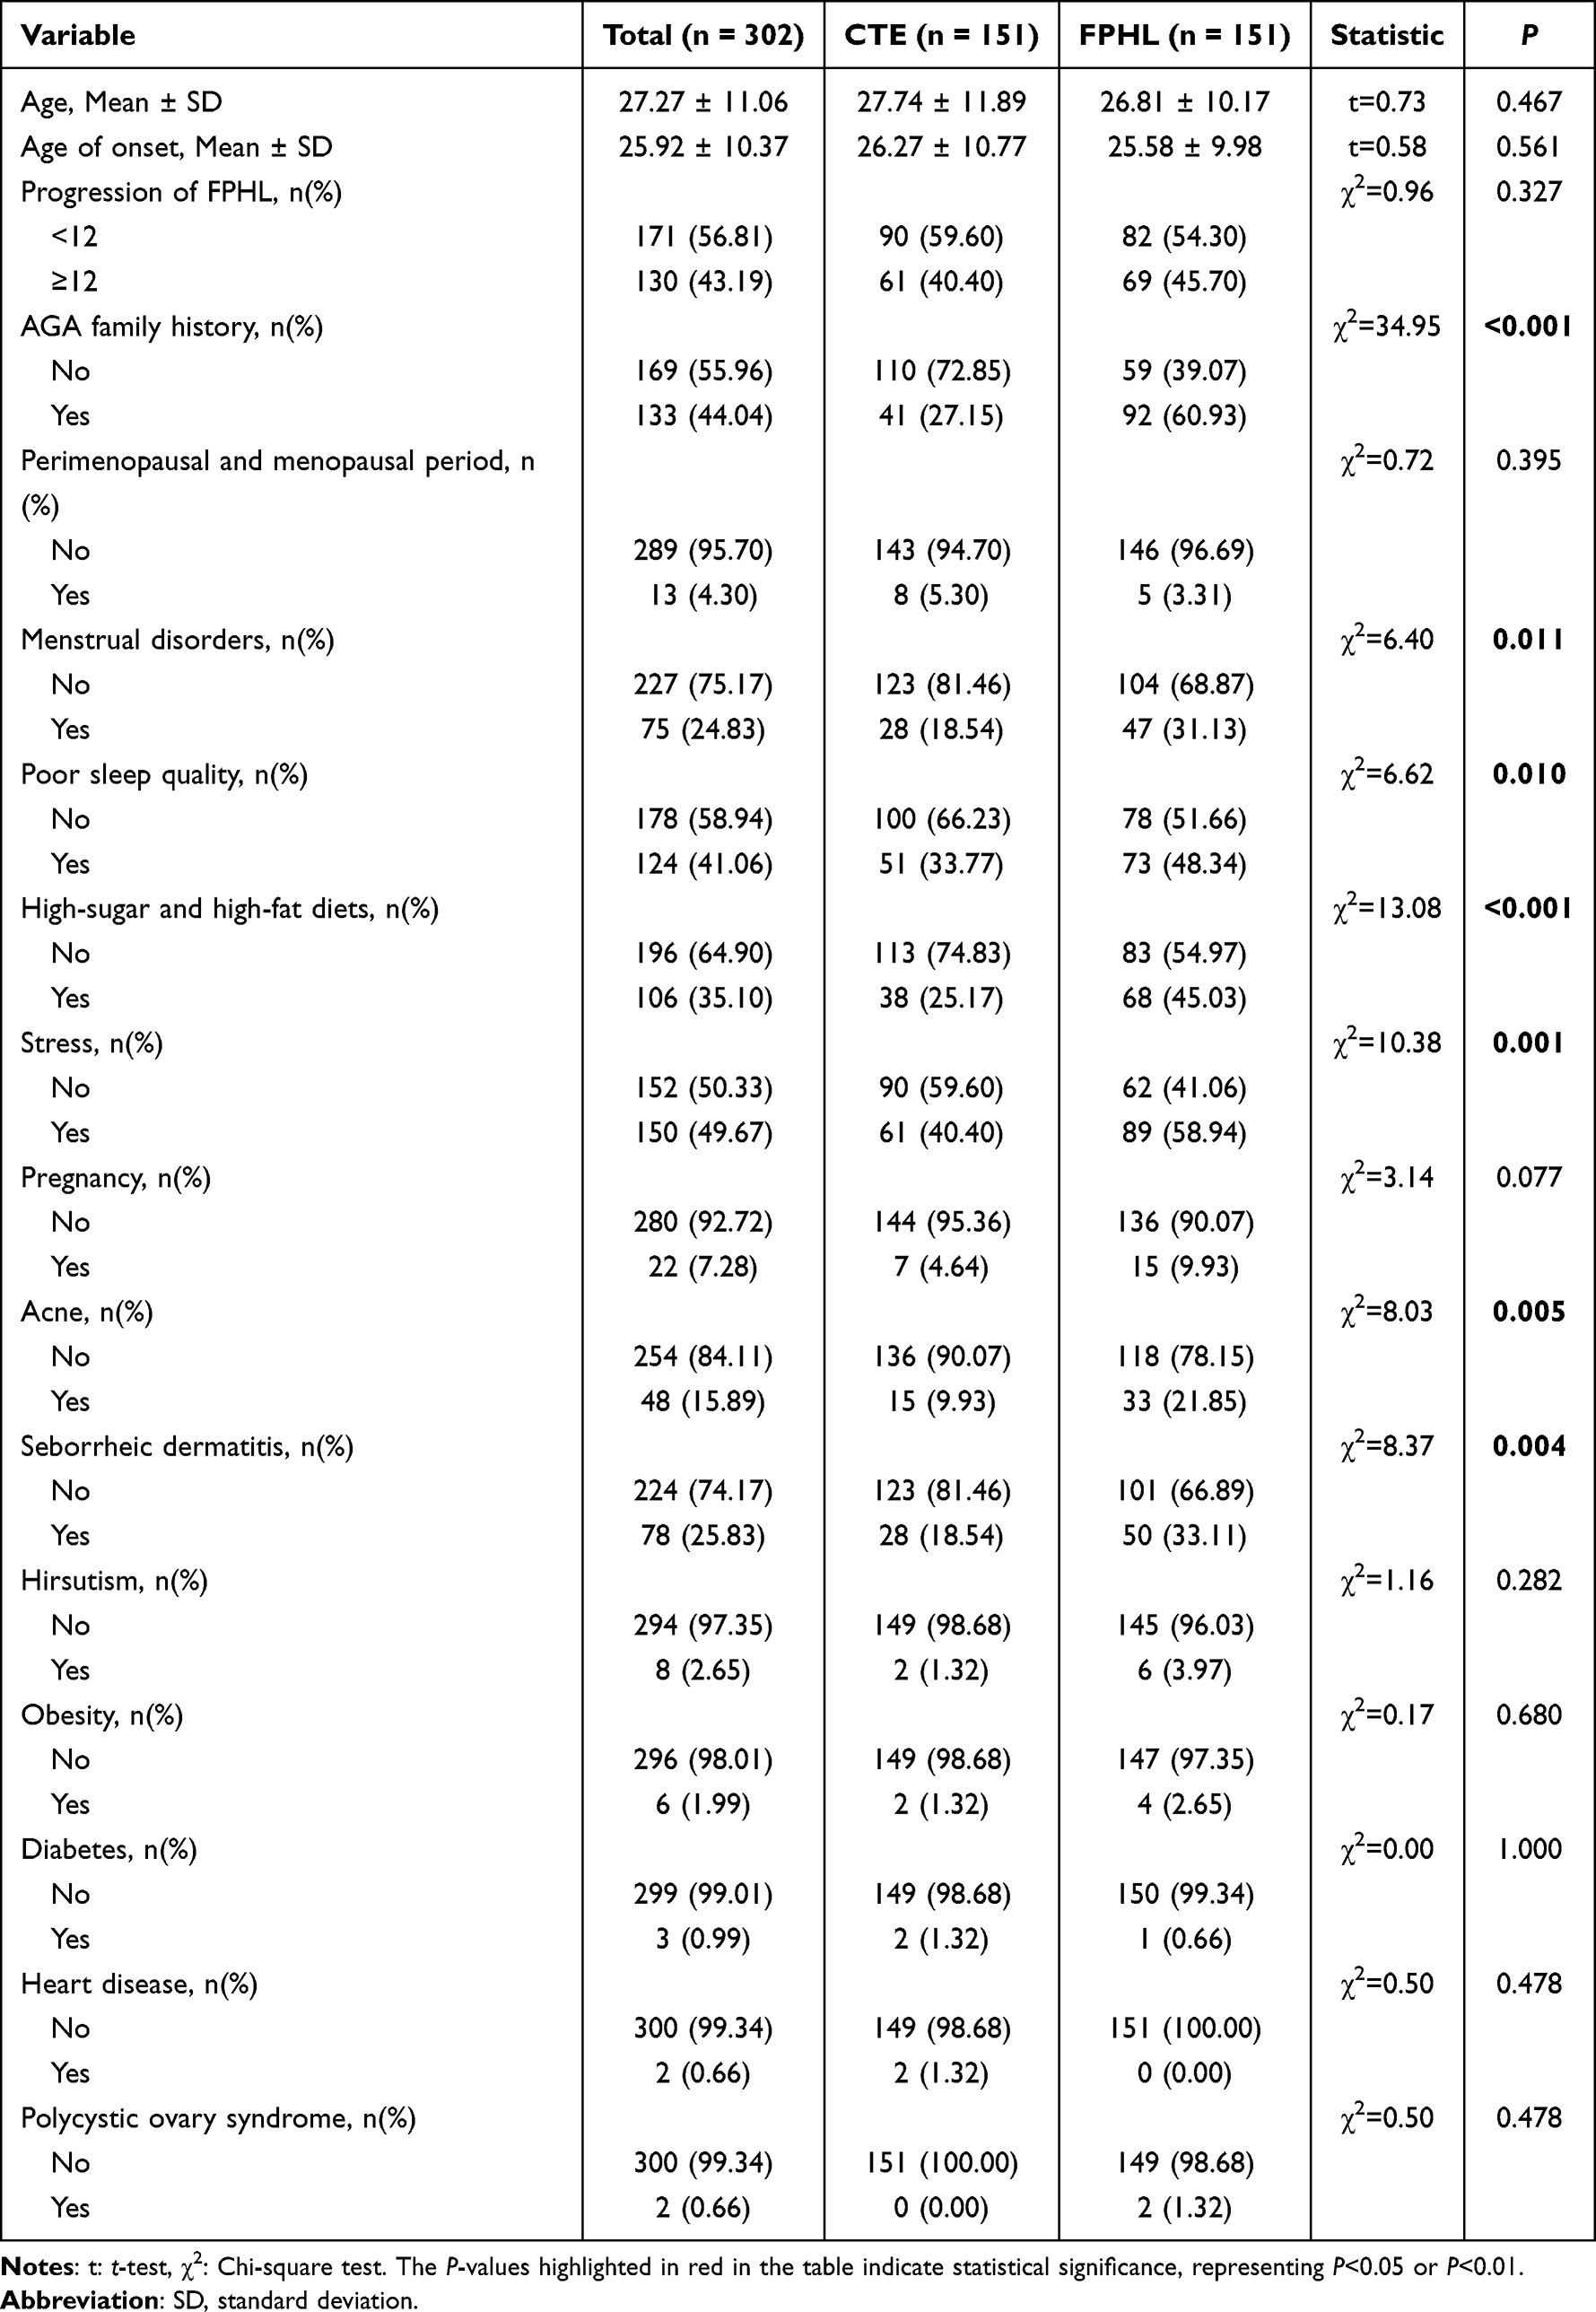 |
Table 6 Comparative Analysis of Clinical Data Between Two Patient Cohorts |
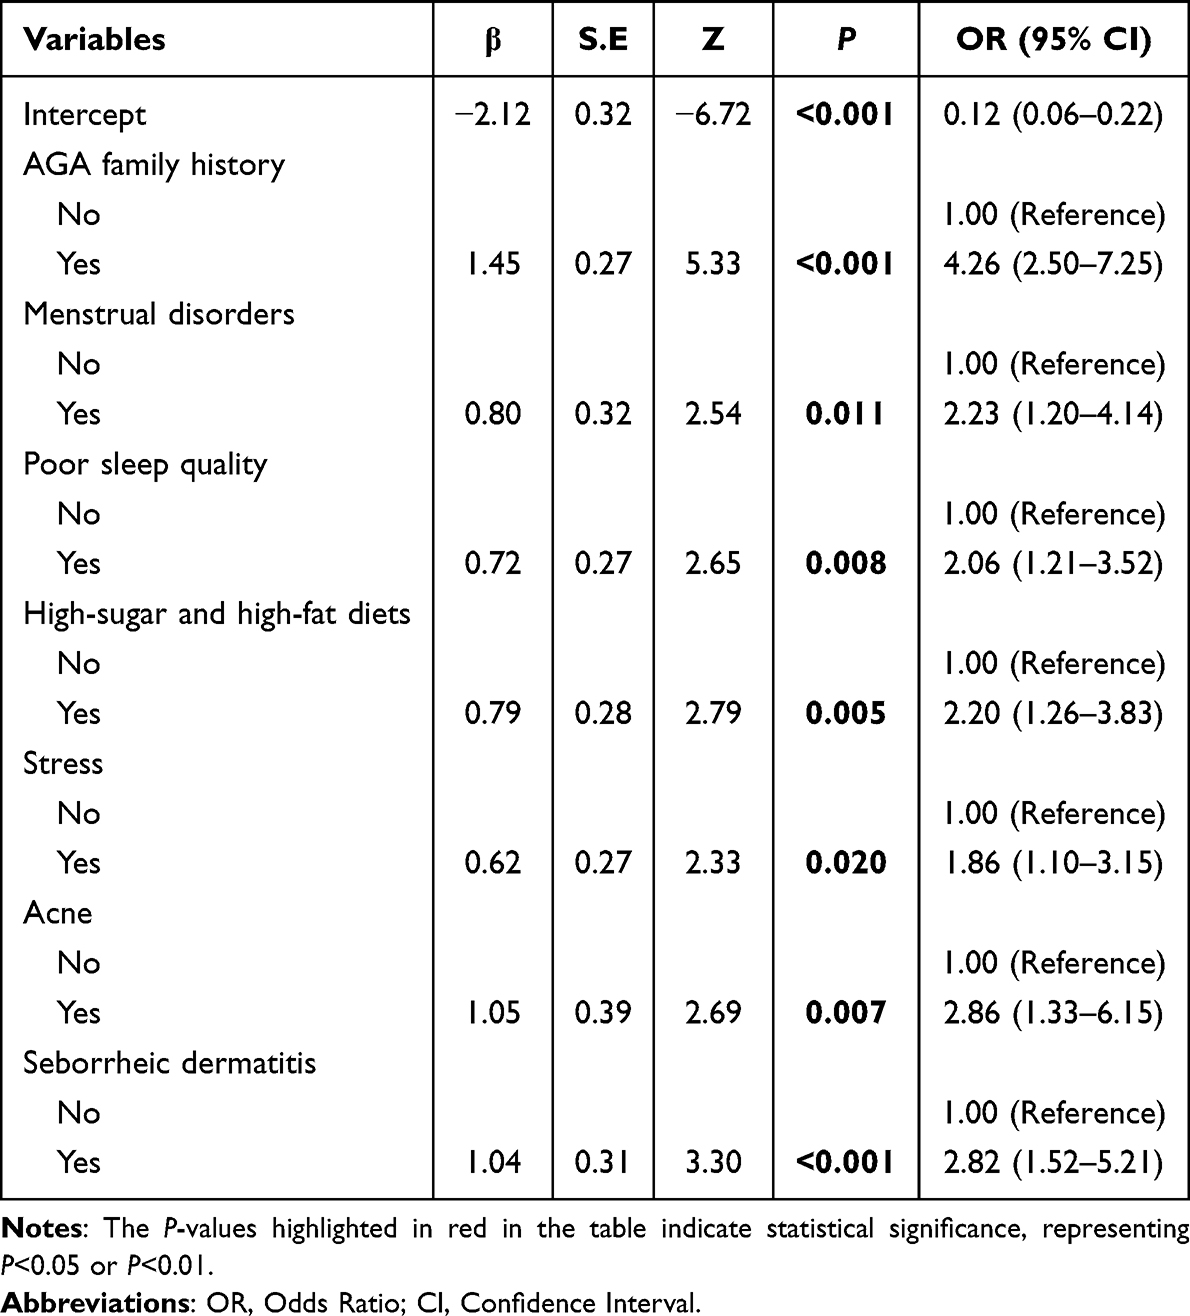 |
Table 7 Multivariate Binary Logistic Regression Analysis |
Development of a Multifactorial Predictive Model
The nomogram of the predictive model is developed using independent predictors, and the likelihood of FPHL is assessed by the nomogram. The technique of usage is as follows: Points represent the scores associated with each individual predictor, whereas total points denote the cumulative scores obtained by summing the scores of each predictor to the respective total score. The likelihood of FPHL can be determined by utilising total points to create a vertical line. The value associated with this total score is the estimated probability of FPHL according to the model. A higher total score correlates with an increased likelihood of FPHL (Figure 5).
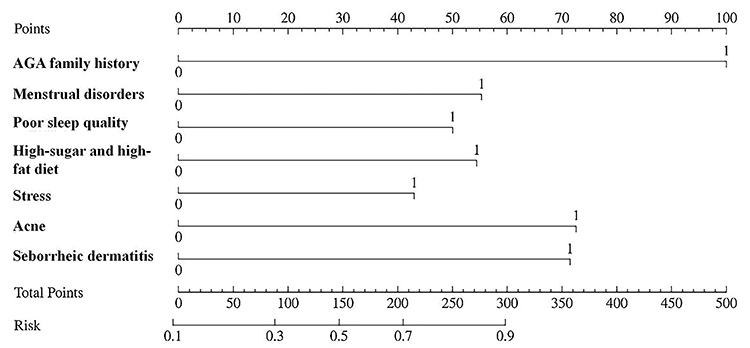 |
Figure 5 The score values associated with each predictor. |
Assessment and Validation of the Model
Distinctive Analysis
The findings indicate that the C-index (AUC value) of the model is 0.786 (95% CI: 0.735–0.838), with an appropriate threshold of 0.458, yielding a sensitivity of 0.669 and a specificity of 0.788 (Figure 6 and Table 8). The model underwent internal verification with Bootstrap’s repeated sampling conducted 1000 times. Following internal validation, the model’s C-index (AUC value) was determined to be 0.781, indicating that the model retains a moderate discriminative capacity in Bootstrap samples (Figure 7). The calibration curve converges with the ideal curve, signifying the model’s predictions. The decision curve, spanning from 20% to 80%, illustrates the nomogram’s prediction of net benefit concerning FPHL, signifying its substantial practical utility.
 |
Table 8 Analysis of the Diagnostic Value of the Model |
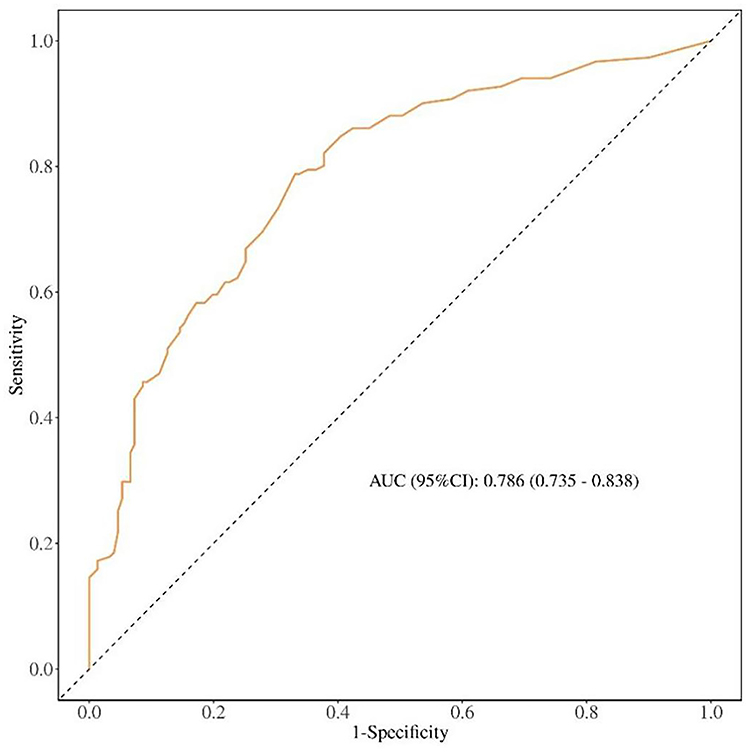 |
Figure 6 ROC curve. |
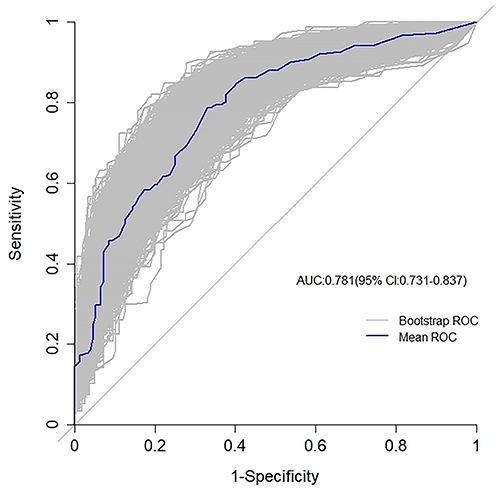 |
Figure 7 Bootstrap internal verification. |
Calibration Assessment
Calibration curves were employed to assess the model’s calibration proficiency. The results of the Hosmer-Lemeshow test indicated that: X2=3.177, P=0.923>0.05, signifying no disparity between the predicted probability and the actual probability. Following internal verification by Bootstrap’s repeated sampling of 1000 iterations, the absolute error was 0.017. The calibration curve closely resembled both the ideal curve and the actual curve, with a slope approaching 1 (Figure 8). Consequently, this model is considered to possess superior accuracy.
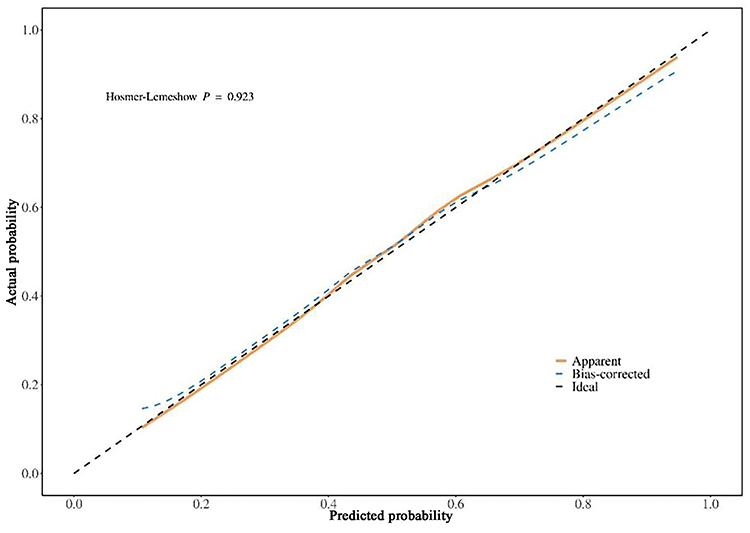 |
Figure 8 The calibration curve. |
Clinical Practical Assessment Using the Model
The decision curve analysis (DCA) was employed to assess the clinical utility of the model. The findings indicate that the model’s threshold interval is extensive. When the threshold probability ranges from 20% to 80%, the use of this model yields a superior clinical net benefit, with its net benefit level markedly above both the None line and the All line, indicating enhanced clinical applicability. The cutoff value (0.458) derived from the ROC analysis depicted above falls inside the threshold probability range of the clinical decision curve for the predicted model, indicating that the predicted model possesses clinical efficacy. Subsequent investigation indicates that if the predictive model assesses the likelihood of FPHL to exceed 45.8%, approximately 25 out of 100 patients may derive benefit (Figure 9).
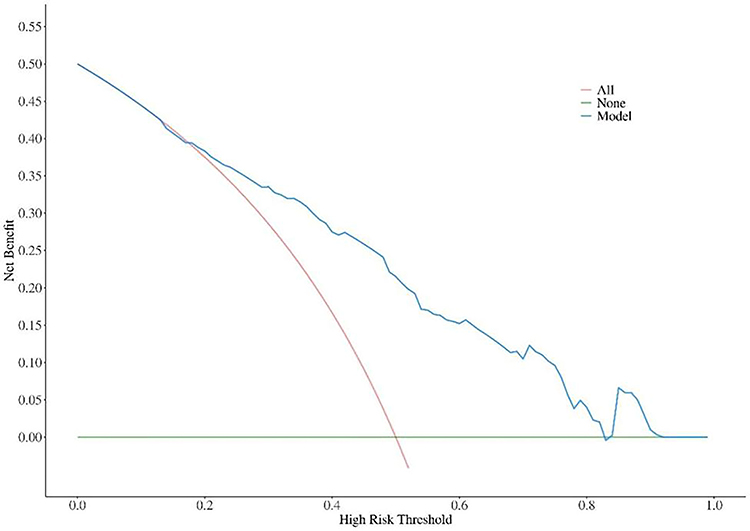 |
Figure 9 Clinical decision curve for the prediction model. |
Discussion
The evidence to differentiate FPHL from CTE is undetermined, and the FPHL associated risk factors are unclear. In this study, we tried to identify parameters to resolve the ambiguities using trichoscopic findings, family and personal history.
AGA Family History Increase the Risk of Early Onset of FPHL
We found that the AGA family history in FPHL patients was more common than that in CTE (60.90% vs 27.00%). Other studies reported the positive rate of AGA family history was about 19.2% to 32.4%.1,10 We also found that FPHL patients with AGA family history had an earlier onset as compared to FPHL without AGA family history, while FPHL patients with an onset age under 25ys had the highest AGA family history compared to other age subgroups. Remarkably, other research has concluded that hair loss in several family members and grandparents may signify an increased chance of hair loss.10 The degree of heritability from the paternal lineage was irrespective of the exact hair loss type,1 and a positive maternal history may be highly significant for the development of FPHL. Our data are consistent with previous reports, suggesting that genetic factor may play a more important role in FPHL than CTE. We propose that genetic predisposition could increase the risk of early onset FPHL in adolescents.
Distinct Trichoscopic Features and Pathological Correlations of FPHL
Variation in Hair Shaft Diameter
In our study, variation in hair shaft diameter in FPHL patients was >10% which is probably due to the gradual and asynchronous hair loss, HF miniaturization and vellus hair replacements in the affected scalp region.11 However, pestle-like hair and hypopigmentation of the hair shaft near the skin surface were only seen in CTE: our findings are consistent with other reports.12 Pestle-like hair (often called “pigtail hair” or “hockey-stick hair”) is fractured hair with a distinctively tapered, curved end, resembling the shape of a pestle or a hockey stick, which is strongly associated with traction injury.13 The constant pulling and tension can damage the hair follicle bulb and the matrix where melanin is incorporated into the developing hair shaft, the newly growing segment emerging from the stressed follicle might lack pigment temporarily or permanently so as to present proximal hypopigmentation.14 Indeed, the finding of pestle-like hairs along with proximal hypopigmentation of the hair shaft is a very common dermoscopic hallmark of CTE, reflecting the ongoing traction injury affecting hair shape and pigment production in the regenerating hairs in CTE.
PPS, White Spot Sign, Yellow Spot Sign, Scalp Pigmentation and Focal Atrichia Served as Poor Prognostic Factors
PPS, present as a brown to white halo roughly 1 mm in diameter surrounding the follicular entrance, may be associated with perifollicular lymphocyte infiltration and melanin synthesis.15 Our findings indicate that BPPS and WPPS are more prevalent and characteristic in FPHL at advanced stages (Sinclair stage IV and V), which is in line with the previous findings.16 White PPS is also thought to be linked to perifollicular fibrosis in the advanced phases of FPHL, indicating a diminished response to treatment.17
The white spot sign, often observed in patients with lichen planus and folliculitis decalvans,18 may correlate with fibrosis in the specific follicular area and so are referred to as “fibrotic white dots”.19 It is known that hair follicles can be replaced by connective tissue in severe alopecia, leading to fibrosis and ultimately to follicular atrophy.20
Also, these white dots could be discovered in healthy individuals with Fitzpatrick skin phototypes IV–VI,21 probably due to apical sweat ducts or sebaceous gland openings on the contrasting pigmented background.19 In our study, white spot sign was observed to be more common in FPHL patients with Sinclair stage IV and V, suggesting white spot sign could serve as a poor prognostic factor for FPHL.
When sebum is expelled through the hair follicle opening, some of the sebum adheres to the hair shaft as it grows. Thus, in the absence of apical hair, intact sebaceous glands secrete excess sebum and form yellow dots.22 Some experts proposed that yellow dots in AGA could possibly be enlarged sebaceous glands caused by end-organ hypersensitivity to androgens.23
The yellow spot sign was more frequently observed in advanced stages of FPHL. Notably, a large number of regular distributed and uniform yellow dots were found in more than 60% of pemphigus vulgaris patients as being considered a sign of disease severity.24
Focal atrichia has small circular areas devoid of hair resulting from atrophied hair follicles. Focal atrichia was found in Sinclair stage III (87.80%), stage IV (100%), and stage V (100%), showing a positive correlation between focal atrichia and the advancement of FPHL.
The pathogenesis of scalp pigmentation is not yet clear, and it may be related to the influence of melanocyte metabolism, cosmetics, ultraviolet light, and mucin deposition, which is considered to be the result of dermal inflammatory infiltration.25,26 The findings suggested 58.28% FPHL and 57.62% CTE had positive scalp pigmentation, though it was more common in FPHL at advanced stage (Sinclair stage IV and V),16 suggesting that both FPHL and CTE involve similar degrees of scalp inflammation.
Capillary dilatation is believed to correspond to the subcutaneous vascular plexus, potentially linked to vasodilation resulting from inflammatory infiltration.27 In our study, capillary dilatation was observed in early-stage FPHL as compared to advanced stage V (P<0.05). Early-stage FPHL may exhibit active inflammation, leading to vasodilation as a transient response. At advanced-stage FPHL, progressiveperifollicular fibrosismay compress capillaries, reducing visible dilatation despite persistent hypoxia.28
Scalp scales are classified as a non-specific observation in FPHL29 as they are also observed in people with inflammatory scalp disorders such as seborrheic dermatitis and psoriasis. Outcomes illustrated, the presence of scalp scales did not vary among any subgroup of FPHL and CTE, indicating the overall inflammation happen in both FPHL and CTE.
The Nomogram Model to Predict Risk Factors for FPHL
The nomogram model is a simple, evident and visualized scoring tool to assess an individual’s risk of disease based on relevant factors. In the nomogram model, there is no need to calculate complex regression equations. The total score of the objects can be calculated according to the score of each predictor in the figure, and then the risk of individual outcome events can be found out correspondingly in the column chart.
This study detected that seven factors including AGA family history, menstrual disorders, poor sleep quality, stress, high-sugar and high-fat diet, stress, acne and seborrheic dermatitis are independent risk factors for the development of FPHL. We categorised the risk of FPHL into three tiers: a probability of less than 50% as low risk, 50% to 70% as medium risk, and greater than 90% as high risk. Subsequently, we executed graded management based on the assessed risk level and the trigger factors identified in the nomogram. For example, sleep monitoring in conjunction with pharmacological and psychotherapeutic strategies might mitigate local inflammatory damage and immune destruction.30,31 Accordingly, it would be feasible to mitigate neuropsychological triggers and exacerbating variables in order to establish conducive conditions for the regeneration of the hair follicle.
Before concluding, it is important to acknowledge several limitations of this study. First, its retrospective design is susceptible to recall bias, which may affect the accuracy of self-reported variables such as the precise age of onset, long-term dietary habits, and historical stress exposure. Such misclassification could lead to underestimation or overestimation of their true associations with FPHL. Second, the relatively restricted sample size and potential selection bias may limit the generalizability of the findings. Third, the absence of longitudinal dermatoscopic monitoring precludes analysis of dynamic changes in trichoscopic indicators over time. Finally, the lack of a healthy control group restricts the ability to determine the specificity of the observed clinical and dermatoscopic features.
Therefore, future prospective studies with larger and more diverse cohorts are warranted. These should utilize objectively measured or prospectively collected data to minimize recall bias, include appropriate control groups, incorporate serial dermatoscopic evaluations to track disease progression, and perform external validation to corroborate and refine the predictive model established here.
Conclusion
Our research further proves that genetic backgrounds contribute to the early onset of FPHL. The trichoscopic manifestations, PPS, white spot sign, yellow spot sign, scalp pigmentation and focal atrichia are correlated to the FPHL severity. AGA family history, menstrual disorders, poor sleep quality, stress, high-sugar and high-fat diet, acne and seborrheic dermatitis are FPHL risk factors. This research constructs a nomogram model based on the comorbidities that can accurately predict the risk of FPHL and enhance disease treatment strategies.
Data Sharing Statement
The original contributions presented in the study are included in the article, further inquiries can be directed to the corresponding author.
Ethics Statement
The study was conducted in accordance with the Declaration of Helsinki and was approved by the Ethics Committee of The second Affiliated Hospital of Guangdong Medical University (Project no: PJKT2025-017). All participants gave informed consent before study participation.
Informed Consent Statement
Informed consent was obtained from all subjects involved in the study.
Acknowledgments
We sincerely appreciate all subjects who participated in this clinical trial. Their willingness to contribute to medical research is invaluable. We deeply acknowledge their time, effort, and commitment to this study.
Author Contributions
All authors made a significant contribution to the work reported, whether that is in the conception, study design, execution, acquisition of data, analysis and interpretation, or in all these areas; took part in drafting, revising or critically reviewing the article; gave final approval of the version to be published; have agreed on the journal to which the article has been submitted; and agree to be accountable for all aspects of the work.
Funding
This work was supported by the following grant: Science and Technology Program, Zhanjiang (NO. 21H01).
Disclosure
The authors declare no conflicts of interest for this work.
References
1. Norwood OT. Incidence of female androgenetic alopecia (female pattern alopecia). Dermatol Surg. 2001;27(1):53–15.
2. Wang TL, Zhou C, Shen YW, et al. Prevalence of androgenetic alopecia in China: a community-based study in six cities. Br J Dermatol. 2010;162(4):843–847. doi:10.1111/j.1365-2133.2010.09640.x
3. Xu F, Sheng YY, Mu ZL, et al. Prevalence and types of androgenetic alopecia in Shanghai, China: a community-based study. Br J Dermatol. 2009;160(3):629–632. doi:10.1111/j.1365-2133.2008.08909.x
4. Ho CY, Chen JY, Hsu WL, et al. Female pattern hair loss: an overview with focus on the genetics. Genes (Basel). 2023;14(7):1326. doi:10.3390/genes14071326
5. Toncić RJ, Lipozencić J, Pastar Z. Videodermoscopy in the evaluation of hair and scalp disorders. Acta Dermatovenerol Croat. 2007;15(2):116–118.
6. Kinoshita-Ise M, Sachdeva M. Update on trichoscopy: integration of the terminology by systematic approach and a proposal of a diagnostic flowchart. J Dermatol. 2022;49(1):4–18. doi:10.1111/1346-8138.16233
7. Sinclair R, Jolley D, Mallari R, Magee J. The reliability of horizontally sectioned scalp biopsies in the diagnosis of chronic diffuse telogen hair loss in women. J Am Acad Dermatol. 2004;51(2):189–199. doi:10.1016/s0190-9622(03)00045-8
8. Messenger AG, Sinclair R. Follicular miniaturization in female pattern hair loss: clinicopathological correlations. Br J Dermatol. 2006;155(5):926–930. doi:10.1111/j.1365-2133.2006.07409.x
9. Long SY, Sun JY, Wang L, et al. Predictive nomogram for leprosy using genetic and epidemiological risk factors in Southwestern China: case-control and prospective analyses. EBioMedicine. 2021;68:103408. doi:10.1016/j.ebiom.2021.103408
10. Gonzalez ME, Cantatore-Francis J, Orlow SJ. Androgenetic alopecia in the paediatric population: a retrospective review of 57 patients. Br J Dermatol. 2010;163(2):378–385. doi:10.1111/j.1365-2133.2010.09777.x
11. de Lacharrière O, Deloche C, Misciali C, et al. Hair diameter diversity: a clinical sign reflecting the follicle miniaturization. Arch Dermatol. 2001;137(5):641–646. doi:10.1001/archderm.137.5.641
12. Zhu ZH, Ye YT, Cao H, Ling YX, Zhang XQ. Clinical and dermoscopic features of acute telogen effluvium. J Clin Dermatol. 2017;46(2):89–92.
13. Rebora A. Telogen effluvium revisited. G Ital Dermatol Venereol. 2014;149(1):47–54.
14. Zhang XQ. Diagnosis and treatment of telogen effluvium. Chin J Dermatol. 2017;50(5):388–390.
15. Abdalla D, Bosseila M, Abdel-Halim MRE, Sany I. Peripilar sign in androgenetic alopecia: does it really indicate peripilar infiltrate? Dermatol Pract Concept. 2024;14(1):e2024096. doi:10.5826/dpc.1401a96
16. Zhang X, Caulloo S, Zhao Y, Zhang B, Cai Z, Yang J. Female pattern hair loss: clinico-laboratory findings and trichoscopy depending on disease severity. Int J Trichol. 2012;4(1):23–28. doi:10.4103/0974-7753.96082
17. Yoo HG, Kim JS, Lee SR, et al. Perifollicular fibrosis: pathogenetic role in androgenetic alopecia. Biol Pharm Bull. 2006;29(6):1246–1250. doi:10.1248/bpb.29.1246
18. Rudnicka L, Olszewska M, Rakowska A, Slowinska M. Trichoscopy update 2011. J Dermatol Case Rep. 2011;5(4):82–88. doi:10.3315/jdcr.2011.1083
19. Rudnicka L, Olszewska M, Rakowska A, et al. Trichoscopy in hair and scalp disease. In: Rudnicka L, Olszewska M, Rakowska A, editors. Atlas of Trichoscopy: Dermoscopy in Hair and Scalp Disease. London: Springer; 2012:47–72.
20. Won CH, Kwon OS, Kim YK, et al. Dermal fibrosis in male pattern hair loss: a suggestive implication of mast cells. Arch Dermatol Res. 2008;300(3):147–152. doi:10.1007/s00403-007-0826-x
21. Abraham LS, Piñeiro-Maceira J, Duque-Estrada B, Barcaui CB, Sodré CT. Pinpoint white dots in the scalp: dermoscopic and histopathologic correlation. J Am Acad Dermatol. 2010;63(4):721–722. doi:10.1016/j.jaad.2009.12.011
22. Rakowska A, Slowinska M, Kowalska-Oledzka E, Olszewska M, Rudnicka L. Dermoscopy in female androgenic alopecia: method standardization and diagnostic criteria. Int J Trichol. 2009;1(2):123–130. doi:10.4103/0974-7753.58555
23. Inui S, Nakajima T, Itami S. Scalp dermoscopy of androgenetic alopecia in Asian people. J Dermatol. 2009;36(2):82–85. doi:10.1111/j.1346-8138.2009.00593.x
24. Inui S, Nakajima T, Nakagawa K, Itami S. Clinical significance of dermoscopy in alopecia areata: analysis of 300 cases. Int J Dermatol. 2008;47(7):688–693. doi:10.1111/j.1365-4632.2008.03692.x
25. Tawfik SS, Sorour OA, Alariny AF, Elmorsy EH, Moneib H. White and yellow dots as new trichoscopic signs of severe female androgenetic alopecia in dark skin phototypes. Int J Dermatol. 2018;57(10):1221–1228. doi:10.1111/ijd.14140
26. Jaworsky C, Kligman AM, Murphy GF. Characterization of inflammatory infiltrates in male pattern alopecia: implications for pathogenesis. Br J Dermatol. 1992;127(3):239–246. doi:10.1111/j.1365-2133.1992.tb00121.x
27. Miteva M, Tosti A. Hair and scalp dermatoscopy. J Am Acad Dermatol. 2012;67(5):1040–1048. doi:10.1016/j.jaad.2012.02.013
28. Sadgrove N, Batra S, Barreto D, Rapaport J. An updated etiology of hair loss and the new cosmeceutical paradigm in therapy: clearing the big eight strikes. Cosmetics. 2023;10(4):106. doi:10.3390/cosmetics10040106
29. Köse Ö K, Güleç AT. Clinical evaluation of alopecias using a handheld dermatoscope. J Am Acad Dermatol. 2012;67(2):206–214. doi:10.1016/j.jaad.2011.08.019
30. Li Y, Wang Y, Zhang Y, Wang W, Ai H. Causal relationship between sleep characteristics and alopecia areata and other non-scarring alopecia: a two-sample bidirectional Mendelian randomization analysis. Clin Cosmet Invest Dermatol. 2025;18:2907–2921. doi:10.2147/CCID.S546362
31. Liamsombut S, Pomsoong C, Kositkuljorn C, Leerunyakul K, Tantrakul V, Suchonwanit P. Sleep quality in men with androgenetic alopecia. Sleep Breath. 2023;27(1):371–378. doi:10.1007/s11325-022-02618-x
 © 2026 The Author(s). This work is published and licensed by Dove Medical Press Limited. The
full terms of this license are available at https://www.dovepress.com/terms
and incorporate the Creative Commons Attribution
- Non Commercial (unported, 4.0) License.
By accessing the work you hereby accept the Terms. Non-commercial uses of the work are permitted
without any further permission from Dove Medical Press Limited, provided the work is properly
attributed. For permission for commercial use of this work, please see paragraphs 4.2 and 5 of our Terms.
© 2026 The Author(s). This work is published and licensed by Dove Medical Press Limited. The
full terms of this license are available at https://www.dovepress.com/terms
and incorporate the Creative Commons Attribution
- Non Commercial (unported, 4.0) License.
By accessing the work you hereby accept the Terms. Non-commercial uses of the work are permitted
without any further permission from Dove Medical Press Limited, provided the work is properly
attributed. For permission for commercial use of this work, please see paragraphs 4.2 and 5 of our Terms.