Back to Journals » International Journal of Nanomedicine » Volume 12
Transport and release of colloidal 3-mercaptopropionic acid-coated CdSe–CdS/ZnS core-multishell quantum dots in human umbilical vein endothelial cells
Authors Fontana JM, Yin H, Chen Y ![]() , Florez R
, Florez R ![]() , Brismar H, Fu Y
, Brismar H, Fu Y
Received 5 July 2017
Accepted for publication 9 September 2017
Published 4 December 2017 Volume 2017:12 Pages 8615—8629
DOI https://doi.org/10.2147/IJN.S145608
Checked for plagiarism Yes
Review by Single anonymous peer review
Peer reviewer comments 3
Editor who approved publication: Dr Thomas Webster
Jacopo M Fontana,1 Huijuan Yin,1 Yun Chen,2 Ricardo Florez,1 Hjalmar Brismar,1 Ying Fu1
1Section of Cellular Biophysics, Department of Applied Physics, Royal Institute of Technology, Science for Life Laboratory, Solna, 2Department of Molecular and Clinical Medicine/Clinical Physiology, The Sahlgrenska Academy and University Hospital, University of Gothenburg, Gothenburg, Sweden
Abstract: Colloidal semiconductor quantum dots (QDs) have been extensively researched and developed for biomedical applications, including drug delivery and biosensing assays. Hence, it is pivotal to understand their behavior in terms of intracellular transport and toxicological effects. In this study, we focused on 3-mercaptopropionic acid-coated CdSe-CdS/ZnS core-multishell quantum dots (3MPA-QDs) converted from the as-grown octadecylamine-coated quantum dots (ODA-QDs) and their direct and dynamic interactions with human umbilical vein endothelial cells (HUVECs). Live cell imaging using confocal fluorescence microscopy showed that 3MPA-QDs first attached to and subsequently aggregated on HUVEC plasma membrane ~25 min after QD deposition. The aggregated QDs started being internalized at ~2 h and reached their highest internalization degree at ~24 h. They were released from HUVECs after ~48 h. During the 48 h period, the HUVECs responded normally to external stimulations, grew, proliferated and wound healed without any perceptible apoptosis. Furthermore, 1) 3MPA-QDs were internalized in newly formed LysoTracker-stained early endosomes; 2) adenosine 5'-triphosphate-induced [Ca2+]i modulation caused a transient decrease in the fluorescence of 3MPA-QDs that were attached to the plasma membrane but a transient increase in the internalized 3MPA-QDs; and 3) fluorescence signal modulations of co-stained LysoTracker and QDs induced by the lysosomotropic agent Gly-Phe-β-naphthylamide were spatially co-localized and temporally synchronized. Our findings suggest that 3MPA-QDs converted from ODA-QDs are a potential nontoxic fluorescent probe for future use in clinical applications. Moreover, the photophysical strategy and techniques reported in this work are easily applicable to study of direct interactions between other nanoparticles and live cells; contributing to awareness and implementation of the safe applications of nanoparticles.
Keywords: colloidal semiconductor quantum dots, human umbilical vein endothelial cell, intracellular labeling, nanotoxicity, adenosine 5'-triphosphate, endosome
Introduction
Quantum dots (QDs) are a homogenous group of nanoparticles extensively used and developed for many applications in biology and medicine. QDs, especially colloidal semiconductor QDs, possess peculiar intrinsic fluorescence properties, including high quantum yields, narrow fluorescent spectra, broad absorption and excitation with no photobleaching. These characteristics make QDs an extremely powerful tool for both in vitro and in vivo biomedical applications such as single-particle tracking and delivery and nanotechnology-based carrier systems for traceable drug delivery.1–5
Understanding mechanisms of intracellular transport of QDs is essential in the area of nanotoxicology and drug delivery since it affects the systemic absorption and organ-specific toxicity of nanomaterials.6 Eukaryotic cells are able to take up molecules from extracellular milieu to sustain their lifecycle via mainly two distinct mechanisms: specific internalization that requires the cell to actively transport molecules into the cytoplasm and nonspecific internalization that consists of random processes in which the cell has no active control of the molecules that are internalized either directly or due to their lipid solubility.7 Specific uptake mechanisms usually facilitate the entrance of specific molecules through receptor-mediated endocytosis and have been extensively studied for their potential utilization in targeted drug delivery.8–11 Nonspecific cellular uptake involves continual budding of vesicles from the cell membrane, allowing extracellular material to be internalized. The latter can depend on the cell type and is not selective. In both mechanisms, the material internalized is trafficked in vesicles along the microtubules to the sorting endosomal compartment where it can either end in the lysosomes for acidic degradation or be moved back out of the cell.12–15
Endothelium is a key regulator of vascular homeostasis in that it has not just a barrier function capable to internalize and deliver various molecules to different intracellular locations or regulate their transendothelial transport to the arterial intima but also produces different molecules for regulating and modifying the vessel wall function.16,17 Uptake of toxic agents like viruses or bacteria can lead to cellular dysfunction; therefore, nanomaterial-induced alterations in endothelium may have serious consequences on vascular function. As one of the well-characterized vascular endothelial cells, human umbilical vein endothelial cells (HUVECs) express the typical endothelial phenotype and are often used in studying nanomaterial toxicity.18–21
In this article, we investigated 3-mercaptopropionic acid-coated CdSe-CdS/ZnS core-multishell quantum dots (3MPA-QDs) obtained by surface ligand exchange of as-grown octadecylamine-coated quantum dots (ODA-QDs)22–24 and exploited their transport, release and photophysical properties in HUVECs. We found that the variation of QD optical properties could be used as a fingerprint to accurately discriminate their spatial locations in intracellular compartments. Our study clearly demonstrated that the 3MPA-QDs could be transported through HUVECs without inducing apoptosis and affecting cell growth and proliferation.
Our aim was to delineate possible strategies for safe nanoparticles and their nanomedical applications in cellular systems. Here, we focused on one specific type of QDs and one cell type, but our approach can be used to study the direct interactions between other type of nanoparticles with different characteristics such as size, charge and surface coating and different cell types.
Materials and methods
3MPA-QDs
Aqueous solution of 3MPA-QDs (5 μM) was synthesized in house as previously described.22–24 Since material properties of colloidal QDs are strongly related to QD’s synthesis method, we described first the synthesis of our 3MPA-QDs consisting of three major steps. 1) The first step was to synthesize CdSe cores. A mixture of CdO (13 mg, 0.1 mmol), tetradecylphosphonic acid (TDPA; 56 mg, 0.2 mmol), octadecylamine (ODA; 0.35 g, 1.3 mmol) and trioctylphosphine oxide (TOPO; 0.65 g, 1.7 mmol) was put into a 50 mL three-neck flask that was vacuumed for 30 min at 100°C. The mixture was then heated to 330°C under nitrogen flow to get a clear solution. At this moment, CdO was dissolved in organic solvent. After that the reaction mixture was cooled to 260°C, and 0.15 mmol Se dissolved in trioctylphosphine (TOP; Se-TOP) was injected quickly (<1 s) into the reaction mixture to allow the growth of CdSe cores. After the desired core size was reached (estimation under a UV lamp), the heat supply was turned off. When the solution was cooled to ~100°C, acetone was added, and the solution was transferred to a glass vial and centrifuged for 6 min at 60°C, the supernatant was extracted, chloroform was added to disperse the pellet and acetone was added and centrifuged for 3 min at room temperature, resulting in the CdSe cores, as the pellet at the bottom of the glass vial. They were oil soluble and coated by ODA, TDPA, TOPO and TOP. 2) To add shells to the CdSe cores, ODA (1 g, 4 mmol) and 1-octadecene (ODE; 4 mL, 12.5 mmol) were put into the 50 mL three-neck flask. The mixture was heated to 100°C and vacuumed for 30 min to remove possible impurities in the chemicals. CdSe cores synthesized earlier were dissolved in chloroform and injected quickly into the reaction solution. After that the solution was vacuumed for another 30 min to remove the chloroform. The mixture was heated to and kept at 230°C under nitrogen flow. Cd, S and Zn precursors were injected into the reaction mixture, sequentially, to allow the growth of the shell layer by layer. The Cd and Zn precursors were prepared by dissolving CdO or ZnO in oleic acid (OA) and ODE. The S precursor was prepared by dissolving sulfur in ODE. Each precursor injection was very quick (<1 s), and the time interval between two subsequent injections was ~8–10 min. After the desired core/shell QDs were obtained, the heat supply was turned off. When the mixture was cooled to 100°C, the QDs were precipitated with acetone and washed with chloroform and acetone twice. The resulting core–shell QDs were ODA coated and oil soluble. 3) To make the QDs water dispersible, ODA-QDs were dissolved in chloroform and mixed with an equal volume of water containing 3-mercaptopropionic acid (3MPA; 1 M). The mixture was under vigorous stirring for 2 h. During this time, the surface ligand exchange was carried out and the QDs moved from the chloroform to the water. Then, the QD water solution was extracted to an Eppendorf tube and centrifuged for 3 min, the supernatant was removed and 0.1 M NaHCO3 water solution was added until the pellets (QDs) were redispersed in the solution. Having added acetone and centrifuged for 3 min, the resulting pellets (QDs) were carboxyl coated and dispersed in water.
The 3MPA-QDs studied in the work had a fluorescence peak at 578 nm at room temperature, consisting of a CdSe core, a CdS shell of two monolayers and another shell of 1.5 monolayer ZnS. The total diameter of the QDs was 5.7 nm excluding 3MPA surface ligands characterized by high-resolution transmission electron microscopy (TEM). A typical micrograph of TEM of our 3MPA-QDs is shown in Figure 1.
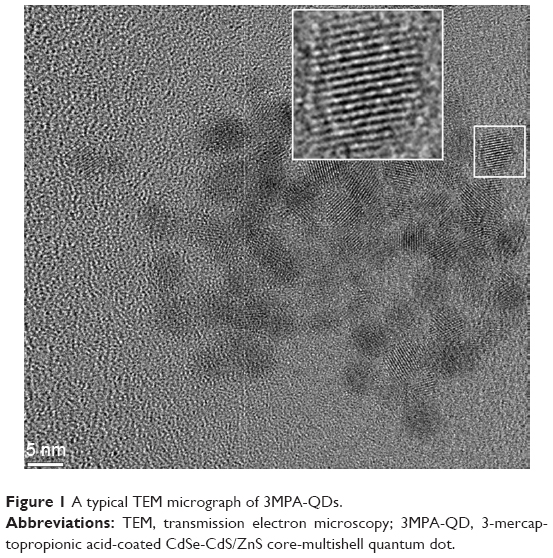 | Figure 1 A typical TEM micrograph of 3MPA-QDs. |
It is of importance to mention two profound aspects about these 3MPA-QDs. 1) Coated with ODA, they were initially synthesized in an oily solution and then transferred to the aqueous solution by 3MPA surface ligand exchange, so there were no growth precursor residuals in the final aqueous solution. 2) The acid dissociation of 3MPA molecules on 3MPA-QDs was shown to be ~6.5.25 Compared with 4.34 for free 3MPA, this implies a very strong binding between 3MPA molecules and the ZnS shell of the QDs, resulting in the reported great photostability.24
Reagents
Oregon Green BAPTA-1, AM (OGB-1) (O6807), LysoTracker Deep Red (L12492) and NucBlue Live Cell Stain ReadyProbes Reagent (R37605) were purchased from Thermo Fisher Scientific (Waltham, MA, USA). Pluronic F-127 (P2443), adenosine 5′-triphosphate (ATP) disodium salt hydrate (A2383) and Annexin V-FITC Apoptosis Detection Kit were purchased from Sigma-Aldrich Co. (St Louis, MO, USA). Gly-Phe-β-naphthylamide (GPN) was purchased from Santa Cruz Biotechnology Inc. (sc-252858; Dallas, TX, USA).
OGB-1 (50 μg/vial) was dissolved in 10 μL Pluronic F-127 (20% w/v) to obtain a 4 mM stock solution. In all, 1.5 μL OGB-1 stock solution was added to a 35 mm dish containing 1.5 mL growth medium (OGB-1 4 μM working solution) for 1 h incubation (standard cell culture conditions 37°C, 5% CO2, humidity 90%). LysoTracker solution 1 μL (1 mM) was added to 20 mL growth medium to obtain 50 nM working solution. Cells were incubated with 1.5 mL of 50 nM LysoTracker working solution for 1 h. ATP 100 mM solution was prepared fresh by dissolving 55.1 mg ATP powder into 1 mL deionized H2O. GPN solution of 200 mM was freshly prepared for each experiment by dissolving in dimethyl sulfoxide (DMSO). GPN stock solution (1.5 μL) was added to cells in 35 mm cell culture dishes containing 1.5 mL growth medium (working concentration 200 μM). Annexin V-FITC Apoptosis Detection Kit consisted of 1 mL 10× binding buffer added to deionized H2O, resulting in 1× binding buffer. Cell medium was replaced by 500 μL 1× binding buffer and then added with 5 μL Annexin V-FITC solution and 10 μL propidium iodide (PI) solution to cell culture incubated for 10 min at room temperature, washed and imaged. Two drops of NucBlue Live Cell Stain ReadyProbes were added to cell culture, incubated for 20 min, washed and then imaged.
Cell culture
HUVECs (C2517A; Lonza, Cologne, Germany) were cultured in 35 mm petri dishes with glass bottom in 15 mL endothelial growth medium-2 (EGM-2; Lonza) containing endothelial cell basal medium-2 (EBM-2; Lonza), 5% fetal bovine serum (FBS), 1% penicillin/streptomycin/glutamine (Thermo Fisher Scientific) and 0.25 μg/mL Gibco amphotericin B (Thermo Fisher Scientific). To track single cells during incubation with QDs, we also used 35-mm μ-Dish Glass Bottom Grid-50 (ibdi GmbH, Planegg/Martinsried, Germany).
HUVECs cultured in 35 mm dishes (1.5 mL cell culture medium) were exposed to 20 μL 3MPA-QDs (5 μM). Extracellular QDs were removed by rinsing cells three times with EGM-2. QD–HUVEC interactions, cell membrane attachment and internalization were explored by fluorescence microscopy with the acquisition of a z-series of confocal sections at certain time interval. The final concentration of 3MPA-QDs in the HUVEC culture was 62 nM, which was used throughout all experiments presented in this article.
[Ca2+]i measurement
HUVECs cultured in glass bottom petri dishes were loaded with OGB-1 in FBS-free EBM-2 for 30 min at 37°C. Afterward, the cells were rinsed three times with EGM-2, refilled with EGM-2 and then placed in a stage-top incubator for live imaging. [Ca2+]i was assessed by the fluorescence of OGB-1 using LSM 780 confocal microscope (Carl Zeiss Meditec AG, Jena, Germany). The excitation wavelength was 488 nm, and bandpass filter 490–545 nm was used to collect emission signals from OGB-1.
In vitro wound healing
HUVEC monolayers on glass bottom petri dishes were mechanically wounded with a sterile 1,000 μL pipette tip; cells were then washed and maintained in the growth medium.40 Wound healing process was visualized using LSM 780 confocal microscope with Plan-Apochromat 10×/0.45 M27 objective.
Imaging and imaging processing
Temporal distribution of QDs applied on HUVECs was studied by confocal and bright-field images of the glass bottom dish placed directly on a microscope sample-stage incubator using Zeiss LSM 780 confocal microscope with either Plan-Apochromat 10×/0.45 M27, Plan-Apochromat 20×/0.8 or Plan-Apochromat 63×/1.4 Oil DIC M27 objective. QD fluorescence was excited by laser light at 405 nm, and bandpass filter 560–620 nm was used to collect QD fluorescence signals. Tagged image file format (TIFF) micrographs were exported from ZEN original image files using software ZEN 2012 (Carl Zeiss Meditec AG) without compression and analyzed offline using MATLAB.
Results
Membrane attachment, internalization and release of QDs
As shown in Figure 2A–I, QDs started to appear on the cell surface 5 min after QD deposition and then aggregated after ~20–25 min. The temporal fluorescent intensity of these QDs gradually increased along with the incubation time due to the continuous QD sedimentation from the medium to the cell surface. Similar temporal sequences had been observed in repeated experiments, and the QD–cell membrane attachment has been confirmed by simultaneous detection of the autofluorescent signal from the cell membrane where the QD aggregates attached to; see Figure 2J for the fluorescence spectra of QD aggregates obtained using lambda-mode scan.
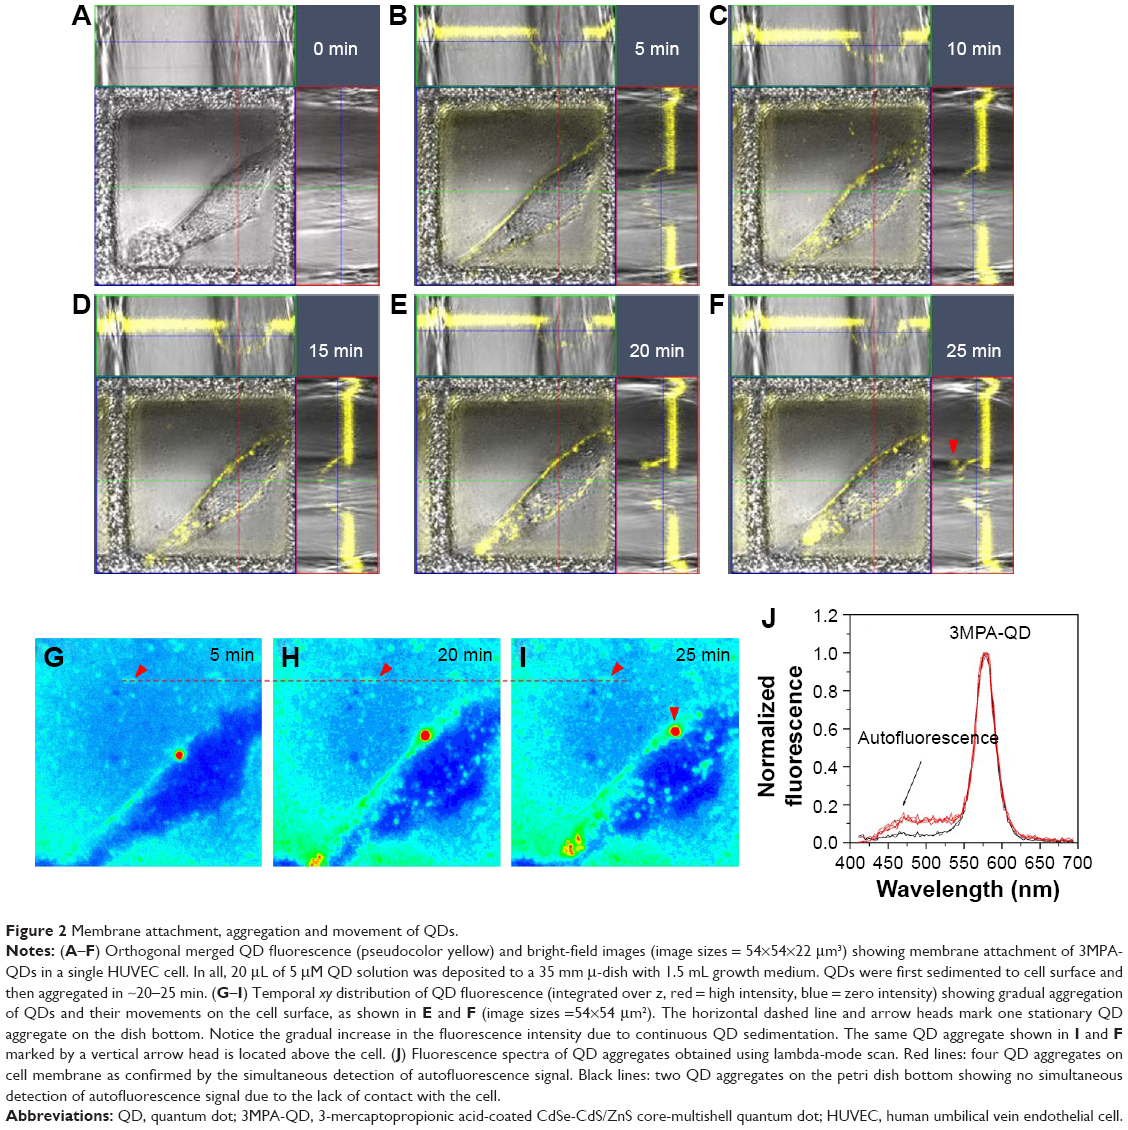 | Figure 2 Membrane attachment, aggregation and movement of QDs. |
After 1 h, the same HUVECs previously exposed to QDs were rinsed with fresh cell culture medium and further imaged. Confocal images acquired once per hour up to 6 h clearly show that QD aggregates started to be internalized at ~2 h. Subsequently, HUVECs were put back in the incubator and imaged 24 and 48 h after the initial QD deposition. In general, quite a few QD aggregates were found inside the cells at 24 h, and the number of QD aggregates decreased drastically at 48 h. Unfortunately, cell migration and proliferation in the culture dish after 24 and 48 h incubation made it impossible to track down single cells, even using the gridded dishes. Moreover, the grids of the μ-dish complicated the analysis of the overall QD distribution in cells since QD concentrations in the grids were rather high (Figure 2). To avoid this, we repeated the 24 and 48 h experiments using standard 35 mm glass bottom dishes. HUVECs were incubated with QDs for 1 h, rinsed and returned to the incubator. As shown in Figure 3A–D, internalized QD aggregates were observed in the majority of the cells 24 h after QD deposition, while 48 h later, QDs were found only in a limited number of cells at a much low average density per cell. Note the larger observation area in Figure 3C (708×708 μm2) than in Figure 3A (425×425 μm2). This result clearly demonstrates that 3MPA-QDs were internalized by HUVECs starting ~2 h after QD deposition and remained inside the cells after 24 h (Figure 3B); after 48 h, 3MPA-QDs were transported out of the cells (Figure 3D). In addition, the internalized QDs were found in many paired cells at 24 h, presumably daughter cells upon cell divisions, indicating that they were divided along cell proliferation, as previously reported.26
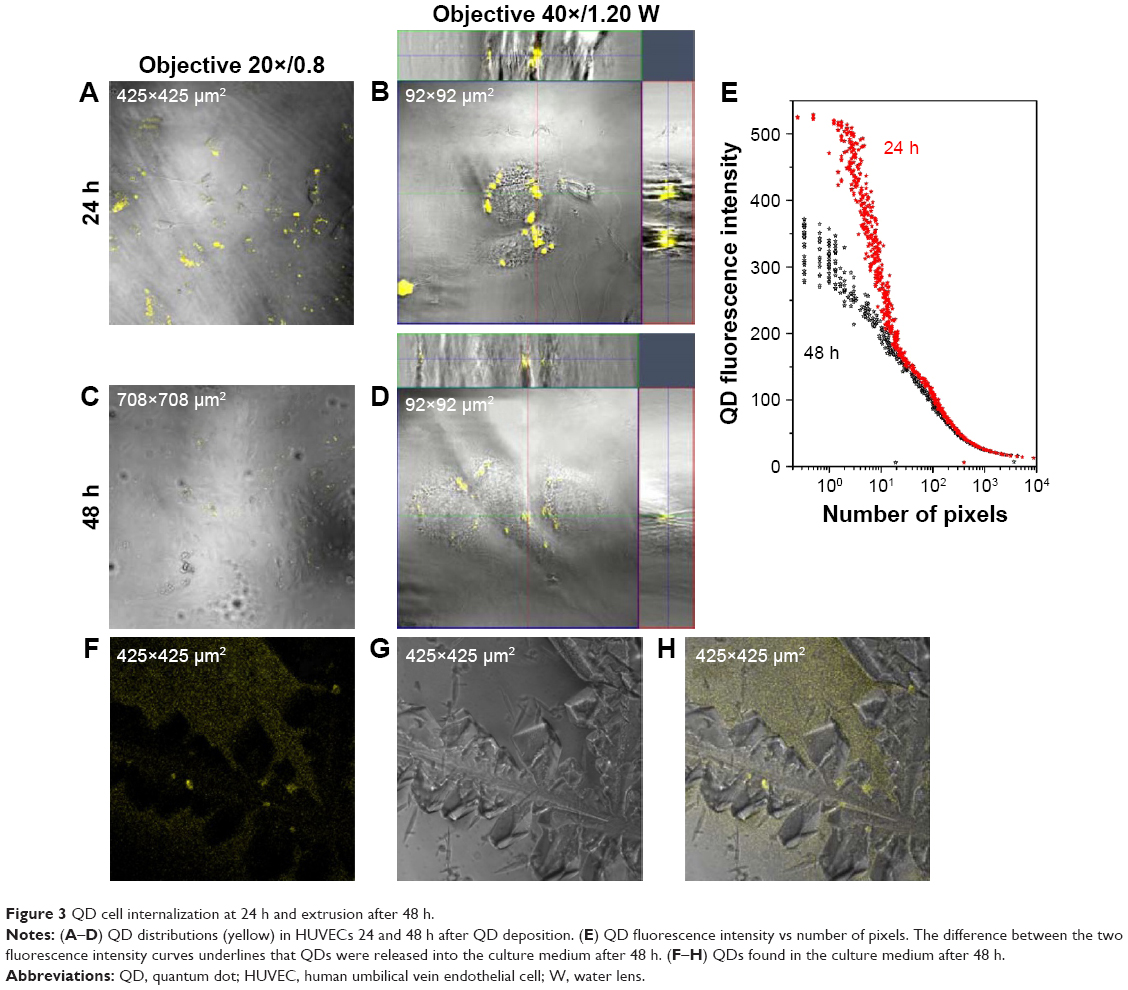 | Figure 3 QD cell internalization at 24 h and extrusion after 48 h. |
For quantitative assessments, we took confocal z-stack images of two xy locations at 24 h (Figure 3A) – each 1,024×1,024 pixels, 425×425 μm2, δz =0.2 μm and total 67 cells so that the cell density was 186 cells/mm2 – and three xy locations at 48 h (Figure 3C) – each 1,024×1,024 pixels, 708×708 μm2, δz =0.2 μm and total 650 cells so that the cell density was 432 cells/mm2. We covered large xy areas for the 48 h sample since the QD signals were much weak. QD fluorescence signal was first integrated over the z-axis to obtain a two-dimensional xy distribution, and the number of pixels having certain QD fluorescence intensity was counted. The relationship between the average number of pixels and QD fluorescence intensity shows that the numbers of pixels with high QD fluorescence intensities were larger at 24 h compared to 48 h (Figure 3E). Note that the tails of the two curves at high pixel number/low fluorescence intensity region (background noise) were identical, implying that the two data sets were comparable quantitatively. The difference between the two curves represents those QDs that were released from the cells into the culture medium. Note that the cell density of the areas included in the analysis shown in Figure 3E was twofold higher at 48 h than at 24 h; yet, the QD fluorescence intensity was much lower at 48 h than at 24 h.
To detect QDs released from the cells after 48 h, the culture medium was collected and then centrifuged at 1,500 rpm for 5 min to remove cell debris. The supernatant was placed in a new 35 mm glass bottom petri dish and then left in a standard incubator for drying, slightly tilted so that the eventual QDs in the solution were more concentrated at the low edge of the dish. Confocal microscopic images of the dried petri dish confirmed the presence of QDs in the culture medium after 48 h (Figure 3F–H). Note that the cells were incubated with QDs for 1 h, and afterward, the cells were washed and incubated in the new culture medium without QDs. Thus, QDs detected in the culture medium at 48 h were released from the cells.
3MPA-QDs had no effect on apoptosis and in vitro wound healing
Since certain nanoparticles were reported to be cytotoxic and to trigger apoptotic cell death, we hereby proceeded to measure apoptosis that may be caused by our 3MPA-QDs. The apoptosis analysis was performed twice on two separate HUVEC batches using Annexin V-FITC Apoptosis Detection Kit. We used a confocal microscope rather than flow cytometry to measure the apoptosis of HUVECs treated with 3MPA-QDs because fluorescence signal of PI (late apoptosis) has a significant overlap with that of 3MPA-QDs, which could produce false-positive results when using flow cytometry. Only a few sporadically distributed cells displayed clear apoptosis in both the control and QD-treated HUVEC cells (Figure 4A–D). Moreover, we saw a quite broad nuclear size range and a high cell density at 48 h (Figure 4D). There are 152 cells in Figure 4C and 362 cells in Figure 4D, corresponding to cell densities of 105 and 250 cells/mm2, respectively (see similar results in Figure 3). This indicates that cells were continuously growing and proliferating normally in the presence of 3MPA-QDs.
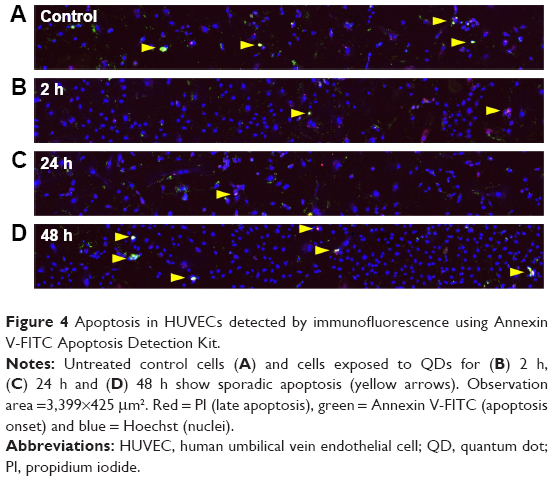 | Figure 4 Apoptosis in HUVECs detected by immunofluorescence using Annexin V-FITC Apoptosis Detection Kit. |
Wound healing experiments were performed twice on two separate HUVEC batches. Figure 5A and B shows representative micrographs (image size =850×850 μm2) of cell distributions direct and 7.5 h, respectively, after the mechanical scratch. A total of eight to 10 micrographs along the scratch were acquired depending on the length of the scratch. The wound healing process was monitored at a time interval of 1.25 h. Similar data were obtained from the 3MPA-QD-treated HUVECs. To numerically quantify the wound healing process, each micrograph was divided into 20 sections along the x-axis, and the cells in each section were counted. The average cell number vs the x-section index relationships for the control and 3MPA-QD-treated HUVECs are presented in Figure 5C and D, where no perceptible modulation in the wound healing process was observed in response to the 3MPA-QD internalization.
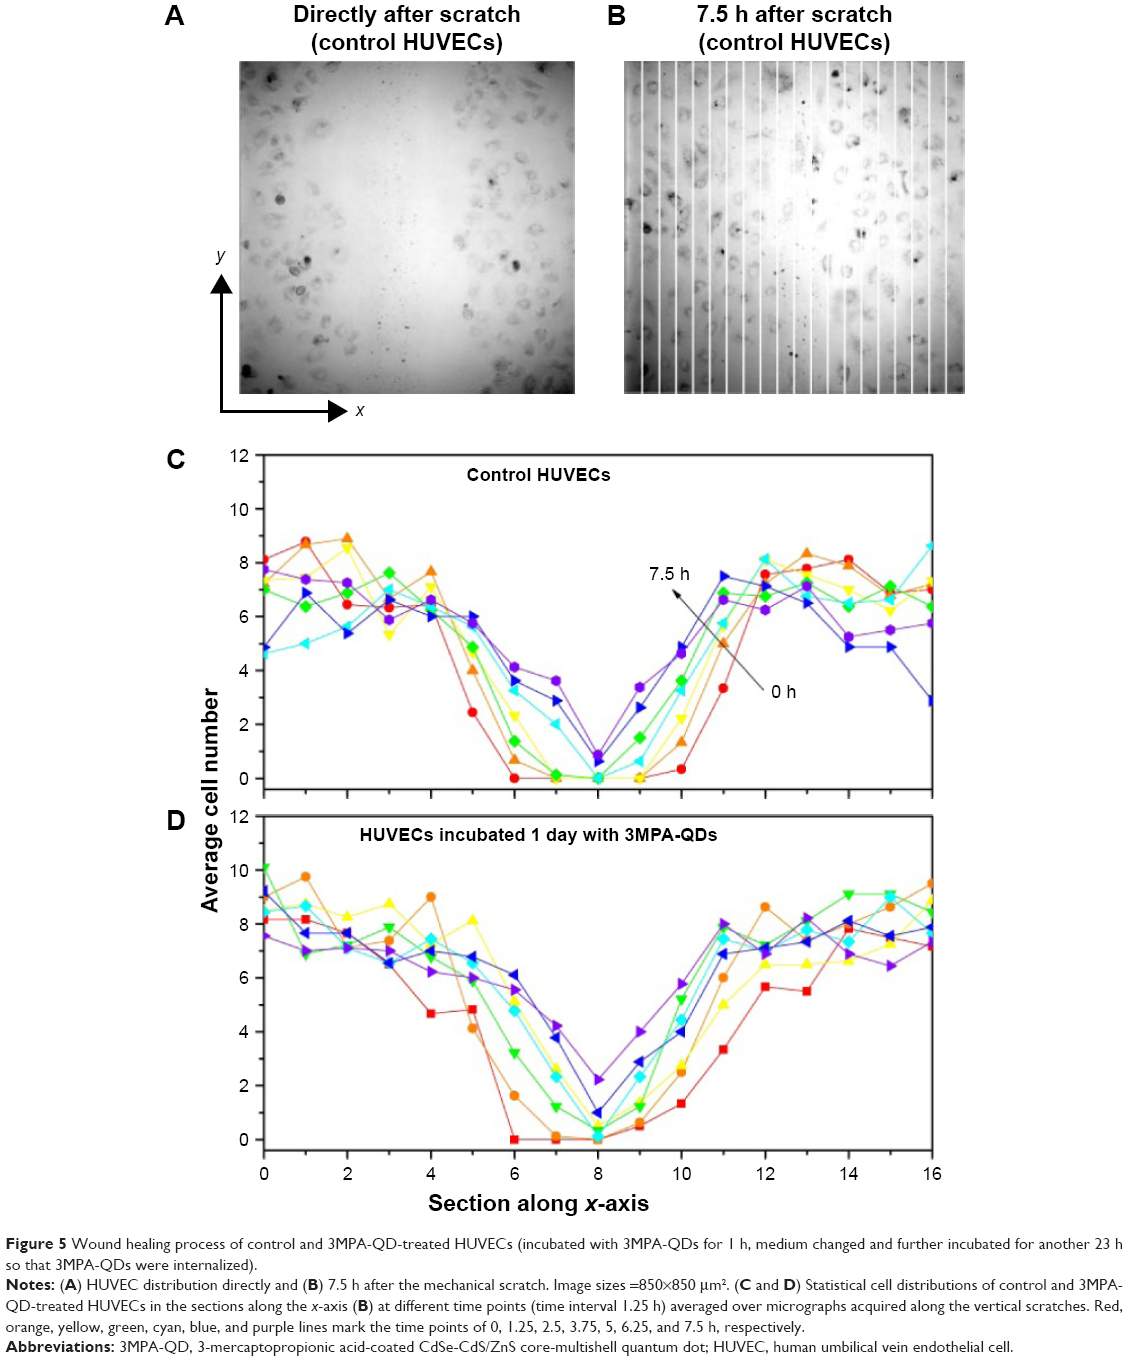 | Figure 5 Wound healing process of control and 3MPA-QD-treated HUVECs (incubated with 3MPA-QDs for 1 h, medium changed and further incubated for another 23 h so that 3MPA-QDs were internalized). |
ATP stimulation modulates QD and OGB-1 fluorescence intensities and confirms cells’ ability to response homogenously to a humoral stimulus
To identify the spatial locations of internalized QDs and examine whether QD internalization affects the physiological functions of HUVEC, HUVECs were loaded with Ca2+ indicator OGB-1 and stimulated with ATP. OGB-1 is a small molecule with a high selectivity to bind Ca2+. Cells can be loaded with OGB-1 by adding it directly to dishes containing cultured cells. OGB-1 exhibits an increase (~14-fold) in its fluorescence upon binding Ca2+. Intracellular Ca2+ concentration [Ca2+]i plays a key role in a variety of cellular functions and is a master indicator of health status of the cells. ATP is an agonist of purinergic receptors commonly used as a positive control of Ca2+ response. The idea of loading HUVECs with OGB-1 and then stimulating them with ATP was to study cells’ ability to respond to a humoral stimulus, therefore unraveling the health status of cells.
Figure 6A shows that HUVECs not exposed to QDs displayed, as expected, an increase in [Ca2+]i followed by [Ca2+]i oscillations after ATP administration.27 HUVECs were incubated with QDs and OGB-1 for 1 h and, after medium replacement, were stimulated twice with ATP, and fluorescent signals from OGB-1 and QDs were detected simultaneously. Figure 6B and C shows that upon ATP stimulation, there was a clear transient increase in OGB-1 fluorescence in all cells, similar to the control cells, accompanied by a synchronic transient decrease in the QD fluorescence. In our previous study, we showed that QD fluorescence was decreased when the Ca2+ concentration around QDs was increased.28 This suggests that QDs were indeed clustered on the plasma membrane after 1 h incubation with HUVECs since their fluorescence was reduced after ATP-induced Ca2+ flux across the plasma membrane.
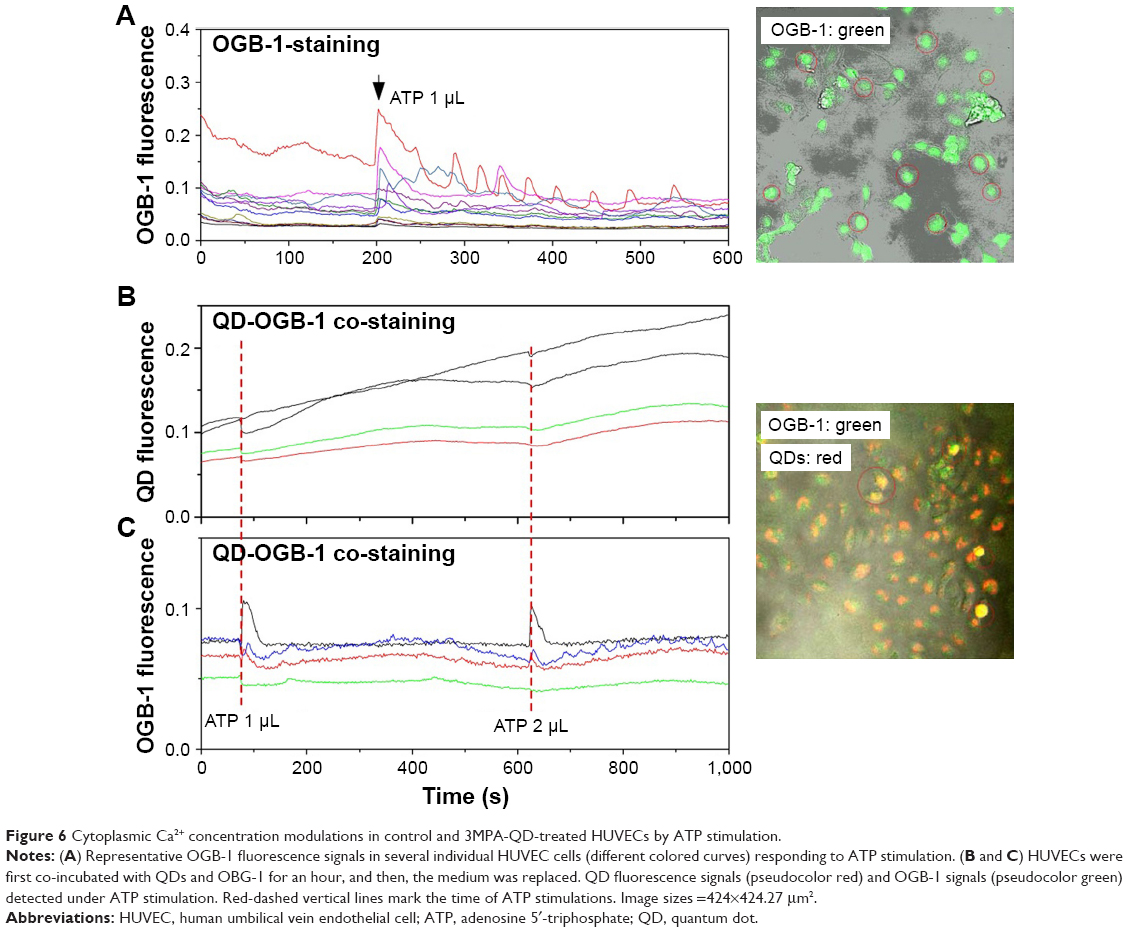 | Figure 6 Cytoplasmic Ca2+ concentration modulations in control and 3MPA-QD-treated HUVECs by ATP stimulation. |
In a separate experiment, four HUVECs samples were incubated with QDs for 1 h and then the culture medium was replaced after rinsing the cells. The QD fluorescence of two samples (1 h) was studied directly after water or ATP administration, while the other two samples were investigated 24 h later. As shown in Figure 7A, at 24 h, the total QD fluorescence intensity modulation in QD-exposed HUVECs was reverted compared with the 1 h sample. In HUVECs QD exposed for 1 h, the majority of QDs was attached to the plasma membrane and sensed the increase in Ca2+, which reduced their fluorescence. However, at 24 h, the majority of QDs were internalized. The increased QD fluorescence signals upon ATP stimulation indicated that QDs must be internalized in specific cellular compartments that released Ca2+ under ATP stimulation, such as endoplasmic reticulum (ER), mitochondria, endosomes or lysosomes. The number of pixels vs QD fluorescence intensity in Figure 7B and C shows even more clearly the opposite responses of QDs to ATP stimulations at 1 and 24 h, respectively. As a control, water did not induce any relevant QD fluorescence modulation (the transient decrease in the 1 h water sample was due to the focus shift prior to the water deposition).
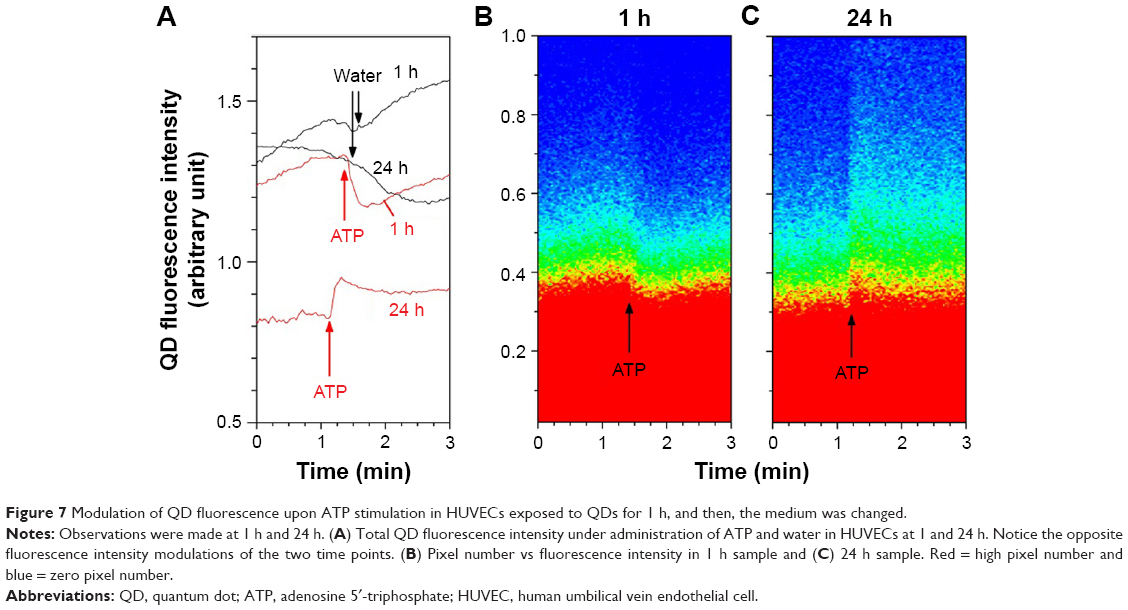 | Figure 7 Modulation of QD fluorescence upon ATP stimulation in HUVECs exposed to QDs for 1 h, and then, the medium was changed. |
The fact that QD-treated HUVECs responded normally to ATP administration suggests that QD treatment did not induce clear cellular dysfunction (refer more in the following).
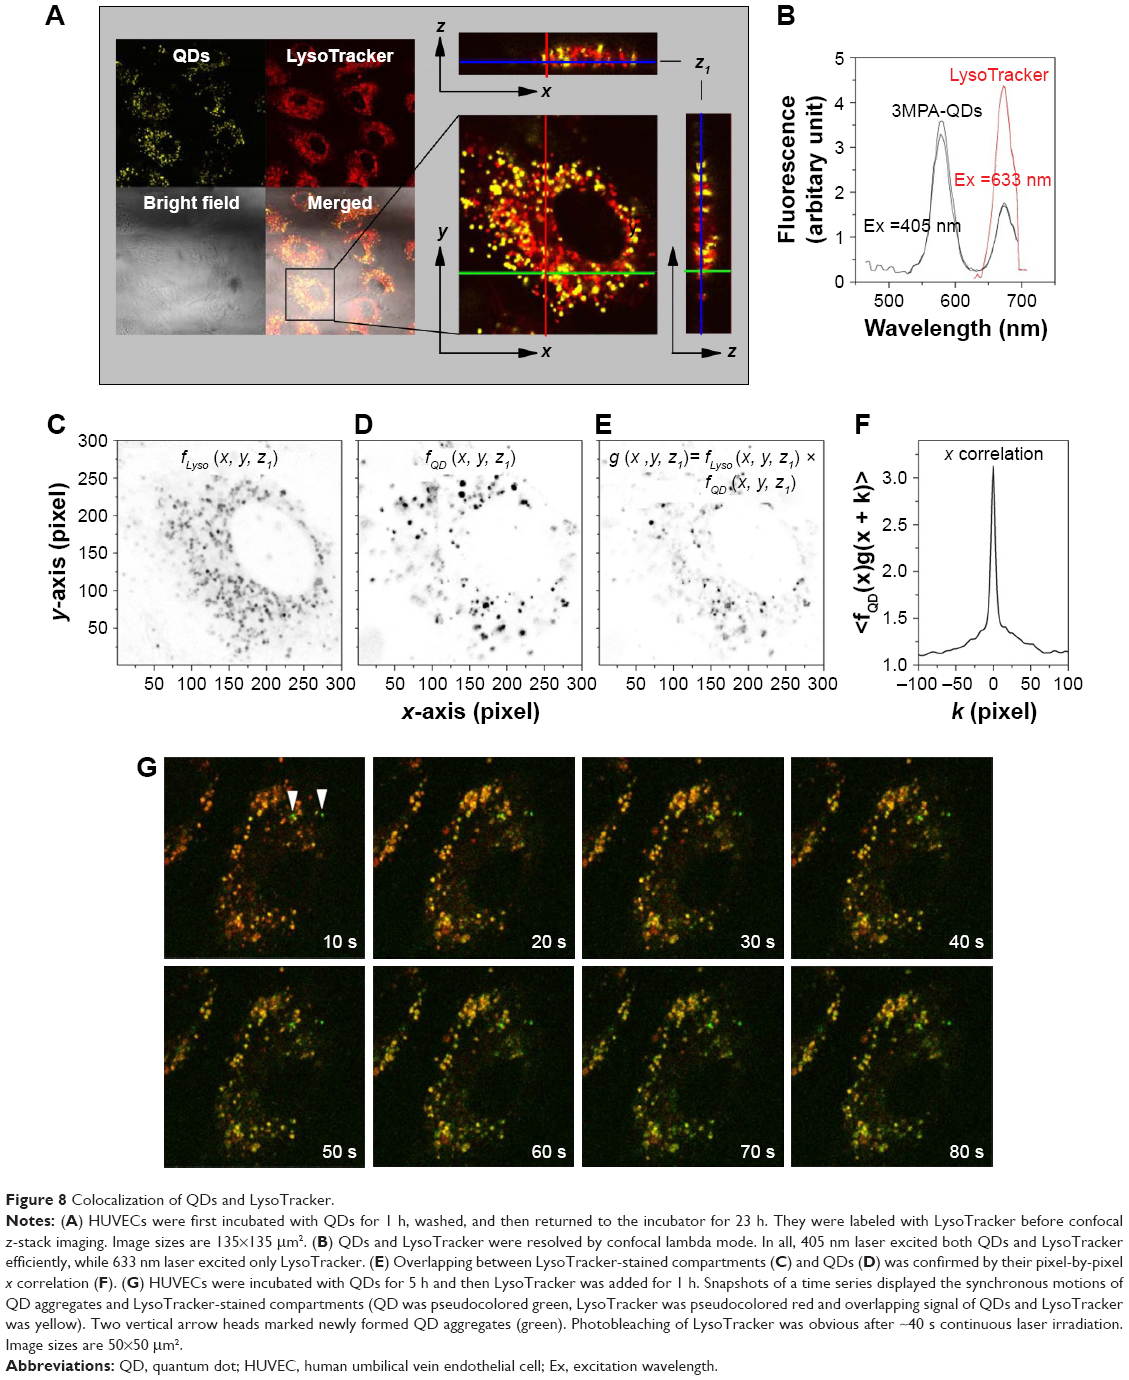
Internalized 3MPA-QDs were localized within endosomes
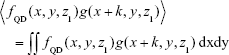
Previous articles reported QD internalization in endosomal/lysosomal compartments in endothelial progenitor cells using TEM;26 therefore, our next experiment was to specifically label the endosomes/lysosomes of the cells using LysoTracker Deep Red, a fluorescent weak base that accumulates in acidic organelles. We noticed that both QD- and LysoTracker-stained compartments were moving during live cell imaging. To assess quantitatively their co-localization, we performed a simultaneous confocal recording of two channels, one for QDs (filter 553–612 nm, pseudocolor yellow) and one for LysoTracker (filter 642–695 nm, pseudocolor red). Representative z-stack micrographs showed that both QDs and LysoTracker co-localized in the intracellular space (Figure 8A). Colocalization of QDs and LysoTracker was further resolved by using confocal spectral lambda mode imaging, which showed that signals from QDs and LysoTracker were detected simultaneously (Figure 8B). As shown in Figure 8A, not all LysoTracker-loaded compartments were occupied by QDs. One important fact was that fluorescence of QDs was much higher than that of LysoTracker when exited at the same wavelength and same power (they were recorded in the same track of laser configuration). To tackle this, we analyzed the images quantitatively: TIFF micrographs were exported from ZEN original image files using software ZEN 2012 and then analyzed using MATLAB imread and im2double functions to obtain the spatial distributions of the two signals, fLyso (x, y, z1) in Figure 8C, where z1 is defined in Figure 8A, and fQD (x, y, z1) in Figure 8D. Their overlapping
|

 | Figure 8 Colocalization of QDs and LysoTracker. |
was calculated and is shown in Figure 8E, displaying a close similarity between Figure 8D and E, which was further quantified by their x correlation defined as
|
shown in Figure 8F, where the full width at the half maximum is only 5 pixels, approximately the size of the QD aggregates in Figure 8D. Similar results were obtained for other z positions and y correlation.
For better visualization, a time series of snapshots of QD aggregates and LysoTracker-stained compartments is shown in Figure 8G. Here, the HUVECs were first incubated with QDs for 5 h and then LysoTracker was added and not washed afterward to show the continuous formation of QD aggregates and LysoTracker staining. Fluorescent signals from QDs and LysoTracker were shown to move synchronically. Note that in early study (eg, refer Figure 2), QDs were aggregated and started to become internalized at ~1 h incubation time. At this time, QD aggregates located mostly just beneath the cell membrane. After ~5 h, QD-loaded intracellular compartments were observed to diffuse deep in the cytosol revolved clearly by the z-stack imaging mode.
To further probe the relationship between LysoTracker-stained compartments and QDs, we added the lysosomotropic agent GPN to QD-treated HUVECs (incubated with QDs for 1 h, washed and then returned to the incubator for 23 h). GPN is known to permeabilize endosomes/lysosomes and thereafter induce Ca2+ release and oscillations.29,30 To quantify endosomal/lysosomal Ca2+ content, we monitored cytosolic [Ca2+]i in response to acute GPN addition to QD-treated HUVECs loaded with OGB-1. As expected, the addition of GPN resulted in a prompt increase in QD fluorescence followed by oscillations, most probably due to the release of Ca2+ from endosomes/lysosomes (Figure 9A). Indeed, GPN deposition evoked a long-lasting increased [Ca2+]i signal that persisted up to 10 min and was synchronized with the QD fluorescence modulation (Figure 9B). Parallel measurements of LysoTracker and QD fluorescence confirmed that GPN abolished LysoTracker fluorescence and increased QD fluorescence within 5 min of addition (Figure 9C). These results confirmed that a majority of internalized QDs were located in endosomes/lysosomes.
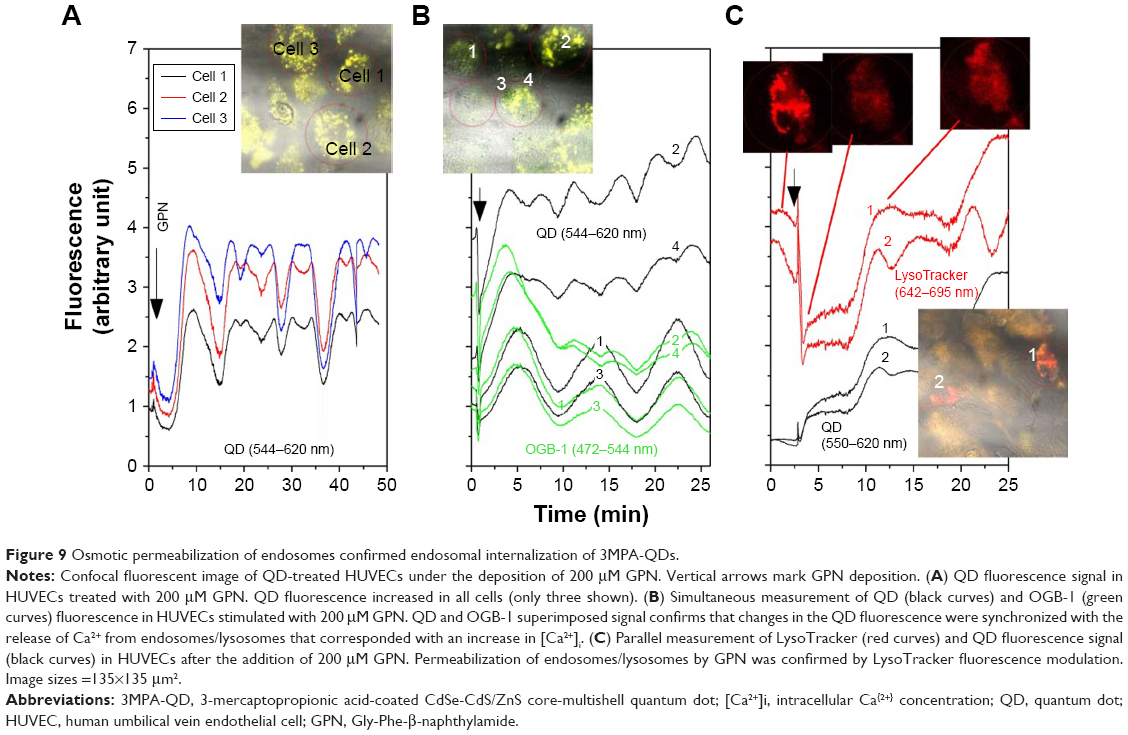 | Figure 9 Osmotic permeabilization of endosomes confirmed endosomal internalization of 3MPA-QDs. |
To resolve the internalization mechanism of QDs and to discriminate between endosomes and lysosomes, we worked on two strategies. The first was co-staining QDs and LysoTracker at the same time. The second was to first stain with LysoTracker and rinse the cells so that only the preexisting endosomes/lysosomes, but not the newly formed ones, were stained before QD deposition. As shown in Figure 10A and C, QDs first aggregated on the cell surfaces at 19 min in both samples (green signals marked by blue arrows). At 40 min, one of the two QD aggregates in the QD/LysoTracker co-stained sample started to become yellow and internalized and the other lowered its z position (red horizontal arrow) but remained largely green (Figure 10A and B), meaning that it was still aggregated on the cell surface. In the LysoTracker-prestained sample, the QD aggregate remained green, implicating that it did not merge with the preexisting LysoTracker fluorescence as shown in Figure 10C and D where the QD aggregates located in the culture dish bottom are marked by white arrows. HUVECs in Figure 10A and B appeared more red than in Figure 10C and D since free LysoTracker was washed off.
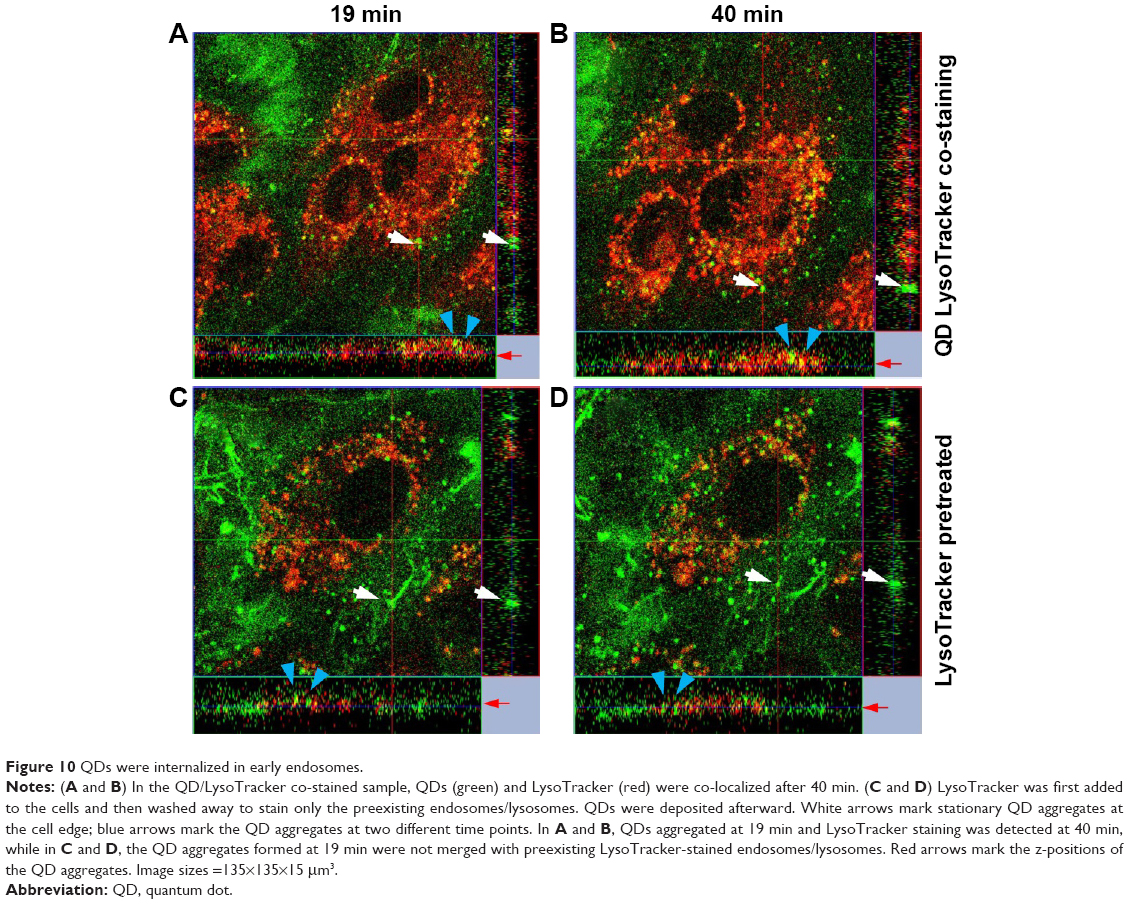 | Figure 10 QDs were internalized in early endosomes. |
To assess the underlying mechanism involved in QD internalization, the cellular uptake of QDs at 4°C was examined for 2 h by confocal microscopy using z stake and time-series mode. As shown in Figure 11, at low temperature, HUVECs did not take up 3MPA-QDs. Time sequences of confocal images showed that the QDs distributed around the cell and on the cell surface and that this pattern of distribution did not change during the 2 h of observation, suggesting that QD internalization observed under 37°C occurred via active transport such as endocytosis rather than passive diffusion. QD fluorescence around the cell was gradually diminished (thus the brightness and contrast of the fluorescence confocal images were gradually increased for allowing their visualization) due to a gradual dispersion of QDs into the culture medium after initial sedimentation due to gravity. The experiment lasted for 2 h, but already after 1.5 h, the QD fluorescence signal was very weak.
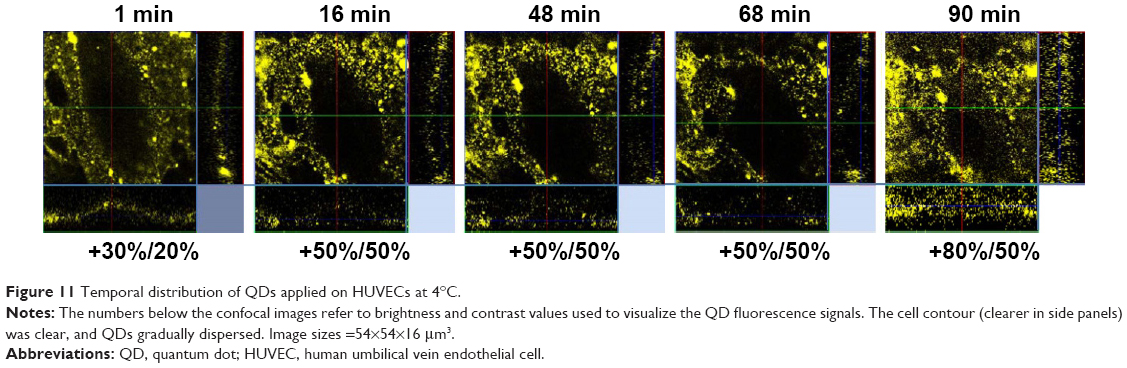 | Figure 11 Temporal distribution of QDs applied on HUVECs at 4°C. |
Discussion
To investigate the intracellular behaviors of the 3MPA-QDs, we have examined their uptake mechanism, transport and localization in HUVECs using confocal fluorescent microscopy. Dynamic confocal imaging showed that the 3MPA-QDs were attached to the cell membrane after QD administration (~5 min) and then aggregated (20 min) on the cell membrane. The QD aggregates started to be internalized (~2 h) and accumulated mainly in the endosomes before being transported out of the cells after 48 h. The aggregation and internalization of 3MPA-QDs did not occur in HUVECs at 4°C, suggesting that the internalization of QDs at 37°C occurred through active transportation processes. Furthermore, QD internalization did not cause any obvious cellular injury, and this is in line with previous studies that investigated a wide range of nanoparticles.31–33 Our data suggest that this specific type of nanoparticles, the 3MPA-QDs, can be safely utilized as agents for intracellular tracking, biomedical imaging, drug delivery and diagnosis.
The first important finding is that 3MPA-QDs became internalized by HUVECs in an active way starting after 2 h incubation with 3MPA-QDs, but strikingly, they were released from the cells after 48 h. The cellular uptake/release, the lack of cytotoxicity and previously reported unaffected cell proliferation24 can be attributed to the unique surface chemistry of the 3MPA-QDs. Usually, nanoparticles that enter the cell through endocytosis are delivered to the lysosomes34,35 where they can be degraded by lysosomal lytic enzymes.36–38 This, however, did not apply to our 3MPA-QDs since our results clearly show that the 3MPA-QDs were internalized and then released after 48 h. One may argue that the lack of intracellular QD fluorescence might be due to the low pH-induced degradation of 3MPA-QDs in the lysosomes. This is unlikely the case since our 3MPA-QDs were shown to fluoresce after 5 days in a solution with pH 3.5.25 Moreover, Figure 3F–H shows that QD signals were detected in the media after 48 h, suggesting that QDs were internalized in early endosomes and released after 48 h without reaching the lysosomes. This might explain the fact that no cytotoxicity or apoptosis was detected in the cells treated with 3MPA-QDs. Since our 3MPA-QDs did not reach the lysosomes, there was little chance that QDs could be degraded to release cytotoxic substances such as Cd2+. It is interesting to point out that it was reported before that 3MPA-QDs did not co-localize with the ER,39 explaining the absence of cellular stress known to be triggered by certain QDs sequestered in ER.
Conclusion
Fluorescence nanoparticles have been extensively studied and developed for biomedical applications. However, possible toxic effects of the nanoparticles are a persistent concern in in vitro and in vivo applications. In this article, we reported 3MPA-QDs and their interactions with HUVECs. The present study showed that 3MPA-QDs were internalized by HUVECs via active endocytosis, localized in endosomes in ~24 h and transported out of the HUVECs after 48 h. During the 48-h period inside the HUVECs, 3MPA-QDs did not induce any perceptible toxic effects.
One major issue about nanoparticles is the long-term accumulation and storage of nanoparticles in cells, tissues and organs. A brief circulating lifetime of 3MPA-QDs in HUVECs is therefore a potential advantage for many biomedical applications, such as 3MPA-QD-based nanodrug carriers that deliver drug molecules into cells and then leave the cells, where fluorescence modulation of the QDs to extracellular stimulation serves in parallel as the indicator of intracellular location.
3MPA-QDs can further be used as safe optical and electron microscopy (EM) probes and fit perfectly for future use in clinical applications such as real-time tracking and subcellular identification. Moreover, our photophysical study methods open up novel ways to use 3MPA-QDs for accurately discriminating between different intracellular compartments. For example, we demonstrated that fluorescence of 3MPA-QDs located in different intracellular compartments responded differently upon ATP stimulation based on the differences in changes of Ca2+ concentrations in different compartments.
Disclosure
The authors report no conflicts of interest in this work.
References
Bruchez M, Moronne M, Gin P, Weiss S, Alivisatos AP. Semiconductor nanocrystals as fluorescent biological labels. Science. 1998;281(5385):2013–2016. | ||
Chan WCW, Nie S. Quantum dot bioconjugates for ultrasensitive nonisotopic detection. Science. 1998;281(5385):2016–2018. | ||
Michalet X, Pinaud FF, Bentolila LA, et al. Quantum dots for live cells, in vivo imaging, and diagnostics. Science. 2015;307(5709):538–544. | ||
Resch-Genger U, Grabolle M, Cavaliere-Jaricot S, Nitschke R, Nann T. Quantum dots versus organic dyes as fluorescent labels. Nat Methods. 2008;5(9):763–775. | ||
Molnar M, Fu Y, Friberg P, Chen Y. Optical characterization of colloidal CdSe quantum dots in endothelial progenitor cells. J Nanobiotechnology. 2010;8:2. | ||
De Jong WH, Borm PJA. Drug delivery and nanoparticles: applications and hazards. Int J Nanomedicine. 2008;3(2):133–149. | ||
Cooper GM [webpage on the Internet]. Transport of small molecules. The Cell: A Molecular Approach. 2nd ed. Sunderland, MA: Sinauer Associates; 2000. Available from: https://www.ncbi.nlm.nih.gov/books/NBK9847/. Accessed October 12, 2017. | ||
Biessen EA, Vietsch H, Rump ET, et al. Targeted delivery of oligodeoxynucleotides to parenchymal liver cells in vivo. Biochem J. 1991;340(pt 3):783–792. | ||
Diebold SS, Plank C, Cotten M, Wagner E, Zenke M. Mannose receptor-mediated gene delivery into antigen presenting dendritic cells. Somat Cell Mol Genet. 2002;27(1–6):65–74. | ||
Mamot C, Drummond DC, Greiser U, et al. Epidermal growth factor receptor (EGFR)-targeted immunoliposomes mediate specific and efficient drug delivery to EGFR- and EGFRvIII-overexpressing tumor cells. Cancer Res. 2003;63(12):3154–3161. | ||
Biragyn A, Ruffini PA, Coscia M, et al. Chemokine receptor-mediated delivery directs self-tumor antigen efficiently into the class II processing pathway in vitro and induces protective immunity in vivo. Blood. 2004;104(7):1961–1969. | ||
Evans PR, Owen DJ. Endocytosis and vesicle trafficking. Curr Opin Struct Biol. 2002;12(6):814–821. | ||
Maxfield FR, McGraw TE. Endocytic recycling. Nat Rev Mol Cell Biol. 2004;5(2):121–132. | ||
Soldati T, Schliwa M. Powering membrane traffic in endocytosis and recycling. Nat Rev Mol Cell Biol. 2006;7(12):897–908. | ||
Kelf TA, Sreenivasan VKA, Sun J, Kim EJ, Goldys EM, Zvyagin AV. Non-specific cellular uptake of surface-functionalized quantum dots. Nanotechnology. 2010;21(28):285105. | ||
Deanfield JE, Halcox JP, Rabelink TJ. Endothelial function and dysfunction. Circulation. 2007;115(10):1285–1295. | ||
Azizi PM, Zyla RE, Guan S, et al. Clathrin-dependent entry and vesicle-mediated exocytosis define insulin transcytosis across microvascular endothelial cells. Mol Biol Cell. 2015;26(4):740–750. | ||
Alkilany AM, Shatanawi A, Kurtz T, Caldwell RB, Caldwell RW. Toxicity and cellular uptake of gold nanorods in vascular endothelium and smooth muscles of isolated rat blood vessel: importance of surface modification. Small. 2012;8(8):1270–1278. | ||
DuRose JB, Li J, Chien S, Spector DH. Infection of vascular endothelial cells with human cytomegalovirus under fluid shear stress reveals preferential entry and spread of virus in flow conditions simulating atheroprone regions of the artery. J Virol. 2012;86(24):13745–13755. | ||
Duan J, Yu Y, Li Y, et al. Toxic effect of silica nanoparticles on endothelial cells through DNA damage response via Chk1-dependent G2/M checkpoint. PLoS One. 2013;8(4):e62087. | ||
Bergmann S, Schoenen H, Hammerschmidt S. The interaction between bacterial enolase and plasminogen promotes adherence of Streptococcus pneumoniae to epithelial and endothelial cells. Int J Med Microbiol. 2013;303(8):452–462. | ||
Ning ZJ, Molnar M, Chen Y, et al. Role of surface ligands in optical properties of colloidal CdSe/CdS quantum dots. Phys Chem Chem Phys. 2011;13(13):5848–5854. | ||
Li L, Tian G, Luo Y, Brismar H, Fu Y. Blinking, flickering, and correlation in fluorescence of single colloidal CdSe quantum dots with different shells under different excitations. J Phys Chem C. 2013;117(9):4844–4851. | ||
Turdalieva A, Solandt J, Shambetova N, et al. Bioelectric and morphological response of liquid-covered human airway epithelial Calu-3 cell monolayer to periodic deposition of colloidal 3-mercaptopropionic-acid coated CdSe-CdS/ZnS core-multishell quantum dots. PLoS One. 2016;11(2):e0149915. | ||
Shambetova N, Chen Y, Xu H, et al. Acid dissociation of 3-mercaptopropionic acid coated CdSe-CdS/Cd0.5Zn0.5S/ZnS core-multishell quantum dot and strong ionic interaction with Ca2+ ion. J Phys Chem C. 2016;120(6):3519–3529. | ||
Molnar M, Friberg P, Fu Y, Brisslert M, Adams M, Chen Y. Effects of quantum dot labeling on endothelial progenitor cell function and viability. Cell Med. 2010;1(2):105–112. | ||
Sánchez-Hernández Y, Laforenza U, Bonetti E, et al. Store-operated Ca(2+) entry is expressed in human endothelial progenitor cells. Stem Cells Dev. 2010;19(12):1967–1981. | ||
Li L, Chen Y, Tian G, et al. Reversible modification of CdSe-CdS/ZnS quantum dot fluorescence by surrounding Ca2+ ions. J Phys Chem C. 2014;118(19):10424–10433. | ||
Berg TO, Strømhaug E, Løvdal T, Seglen O, Berg T. Use of glycyl-L-phenylalanine 2-naphthylamide, a lysosome-disrupting cathepsin C substrate, to distinguish between lysosomes and prelysosomal endocytic vacuoles. Biochem J. 1994;300(pt 1):229–236. | ||
Kilpatrick BS, Eden ER, Schapira AH, Futter CE, Patel S. Direct mobilisation of lysosomal Ca2+ triggers complex Ca2+ signals. J Cell Sci. 2013;126(pt 1):60–66. | ||
Zhang LW, Bäumer W, Monteiro-Riviere NA. Cellular uptake mechanisms and toxicity of quantum dots in dendritic cells. Nanomedicine (Lond). 2011;6(5):777–791. | ||
Peng L, He M, Chen B, et al. Cellular uptake, elimination and toxicity of CdSe/ZnS quantum dots in HepG2 cells. Biomaterials. 2013;34(37):9545–9558. | ||
Oh E, Liu R, Nel A, et al. Meta-analysis of cellular toxicity for cadmium-containing quantum dots. Nat Nanotechnol. 2016;11(5):479–486. | ||
Sahay G, Alakhova DY, Kabanov AV. Endocytosis of nanomedicines. J Control Release. 2010;145(3):182–195. | ||
Yameen B, Choi WI, Vilos C, Swami A, Shi J, Farokhzad OC. Insight into nanoparticle cellular uptake and intracellular targeting. J Control Release. 2014;190:485–499. | ||
Lunov O, Syrovets T, Röcker C, et al. Lysosomal degradation of the carboxydextran shell of coated superparamagnetic iron oxide nanoparticles and the fate of professional phagocytes. Biomaterials. 2010;31(34):9015–9022. | ||
Laskar A, Ghosh M, Khattak SI, Li W, Yuan XM. Degradation of superparamagnetic iron oxide nanoparticle-induced ferritin by lysosomal cathepsins and related immune response. Nanomedicine (Lond). 2012;7(5):705–717. | ||
Malvindi MA, Matteis VD, Galeone A, et al. Toxicity assessment of silica coated iron oxide nanoparticles and biocompatibility improvement by surface engineering. PLoS One. 2014;9(1):e85835. | ||
Yan M, Zhang Y, Qin H, et al. Cytotoxicity of CdTe quantum dots in human umbilical vein endothelial cells: the involvement of cellular uptake and induction of pro-apoptotic endoplasmic reticulum stress. Int J Nanomedicine. 2016;11:529–542. | ||
Harfouche R, Hussain SNA. Signaling and regulation of endothelial cell survival by angiopoietin-2. Am J Physiol Heart Circ Physiol. 2006;291(4):H1635–H1645. |
 © 2017 The Author(s). This work is published and licensed by Dove Medical Press Limited. The
full terms of this license are available at https://www.dovepress.com/terms
and incorporate the Creative Commons Attribution
- Non Commercial (unported, 3.0) License.
By accessing the work you hereby accept the Terms. Non-commercial uses of the work are permitted
without any further permission from Dove Medical Press Limited, provided the work is properly
attributed. For permission for commercial use of this work, please see paragraphs 4.2 and 5 of our Terms.
© 2017 The Author(s). This work is published and licensed by Dove Medical Press Limited. The
full terms of this license are available at https://www.dovepress.com/terms
and incorporate the Creative Commons Attribution
- Non Commercial (unported, 3.0) License.
By accessing the work you hereby accept the Terms. Non-commercial uses of the work are permitted
without any further permission from Dove Medical Press Limited, provided the work is properly
attributed. For permission for commercial use of this work, please see paragraphs 4.2 and 5 of our Terms.